SAP MII Energy Monitoring for Food and Beverage Plants
By Riley Quinn on May 15, 2026
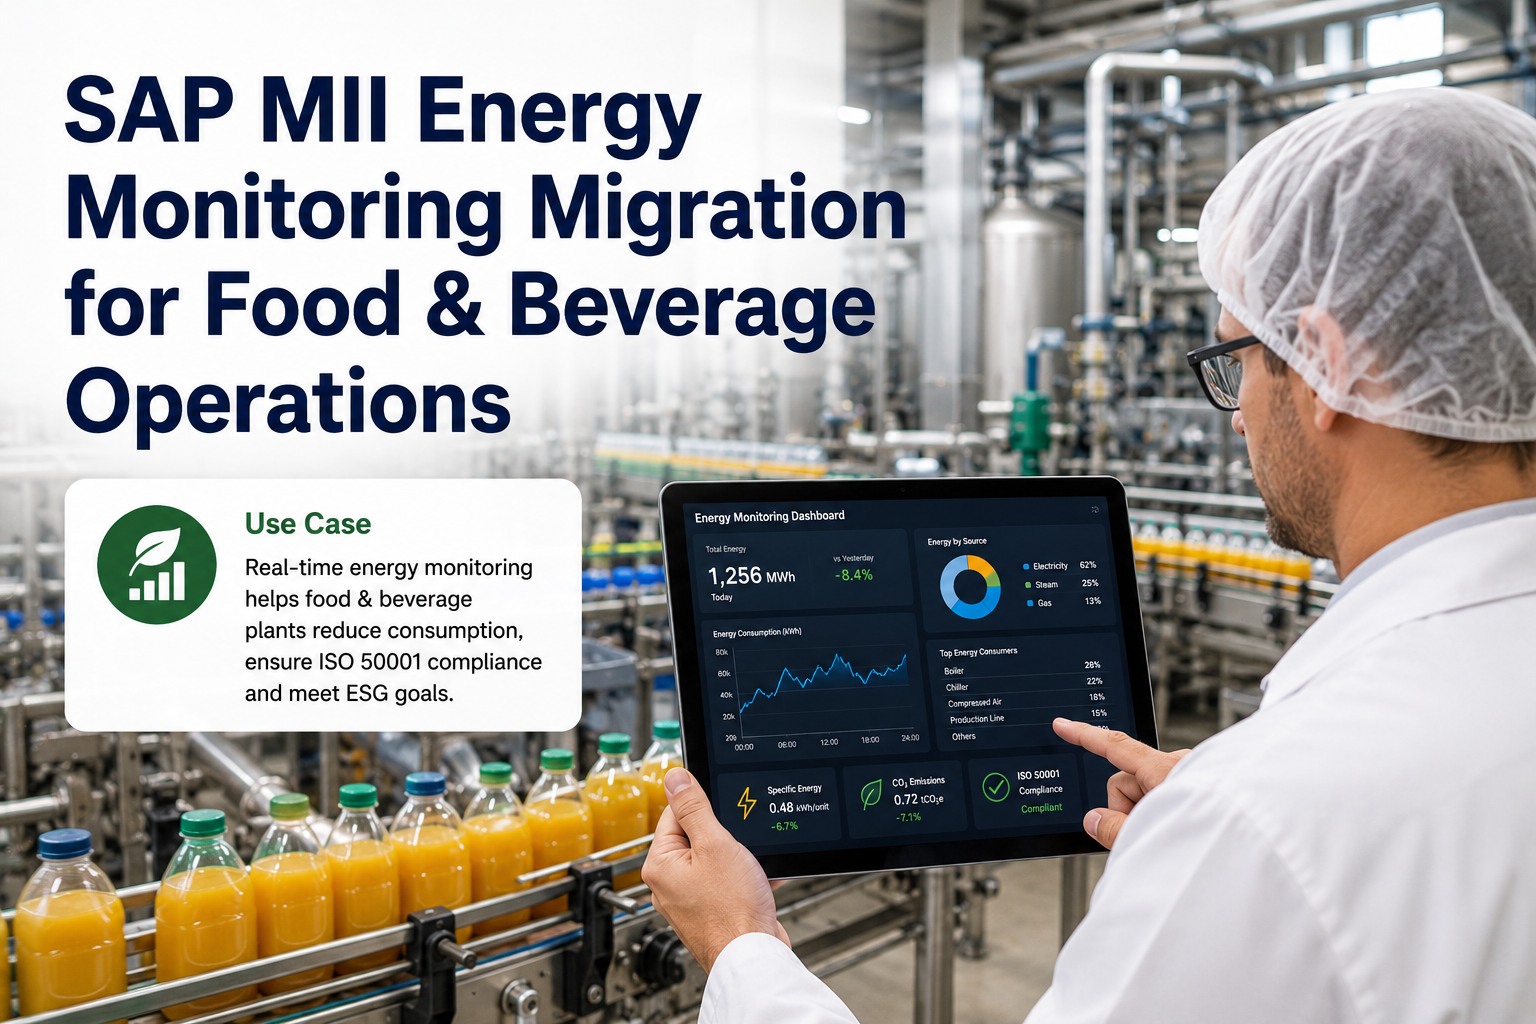
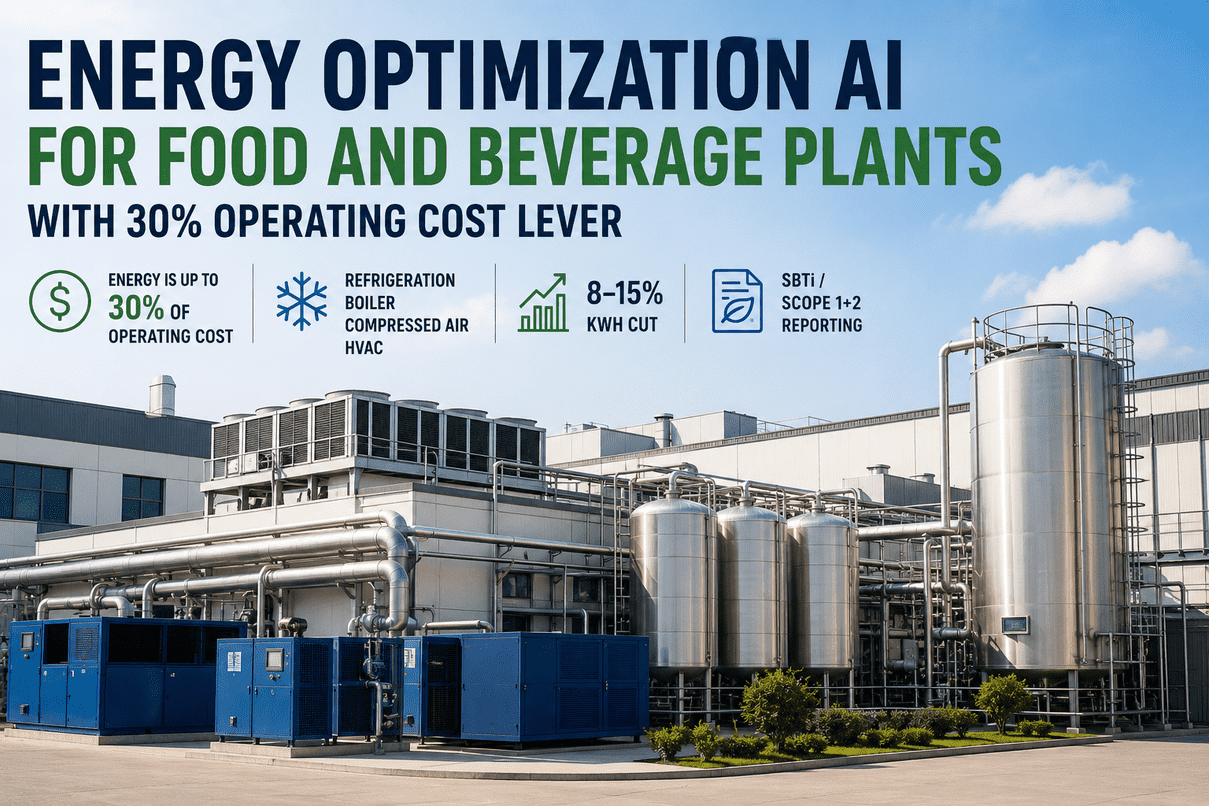
A dairy plant pays for every kWh. The CFO wants 18% reduction by year-end. The sustainability officer needs ISO 50001 recertification in March. The shift supervisor wants to know why the ammonia refrigeration compressors run for 90 minutes after the last production batch. SAP MII shows yesterday's kWh totals by line. None of these four answers come from yesterday's totals. They come from real-time correlation between energy and production, anomaly detection on the four Significant Energy Uses, and AI optimization that prevents the peak-demand spike before it shows up on the utility bill. Book a 30-minute F&B energy walkthrough with our deployment engineers.
ISO 50001 · ESG · kWh PER UNIT · PEAK DEMAND
SAP MII Plots Yesterday's kWh. AI-Native Energy Monitoring Predicts Tomorrow's Bill and Catches the Wasted Watts Today.
Food and beverage plants run on four Significant Energy Uses — refrigeration, steam, compressed air, motors. Each one hides waste that SAP MII dashboards plot historically but never act on. AI-native energy monitoring on NVIDIA on-prem hardware correlates every kWh to production output in real time, catches failed steam traps and air leaks within hours, predicts peak-demand penalties before they trigger, and generates ISO 50001 audit-ready documentation continuously. Pilot in 6 to 12 weeks. Perpetual license. Source code included.
The Four Significant Energy Uses · Where Every kWh in a F&B Plant Lives
ISO 50001 requires identifying Significant Energy Uses — the assets and processes that consume the top 70-80% of plant energy. Food and beverage plants share the same four SEUs almost universally. SAP MII can report the totals. AI-native energy monitoring catches the waste. Talk to our F&B energy support team about your specific SEU mix.
COMPRESSED AIRCompressors · dryers · distribution · users
SAP MIIPlots compressor kWh trend.
AI-NATIVEDetects leaks within hours via off-shift flow signature. 20-30% of compressed air is typically lost to leaks plant-wide.
EVERY SEU MONITORED · EnPI = kWh PER UNIT PRODUCED · ISO 50001 AUDIT-READY
Typical lift · 25-40% energy reduction · 18-month payback
The four SEUs above account for 70-80% of every food and beverage plant's energy bill. Catching the failed steam trap, the idle compressor, and the off-shift air leak is what separates an SAP MII historical dashboard from an AI-native energy platform. Book a 30-minute walkthrough where we model the savings against your actual SEU mix.
Two Real F&B Scenarios · How the On-Prem Stack Solves Them
"Our dairy plant has 14 ammonia refrigeration compressors. SAP MII shows we use 28% of plant energy on refrigeration. It does not tell us why compressor #3 runs for 90 minutes after the last batch each night. How does AI catch this?"
THE PROBLEM
Mid-size dairy plant. 14 ammonia screw compressors serving 6 cold rooms and 3 process chillers. SAP MII shows refrigeration consumes 28% of plant energy — about 4,200,000 kWh/year. Sustainability officer needs 18% reduction for ISO 50001 recertification. The plant manager suspects compressor #3 idles unnecessarily after production ends, but proving it requires correlating compressor power against production batches and cold-room demand — work that takes the engineering team a full week of spreadsheet effort per analysis. Nobody has the time.
HOW THE ON-PREM STACK SOLVES IT
The Meter Bridge (Jetson)
Connects to all 14 compressor power meters plus DCS tags for cold-room temperature, evaporator load, condenser pressure, and production batch state. Every reading tagged with the operating context at the moment of capture.
The Energy Brain (RTX)
AI correlates each compressor's kWh against actual cooling demand. Identifies compressor #3 running at 65% load when cold-room temps are already at setpoint and no production batch is active. Tags the pattern as "idle running" — costs $8,400/year per occurrence.
Auto-Optimization
Engineer reviews the alert, adjusts the compressor sequencing logic to shed #3 when cold-room load drops below 40%. Same logic propagated to all 14 compressors. Continuous monitoring confirms the savings.
THE RESULT
Refrigeration energy -19% in 4 months. $184K annual savings. ISO 50001 recertification passed clean.
SCENARIO 02
"Our beverage plant gets hit with peak-demand penalties twice a quarter. SAP MII shows kWh totals but never warns us before the spike. How do we get ahead of the utility bill?"
THE PROBLEM
Beverage bottling plant. Contract peak-demand limit of 2,100 kW with $42/kW penalty for every 15-minute interval over the limit. The plant exceeds the limit 6-8 times per quarter when bottling-line startup coincides with refrigeration recovery and compressed air recovery. Penalty cost: $48K-$72K annually. SAP MII shows the spikes after they happen — too late to act. Plant manager wants the system to predict and prevent the spike, not document it.
HOW THE ON-PREM STACK SOLVES IT
The Meter Bridge (Jetson)
Subscribes to the main facility power meter plus every major SEU sub-meter at 1-second resolution. Streams to the Energy Brain without flooding the network.
The Energy Brain (RTX)
AI predicts the rolling 15-minute demand based on current trajectory and scheduled production events. When predicted demand approaches 90% of the penalty limit, the engine identifies non-critical loads to throttle — HVAC zones, secondary chillers, staging ovens.
Closed-Loop Load Shedding
Automatic throttling commands sent to non-critical loads via DCS for 8-15 minutes — long enough to flatten the curve, short enough to be invisible to operations. Peak demand stays below the penalty threshold.
THE RESULT
Peak-demand violations from 6-8/qtr to 0. $60K annual penalties eliminated. Plant manager sleeps through utility-bill day.
Frequently Asked Questions
The most common questions food and beverage sustainability officers, plant directors, and energy managers ask when upgrading SAP MII energy monitoring to AI-native energy management. Talk to our F&B deployment support team.
Do we have to replace SAP MII energy monitoring immediately?
No. The AI-native platform runs alongside SAP MII through the transition. Meter readings, EnPI calculation, anomaly detection, peak-demand prediction, and ISO 50001 documentation move to the new platform on the RTX Energy Brain. SAP MII continues to handle existing energy dashboards until you choose to retire them. By December 2027 the cutover completes, but you operate on the new platform from week 8 onward — typically as the primary energy intelligence layer by week 12.
Will it work with our existing power meters and DCS?
Yes. The Jetson Meter Bridge connects to all major industrial meter brands — Schneider PowerLogic, Siemens Sentron, ABB EQ meters, Eaton, GE Multilin, Janitza, Carlo Gavazzi — via Modbus TCP, BACnet, IEC 61850, M-Bus, or OPC-UA. Bidirectional integration with Honeywell Experion, Yokogawa Centum, Emerson DeltaV, Siemens PCS 7, and Rockwell PlantPAx for SEU process tags. Sub-meters can be added incrementally as the SEU inventory expands.
How does the platform handle ISO 50001 audit documentation?
Continuously, not annually. The platform maintains a rolling 12-month production-normalized energy baseline, calculates the EnPI (kWh per unit produced) for every shift, tracks improvement against the baseline, and generates the auditor-required reports on demand. SEU identification, EnPI definition, baseline normalization with relevant variables (production volume, ambient temperature, product mix), and improvement evidence are all auto-maintained. ISO 50001 surveillance audits typically take 2 days instead of the 2-week scramble that preceded them.
How fast does the platform pay back?
Food and beverage plants typically see 18-month payback or faster on the all-in platform cost. The fast-paying wins come first — failed steam traps (each $5K-$10K/yr saved), idle-running compressors ($8K-$15K/yr per asset), compressed air leaks (20-30% recovery), peak-demand penalty avoidance ($40K-$80K/yr typical). Larger savings follow from systematic optimization across the four SEUs. ISO 50001 certified facilities typically see 25-40% total energy reduction over 24 months.
How fast can we get a pilot live?
Eight to ten weeks from contract signature. Weeks 1-2 — site survey, SEU prioritization, meter inventory confirmed, ISO 50001 scope mapped. Weeks 3-4 — Jetson Meter Bridge deployed in the main electrical room, DCS process tags mapped, baseline data capture begins. Weeks 5-6 — RTX Energy Brain live, EnPI dashboards configured per SEU, anomaly detection models warming up on 30+ days of plant history. Weeks 7-8 — peak-demand prediction active, ISO 50001 audit-pack generator validated, sustainability officer trained on the live system.
Book a 30-minute call with our F&B deployment engineers. Walk through your four SEUs, your peak-demand contract, and your ISO 50001 timeline. See AI-native energy monitoring live against your meter data and production output. Pilot in 8 weeks. Buy it once, own it forever — no monthly fees, source code included.