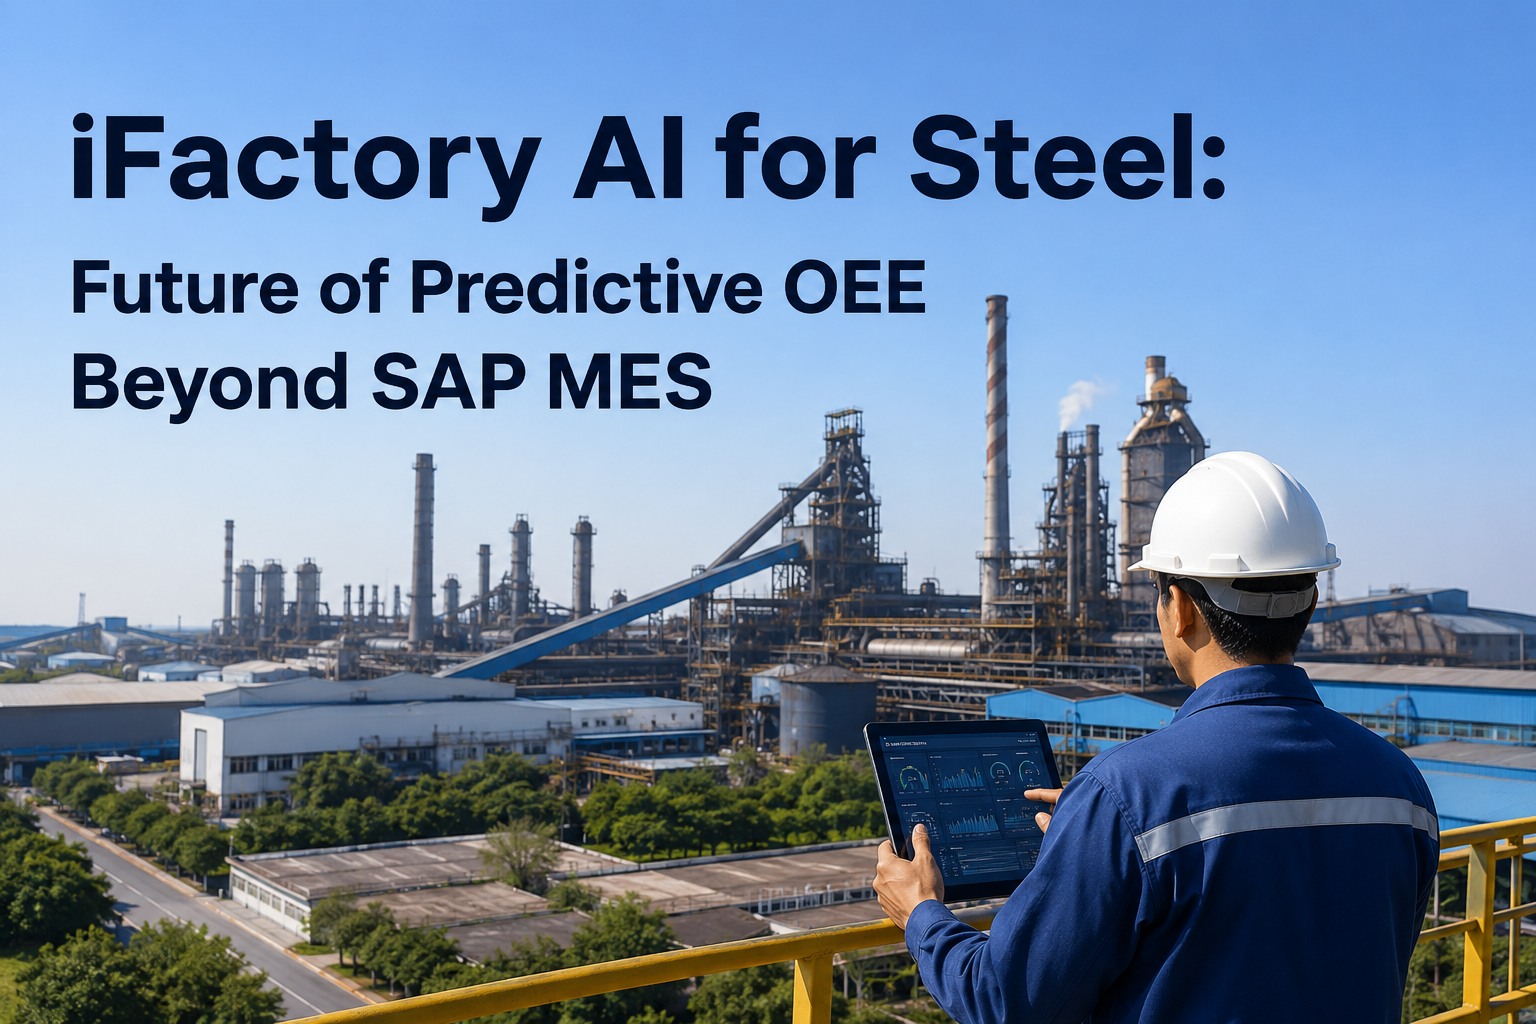
For most steel mills, OEE is a number that gets reported on Monday morning describing what happened the week before. That is reactive OEE — useful for governance, useless for the production losses already absorbed. Predictive OEE is the operational shift now reshaping how integrated steel works are run — forecasting availability, performance, and quality losses days to weeks ahead of when they would have hit the line, and triggering the maintenance, scheduling, or process intervention that prevents the loss entirely. Traditional SAP MES platforms — MII, ME, and DMC — were built for descriptive reporting against ERP. They were not built to forecast a sticker breakout in a continuous caster, anticipate a hydraulic pack failure on a hot strip mill, or predict yield losses on a cold rolling tandem two shifts before they happen. iFactory AI is the steel-specific predictive OEE platform purpose-built for that shift, deployed on-premise via NVIDIA edge appliances pre-loaded with steel models for blast furnace, melt shop, caster, and rolling mill operations. This guide walks through what predictive OEE in steel actually means, how it moves beyond SAP MES, and the economic case it makes per mill.
iFactory AI for Steel — The Future of Predictive OEE Beyond SAP MES
AI-powered predictive OEE software for integrated steel works — forecast downtime, optimize throughput, predict quality losses, and modernize beyond legacy SAP MES platforms. On-prem NVIDIA edge AI, steel-specific models for blast furnace through finishing lines, live in 30 days.
The OEE Reality Inside a Modern Steel Mill
The numbers below are the steel-sector benchmarks chemical and automotive plants rarely contend with. A typical integrated steel works runs OEE in the 60–70% range. World-class is 75–85%. The gap is large, the economics are larger, and the bulk of the lost OEE lives in places SAP MES dashboards never look — micro-stoppages, micro-yield-losses, and slow speed degradation that does not register as an event.
Where Steel OEE Actually Leaks — Mill Flow Loss Map
Steel is not one process; it is six tightly-coupled processes where a loss in one zone propagates downstream. The visualization below maps where OEE actually leaks across an integrated works, from coke ovens through finishing lines, with the dominant loss categories at each stage.
Want this loss map built for your specific mill? Book a mill demo and the iFactory steel practice will return a zone-by-zone predictive OEE assessment based on your current SCADA, automation, and SAP MES data.
Reactive OEE vs Predictive OEE — Why the Future Looks Different
The difference is not a faster dashboard. The difference is the horizon. Reactive OEE measures losses after they happen; predictive OEE forecasts them with enough lead time to act. The diagram below contrasts the two on the same week of production.
The Six Big Losses — Steel Edition
OEE math decomposes losses into six classical categories. In steel, the loss profile is sharply skewed toward availability — equipment failures and changeover/setup time dominate. The six losses below are the steel-sector versions, with the predictive opportunity for each.
01 · Equipment failures
Caster breakouts, mill hydraulic failures, blast furnace stoves. The largest single OEE drag in steel — and where predictive analytics delivers the highest lift.
02 · Setup & changeover
Roll changes, mould changes, heat-to-heat transitions. Often treated as fixed overhead — predictive scheduling shortens it.
03 · Minor stoppages
Sub-5-minute micro-stops that never appear in shift reports. The hidden 3–5 OEE points SAP MES dashboards do not capture.
04 · Reduced speed
Slow speed drift on rolling mills, casting speed reductions for quality concerns, throughput losses across furnaces.
05 · Process defects
Surface defects on hot/cold rolling, gauge violations, coating defects on galvanizing. Quality losses that downgrade or scrap product.
06 · Yield loss
Heat yield variance, crop losses, slab-to-coil conversion losses. The quality category that hides the largest tonnage in steel.
What Predictive OEE Actually Forecasts
Predictive OEE is not one model; it is a layered forecasting stack — equipment health, process behavior, quality risk, and throughput — running continuously on streamed plant data. The capabilities below are what iFactory's steel models deliver out of the box.
Equipment failure forecasting
3–6 weeks advance warning on critical assets — caster segments, mill hydraulic packs, furnace stoves, motor drives. Lead time long enough for planned intervention.
Throughput & performance drift
Slow speed degradation on rolling mills, casting speed reductions, furnace cycle creep. Caught before the trend becomes a problem.
Quality excursion prediction
Forecast surface defects, gauge violations, coating issues from upstream process signals. Reroute or correct before scrap accumulates.
Yield & chemistry forecasting
Heat-level yield prediction, slab-quality scoring, crop loss forecast. The metallurgical loss category SAP MES rarely touches.
Caster breakout prevention
Sub-second mould thermocouple analysis at 100Hz+ catches sticker formation before strand exits the mould. Single-event ROI in days.
OEE forecast at horizon
Shift-, day-, and week-ahead OEE forecast with confidence interval. Production planning gets a real number, not a hope.
Beyond SAP MES — Why Predictive OEE Needs a Different Platform
SAP MES — MII, ME, and DMC — was architected for descriptive reporting against ERP, not for sub-second edge AI inference, multivariate process modeling, or 100Hz sensor consumption. The gap below is structural, not configurable.
| Capability | SAP MES (MII / ME / DMC) | iFactory AI Predictive OEE |
|---|---|---|
| OEE measurement horizon | Past-tense reporting | Hours to weeks forward |
| Sensor ingestion rate | 1 Hz typical via PCo | 100 Hz+ at the edge |
| Edge AI inference latency | Cloud round-trip 200–500ms | Sub-50ms on-prem |
| Steel-specific failure models | Generic or absent | Pre-loaded per zone |
| Micro-stoppage capture | Manually flagged | Automatic from automation |
| Quality & vision integration | Custom-built | Native AI vision pipeline |
| SAP S/4 / ERP integration | Native | Native adapter library |
| Typical go-live | 18–30 months | 30 days first alerts · 6–12 weeks full |
| Year-1 cost (per mill) | $2–5M | $0.7–2.0M turnkey |
Swipe horizontally on mobile to view the full comparison.
The $200M Math — Economic Case Per Mill
20 OEE points of recoverable gap at a typical 2 MTPA mill
The economics in steel are unforgiving on both sides. A single caster breakout costs roughly $500K. A 1 OEE point shift at a 2 MTPA mill is worth around $10M annually. The chain below shows how predictive OEE compounds across zones.
Want this math run for your specific mill capacity and current OEE? Send your zone-level OEE numbers and SAP MES estate to iFactory support — the steel practice returns a value model within 3 business days, no obligation.
30-Day to Live Predictive OEE — Implementation Path
Connect & Calibrate
NVIDIA edge appliance arrives racked and ready. Read-only connectivity to existing SCADA, PLC, DCS, and SAP MES. Zone-specific steel models loaded. No production impact.
First Predictive Alerts
Caster, rolling mill, and furnace models activated against your plant's first 20 days of data. Alerts go to mobile field access. Bi-directional SAP PM integration goes live.
Cross-Zone Intelligence
Cross-zone correlation analytics activated — linking upstream quality events to downstream defects. Full OEE tracking across all zones. Models retrained on 90 days of plant-specific data.
The future of OEE in steel is predictive — and it runs at the edge.
iFactory AI delivers steel-specific predictive OEE on NVIDIA edge appliances inside your mill — 72% fewer unplanned stoppages, 3–6 weeks advance warning, live in 30 days. Strategic briefings available this week with the iFactory steel practice.
FAQ — Predictive OEE for Steel
Does iFactory replace our SAP MES or run alongside it?
Either, depending on your strategy. Most steel mills run iFactory alongside SAP MES initially — iFactory handles predictive OEE, edge AI inference, and steel-specific quality intelligence, while SAP MES continues to handle ERP-side execution and reporting. Over time, the SAP MES layer is often retired or reduced to its ERP-integration role. The migration path is workload-by-workload at the steel team's pace. Book a mill demo to see the parallel-run pattern.
What steel-specific AI models come pre-loaded?
Pre-loaded model libraries cover blast furnace stoves and tuyere monitoring; BOF and EAF heat chemistry and refractory wear; ladle metallurgy and tundish flow; continuous caster mould level, breakout prediction, and segment alignment; reheating furnace combustion; hot strip mill hydraulic and vibration models; cold rolling tandem mill tension and gauge; and finishing line coating and surface vision models. Each model is trained on steel-sector failure data and adapted to your plant during the first 90 days.
How does sub-second caster breakout prediction work?
Mould thermocouple data is sampled at 100 Hz+ and processed at the edge — typically on the NVIDIA appliance racked at the caster house. ML models detect sticker formation patterns roughly 30–60 seconds before strand exit, triggering automatic casting speed reduction or stop. The economics are blunt: each prevented breakout saves around $500K. Cloud-bound architectures cannot deliver this — round-trip latency is fundamentally too high.
How are micro-stoppages under 5 minutes captured?
iFactory connects directly to the mill and caster automation — not through SAP PCo's polling cadence. Every stop, every speed reduction, every state transition is captured at the source. Sub-5-minute events that never appear in shift reports become visible in real time. Most steel plants discover 3–5 OEE points of hidden micro-stoppage loss in the first 30 days alone.
What does deployment look like for a brownfield mill?
NVIDIA edge appliance arrives racked and ready. Read-only connectivity to existing SCADA, PLCs, DCS, and SAP MES is established without production impact. Steel models are loaded and adapted during the first 30 days. Bi-directional SAP PM integration goes live by day 30 — predictive alerts generate SAP work orders, completion status flows back. Full plant-wide predictive OEE typically by day 90.
What if our mill is mostly EAF-based, not integrated?
EAF-centric mini-mills are a strong fit. iFactory's EAF models cover heat chemistry, electrode consumption, refractory wear, and tap-to-tap optimization. The predictive OEE math at a mini-mill skews even more toward the melt shop and caster — and that is exactly where iFactory's steel-specific models deliver the highest lift. Deployment timelines are typically shorter than for integrated works.
What does a mill demo cover?
A 30-minute session with the iFactory steel practice. Walks through the predictive OEE platform, caster breakout prediction in action, hot rolling mill failure forecasting, cross-zone analytics, and the 30-day deployment path. Output is a tailored value model and turnkey quote for your specific mill capacity and SAP MES estate.
Move OEE from past-tense reporting to forward-looking forecast.
The shift is operational, not theoretical — iFactory steel customers are running 72% fewer unplanned stoppages and recovering double-digit OEE points within 90 days. NVIDIA edge appliance, steel-specific models, full BOM, live in 30 days. Sessions available this week.