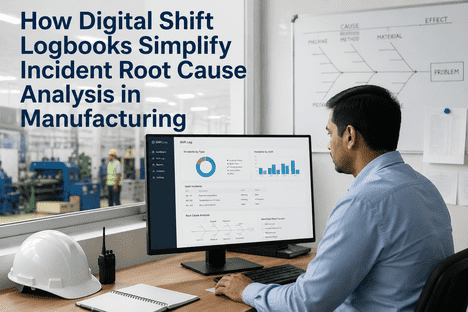
A plant manager stares at a weekly downtime report and wonders why OEE dropped 6 points this month. The answer is buried in 14 shift logbooks, scattered across three departments, written in four different handwriting styles — and two critical entries are simply missing. With a digital shift logbook, every shift event feeds your KPIs automatically, in real time, with zero manual data entry.
OPERATIONAL KPIS · SHIFT LOGBOOK PERFORMANCE GUIDE
The KPIs That Move When You Fix Shift Data
Downtime, defect rate, MTTR, OEE, audit compliance — every operational KPI you track is only as good as the shift data behind it. Here is exactly what changes when that data becomes structured, real-time, and searchable.
+19%
OEE improvement reported
-40%
fabric defect rate reduction
-77%
shift handover time saved
-99%
mean time to escalate
Why Your KPIs Are Lying to You
Most manufacturers believe their operational KPIs reflect reality. They do not. They reflect what got recorded — which, on a paper logbook system, is 38 to 62 percent of what actually happened on the shop floor. The rest is lost at shift handover, mis-filed, illegible, or simply never written down.
In textile manufacturing, this gap is catastrophic. A yarn break frequency that appears as four incidents in the logbook may actually be fourteen — because Ring Frame 7 was noisy during the night shift and the operator assumed someone else would write it up. A dyeing deviation that shows up as a one-off quality exception may be a weekly pattern that three shift supervisors each saw independently but never connected.
A digital shift logbook does not just improve your process. It makes your KPIs truthful for the first time.
?
The data gap problem: Studies of Indian textile plants show that 62% of shift-level incidents either go unrecorded or are recorded incompletely in paper logbooks. Every KPI calculated from that data carries the same 62% blind spot.
Book a demo to see what your real numbers look like.
The 8 Operational KPIs Most Affected by Shift Data Quality
Not every KPI is equally sensitive to shift data quality. These eight are the ones that move fastest and furthest when manufacturers switch from paper logbooks to a structured digital shift management platform.
01
Overall Equipment Effectiveness (OEE)
Typical improvement
+13–19%
OEE is the composite of availability, performance, and quality. All three inputs are shift-data-dependent. When downtime reasons are mis-coded, speed losses go unnoted, and quality defects are logged 3 hours after the fact, your OEE is directionally wrong. Digital shift logging captures the right codes at the right time — directly from the operator at the machine.
How it works in iFactory
Operators select downtime reason codes from a guided dropdown at the machine. The system timestamps start and end automatically. No manual calculation. OEE feeds live to the dashboard without a single spreadsheet formula.
02
Mean Time to Repair (MTTR)
Typical improvement
-30–45%
MTTR starts the clock at fault detection and stops it at restoration. With paper logbooks, fault detection is the moment a supervisor reads the log — which may be 2–4 hours after the operator noticed the problem. With digital logging, fault detection triggers an instant alert. The clock starts immediately, escalation is automatic, and technicians arrive with full context already on their device.
How it works in iFactory
Critical fault entries auto-escalate to maintenance planners in under 60 seconds. Work orders are created with full shift context — no phone calls, no repeat descriptions. Technician arrival and repair completion are timestamped automatically.
03
Quality Defect Rate
Typical improvement
-35–40%
In textile manufacturing, quality defects originating in one stage are almost always detected in a later stage — sometimes two or three shifts later. Without structured shift records linking defect observations to specific machines, lots, and process parameters, root cause analysis is guesswork. Digital logbooks create the traceable chain from loom to inspection that makes defect reduction systematic rather than reactive.
How it works in iFactory
Every quality deviation is logged against the specific asset, batch, and shift. AI pattern detection surfaces recurring defect types on the same machine or time window. Quality teams get structured data — not handwritten notes — for every root cause investigation.
04
Unplanned Downtime Frequency
Typical improvement
-25–35%
Most unplanned downtime events have warning signs that appeared 1–3 shifts earlier — a vibration observation, a temperature drift, an unusual noise. On paper, those warnings stay in the logbook and are never connected to the failure that follows. AI-powered pattern detection in a digital logbook surfaces those pre-failure signals before the breakdown occurs.
How it works in iFactory
AI reads across all shift entries in real time. When it detects a pattern — same machine, increasing frequency, related event types — it raises a predictive flag. Maintenance planners can schedule a planned intervention instead of responding to an unplanned breakdown.
05
First-Pass Yield (FPY)
Typical improvement
+8–14%
First-pass yield is the percentage of fabric that goes through every production stage without rework or rejection. In multi-stage textile operations, FPY losses compound — a 2% loss at spinning, a 1.5% loss at weaving, and a 2.5% loss at dyeing combine into 6% or more of production value destroyed. Structured shift data makes each stage's contribution to FPY loss visible and actionable.
How it works in iFactory
Batch-level quality data is logged at each stage and linked through the production chain. Stage-wise FPY is calculated automatically and visible on the shift dashboard. Department heads see their stage's contribution to overall yield without waiting for end-of-day reporting.
06
Mean Time Between Failures (MTBF)
Typical improvement
+20–30%
MTBF improves when maintenance decisions are based on real failure patterns rather than fixed schedules. That requires clean, complete, machine-level failure history — exactly what paper logbooks cannot reliably provide. Digital shift logging creates the failure history database that drives condition-based maintenance and extends equipment life.
How it works in iFactory
Every fault event is timestamped and linked to the asset record. MTBF is calculated automatically per machine and visible in the maintenance KPI dashboard. Maintenance planners can identify which machines are trending toward shorter failure cycles before the pattern becomes a crisis.
07
Shift Handover Efficiency
The average paper-based shift handover in a textile plant takes 18–25 minutes and still misses critical information. Incoming supervisors spend the first hour of their shift discovering problems that the outgoing shift already knew about. That lost time compounds across three shifts, seven days a week, 365 days a year — amounting to thousands of hours of reactive fire-fighting that should never have started.
How it works in iFactory
At shift end, AI automatically generates a ranked handover briefing — open issues, critical events, pending actions, machine states. The incoming supervisor reviews and acknowledges it on their device before the shift starts. Handover time drops from 22 minutes to under 5 minutes, with fewer missed items.
08
Audit Compliance Rate
Typical improvement
Near 100%
Buyer audits, ISO 9001 reviews, GOTS certification inspections, and OEKO-TEX assessments all require complete, timestamped process records. Paper logbooks routinely fail these audits — not because the plant performed poorly, but because the records are incomplete, illegible, or cannot be compiled fast enough. Digital shift records are immutable, timestamped, and searchable from day one.
How it works in iFactory
Every shift entry is user-attributed, timestamped, and stored in an immutable audit trail. Audit reports are generated in hours, not days. iFactory supports ISO 9001, ISO 14001, GOTS, OEKO-TEX, and buyer-specific audit formats — with full-text search across months of records in seconds.
Which of these KPIs is your biggest challenge right now? Book a 30-minute demo and we'll show you exactly what iFactory moves in your specific context — looms, spinning frames, dyeing lines, or any textile process equipment.
The Textile-Specific KPI Challenge
Textile manufacturing presents a unique KPI challenge: the process is multi-stage, multi-shift, and multi-department, but quality outcomes are often not visible until the end of a production chain that began 12 or 24 hours earlier. By the time a fabric defect appears at inspection, the root cause may be in the spinning room from the previous day's night shift — recorded in a logbook that no one has connected to the inspection finding.
?
Spinning
Yarn break rate · Count CV% · Machine efficiency
→
?
Warping
Beam quality · End breakage · Tension uniformity
→
?
Weaving
Picks/min · Loom efficiency · Defect rate
→
?
Dyeing
Colour delta · pH stability · Batch consistency
→
?
Inspection
FPY · Rejection rate · Grade distribution
A digital shift logbook creates the traceability chain that links an inspection-stage rejection back to the specific machine, shift, operator, and process parameter at the spinning or weaving stage where the defect originated. That chain is what transforms defect reduction from reactive to predictive.
CONNECT YOUR STAGES
See End-to-End Traceability in 15 Minutes
Watch iFactory link a dyeing rejection back to the spinning shift that caused it — live, on your asset types, with your process parameters.
How Shift Data Connects to Each KPI Layer
The relationship between shift data quality and KPI performance is not indirect — it is the direct input. Here is exactly how each layer of a digital shift logbook feeds the KPIs that matter most to plant managers and production heads.
What the Numbers Look Like: Before and After
These are the metrics textile and process manufacturers report within 90 days of switching from paper logbooks to iFactory's digital shift management platform. The improvements are not marginal — they are structural, because they address the data gap that was quietly undermining every KPI all along.
Mean Time to Escalate
-99%
Issues Missed at Handover
-95%
Audit Preparation Time
-94%
Want to see what these numbers look like for your specific plant? Book a demo — bring your current OEE and defect rate numbers and we'll model the improvement potential for your asset mix.
Common KPI Measurement Mistakes Paper Logbooks Create
Paper-based shift logging does not just limit your KPIs — it actively distorts them in ways that lead to wrong decisions. These are the most common measurement errors manufacturers discover when they switch to a digital system and see their real data for the first time.
1
Downtime Under-Reporting
Short stoppages under 5 minutes are almost never logged on paper — operators restart the machine and move on. These micro-stoppages can account for 8–12% of total production time. When they are not captured, OEE is systematically overstated and the actual loss is invisible to management.
2
Wrong Downtime Reason Codes
When operators write downtime reasons freehand, the same failure gets described differently by different people — "motor fault," "M/C trip," "electrical issue," "panel problem" all describe the same event type. Maintenance planning based on this data is working from a deliberately fragmented picture.
3
Defect Attribution Lag
A defect detected at inspection is logged at inspection — not at the stage where it originated. This makes the inspection stage appear responsible for the defect rate when the real source is upstream. Root cause analysis starts in the wrong place and quality improvement efforts are misdirected.
4
Survivor Bias in Incident Records
On paper, only the incidents that feel important enough to write up get recorded. The 14 yarn breaks on Ring Frame 7 each feel like isolated minor events — individually, none triggers a write-up. Cumulatively, they represent a machine trending toward failure. Paper logbooks miss cumulative patterns by design.
5
MTTR Inflation from Detection Lag
If a fault is noticed at 2 AM but not actioned until the supervisor reads the logbook at 6 AM, the 4-hour gap is invisible in MTTR calculations unless the initial observation was timestamped. It usually was not. MTTR looks acceptable but is masking hours of unaddressed failure time every shift.
Setting Up KPI Dashboards From Shift Data: The iFactory Approach
Knowing that shift data affects your KPIs is one thing. Knowing how to configure a system that turns shift entries into live KPI dashboards is another. Here is the technical approach iFactory uses to convert operator-level logging into plant-level intelligence.
STEP 1
Define Your KPI Hierarchy
Before go-live, iFactory maps your target KPIs — OEE, MTTR, defect rate, FPY, etc. — to the specific shift event types that feed them. Each KPI gets a defined calculation method, data source, and alert threshold. Nothing is ambiguous from day one.
STEP 2
Configure Event-to-KPI Mapping
Every shift event type is tagged with the KPIs it feeds. A "machine stop" event tagged as "planned maintenance" feeds MTBF differently than one tagged "unplanned breakdown." Operators choose from structured dropdowns — KPI calculation is automatic.
STEP 3
Connect Asset and Production Data
iFactory imports your asset hierarchy from CMMS and production orders from ERP. Every shift event links to the right machine and batch automatically — no manual cross-referencing between systems. KPIs are calculated at asset level, department level, and plant level simultaneously.
STEP 4
Set Threshold Alerts and Escalation Rules
When a KPI breaches a defined threshold — OEE dropping below 70%, defect rate exceeding 3%, MTTR exceeding 2 hours — the system escalates automatically to the right person. Plant managers and production heads see problems in real time, not in the morning report.
STEP 5
Live Dashboard and Shift Reports
KPI dashboards are live from the first shift. Shift reports are auto-generated at shift end — no manual compilation. Plant managers receive a shift performance summary on their device before they walk onto the floor. Department heads see their stage KPIs against target, in real time.
Ready to see your KPI dashboard built for your plant? Book a demo — we'll configure a live view using your machine types and target KPIs in the session itself.
Frequently Asked Questions
How quickly do KPIs improve after switching to a digital shift logbook?
Most plants see measurable movement in MTTR and handover efficiency within the first two weeks — these improve immediately when escalation is automated and handover briefings are AI-generated. OEE and defect rate improvements typically become visible within 30–60 days, as structured data accumulates and AI pattern detection begins surfacing actionable insights. MTBF improvements follow 60–90 days in, as the failure history database becomes statistically meaningful.
Can iFactory calculate OEE automatically from shift logs?
Yes. iFactory calculates OEE at the machine, line, department, and plant level automatically. Availability is calculated from timestamped downtime events with structured reason codes. Performance is fed from loom monitoring or manual speed inputs. Quality is pulled from shift-logged defect data. The three components combine into a live OEE figure without any spreadsheet formula work.
We already have an MES — does iFactory duplicate our KPI data?
No. iFactory integrates bi-directionally with your MES, pulling production data in and pushing shift-enriched event data back. The shift logbook adds the operator-observed context — the bearing noise, the tension drift, the supervisor's note about incoming yarn quality — that MES systems do not capture from sensors alone. Your KPIs get richer inputs, not duplicate entries.
Can we benchmark our KPIs against other textile plants?
iFactory provides benchmarking against anonymised industry data from the textile sector — including OEE ranges by machine type, average MTTR for specific fault categories, and defect rate benchmarks by fabric type and process stage. This gives your management team context for your numbers beyond internal historical comparison.
What KPI reports can we export for buyer or audit review?
iFactory generates structured KPI reports covering production efficiency, quality performance, downtime analysis, maintenance compliance, and safety incident records. These are formatted for ISO 9001, GOTS, and OEKO-TEX audit requirements, and can be customised for buyer-specific reporting formats. Export to PDF, Excel, or direct API feed to your ERP.
Does iFactory support multi-plant KPI comparison?
Yes. Group-level dashboards allow plant managers and corporate operations teams to compare KPIs across multiple facilities — OEE by plant, defect rates by production line, MTTR by asset category. Plants are benchmarked against each other and against group targets, with drill-down to shift-level data for any anomaly.
START MEASURING WHAT ACTUALLY HAPPENED
Your KPIs Are Only as Good as Your Shift Data
See how iFactory turns every shift entry into a KPI input — and turns your operational data from a lagging report into a real-time management tool. Book a 15-minute demo using your plant's asset types.