At 3:42 AM, a compressor's vibration spiked by 18%. The IoT sensor captured it instantly. The signal passed through the edge gateway, was classified by the AI model as a bearing degradation pattern, and triggered an entry in the digital shift logbook — timestamped, attributed, and linked to a work order in the CMMS — all before the operator had finished their previous task. By 7:00 AM shift change, the incoming crew saw the alert, the diagnosis, the recommended intervention window, and the parts status on their shift summary screen. The bearing was replaced during a planned 45-minute window at 10:00 AM. Line 4 never went dark. This is the difference between IoT data that generates noise and IoT data connected to a digital shift logbook that generates action. iFactory closes the complete loop — from sensor signal to shift record to work order to resolution — without a single manual step in between. Book a Demo to see how iFactory's IoT integration turns sensor data into predictive maintenance actions through the shift logbook.
iFactory · IoT + Shift Intelligence
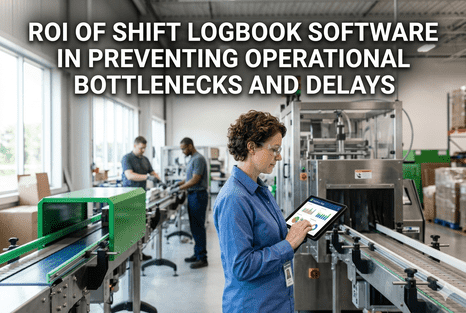
Sensor Data Alone Doesn't Prevent Failures. This Does.
iFactory connects IoT sensor streams directly to the digital shift logbook — turning vibration anomalies, temperature drift, and pressure deviations into structured shift entries, auto-generated work orders, and predictive maintenance actions before breakdowns occur.
Vibration · Temp · Pressure
OPC-UA · MQTT · Modbus
SAP PM · Maximo · Oracle EAM
30–90 Day Failure Prediction
95% AI Accuracy
IoT PREDICTIVE FEED — PLANT A
03:42:18
03:42
Compressor C-3 — Bearing Degradation
Vibration +18% · RUL: 6 days · WO #4820 auto-created · SAP PM synced
03:18
Motor M-7 — Winding Temp Drift
+0.5°C/day × 9 days · AI confidence 87% · WO scheduled
02:55
Pump P-4 — Pressure Baseline Normal
Auto-logged from IoT · All parameters within limits
02:30
WO #4815 Closed — Bearing Replaced
Predicted 12 days ago · 0 min unplanned downtime · J. Rivera
01:15
Shift B Handover Acknowledged
3 open predictive alerts reviewed · Incoming: S. Torres · e-signed
Why IoT Data Without a Connected Shift Logbook Is Half the System
The promise of IoT in manufacturing is well established: sensors on motors, bearings, pumps, and compressors stream continuous data that AI models analyse for degradation patterns, predicting failures weeks before they occur. The technology works. The problem is the gap between what the sensor detects and what the maintenance team actually does about it. Most IoT deployments generate alerts that arrive in a separate system — a condition monitoring dashboard, an email, a SCADA alarm — that operators must notice, interpret, and manually translate into a logbook entry and a work order. That translation step is where predictive intelligence breaks down. iFactory eliminates it entirely by connecting the IoT data stream directly to the digital shift logbook, auto-logging every sensor anomaly as a structured shift event and auto-generating the work order in the CMMS — closing the loop without any human handoff between detection and response.
25–40%
Real-world unplanned downtime reduction from IoT-connected predictive maintenance
30–90
Days in advance iFactory AI predicts equipment failures with 95% accuracy
25%
Productivity increase from predictive vs. reactive maintenance (Deloitte)
0 sec
Manual steps between IoT anomaly detection and CMMS work order creation in iFactory
The Complete IoT-to-Maintenance Loop iFactory Closes
Most IoT deployments for predictive maintenance stop at the alert. iFactory starts there and closes the complete operational loop — from sensor signal through shift record, work order, technician assignment, resolution, and back to model improvement. Every step is logged, attributed, and auditable.
1
IoT Sensors Stream Continuous Data
Vibration, temperature, pressure, current draw, and acoustic sensors on motors, bearings, pumps, compressors, and gearboxes stream data at sub-second intervals through OPC-UA, MQTT, Modbus, and BLE protocols. Battery-powered wireless sensors install in minutes without wiring or machine modification. Existing SCADA sensors feed iFactory immediately.
↓
2
AI Detects Anomaly and Calculates RUL
iFactory's ML engine learns the normal operating baseline for every monitored asset — its unique energy fingerprint. When real-time data deviates, the AI classifies the anomaly type (bearing degradation, winding temperature drift, seal wear, current signature shift), calculates the Remaining Useful Life (RUL), and assigns a failure probability score with a confidence interval. Predictions accurate to 30–90 days with 95% confidence.
↓
3
Event Auto-Logged in Digital Shift Logbook
The anomaly is automatically written to the shift logbook as a structured entry — timestamped, attributed to the asset and sensor, classified by severity, and visible to the current shift operator and supervisor. The event appears in the unified timeline alongside operator observations, quality deviations, and safety flags. No manual logging. No dependency on operator awareness. The shift record is complete regardless of workload.
↓
4
Work Order Auto-Generated in CMMS
iFactory automatically creates a fully populated work order in SAP PM, Maximo, Oracle EAM, or Fiix — including asset ID, fault type, AI diagnosis, RUL, recommended action, optimal repair window, and parts required. Zero manual intervention. The maintenance planner receives a prioritised, pre-diagnosed work request with all context attached, not a vague "check the motor" alert from a dashboard nobody reads.
↓
5
Handover Carries the Alert Forward — Every Shift
The open predictive maintenance alert carries forward automatically to every subsequent shift handover until the work order is closed. The incoming shift supervisor sees the alert in their AI-generated shift summary. They acknowledge it digitally. No predictive alert can be forgotten between shifts — the logbook enforces continuity until resolution is confirmed.
↓
6
Resolution Logged · Model Learns · Loop Closes
When the work order is completed, the resolution is logged in the shift record with technician attribution, time to repair, and parts used. This data feeds back to the AI model — improving prediction accuracy over time. Failure modes caught at one plant inform prediction models across all facilities in the network. The more failures iFactory prevents, the more accurate its predictions become.
Want to see the complete IoT-to-work order loop running in real time? Book a demo — we'll walk through an anomaly detection event from sensor signal to closed work order and show you exactly where your current process has gaps between detection and action.
IoT Sensor Coverage iFactory Monitors for Predictive Maintenance
Predictive maintenance is only as good as the sensor parameters it monitors. iFactory captures the complete set of physical signals that precede the most common industrial equipment failures — and connects each sensor type directly to the shift logbook event stream.
?
Vibration
Mounted on bearing housings and motor frames. Detects frequency shifts at specific RPM harmonics that indicate bearing wear, imbalance, misalignment, and looseness. The earliest physical signal for most rotating equipment failures — iFactory detects these patterns 30–90 days before mechanical failure.
Motors · Bearings · Pumps · Gearboxes · Compressors
?️
Temperature
Winding temperature, bearing temperature, and process temperature monitored continuously. Gradual temperature drift — 0.5°C per day over 9 days — is invisible to human operators but detected immediately by iFactory's AI baseline model. Thermal anomalies predict insulation failure, lubrication breakdown, and overload conditions.
Motor windings · Bearings · Heat exchangers · Process lines
?
Current & Voltage
Motor current signature analysis detects rotor bar defects, eccentricity, and mechanical load changes that produce characteristic current waveform distortions. Voltage monitoring identifies supply quality issues that accelerate winding degradation. Non-invasive — existing motor circuit wiring is used.
AC/DC motors · Drives · Electrical panels
?
Pressure
Hydraulic and pneumatic system pressure monitoring detects seal wear, valve degradation, and pump efficiency loss before they cause process interruptions. Differential pressure across filters and heat exchangers triggers cleaning or replacement work orders before blockages force emergency shutdowns.
Hydraulic systems · Pneumatics · Compressors · Filters
?
Acoustic / Ultrasonic
Ultrasonic sensors detect compressed air leaks, steam trap failures, and early-stage bearing defects through high-frequency sound signatures that precede detectable vibration changes. Particularly effective for detecting leaks in pressurised systems that are invisible, silent, and extremely costly at volume.
Steam traps · Compressed air · Valves · Bearings
⚙️
Process Parameters (SCADA/DCS)
Existing SCADA and DCS process parameters — flow rates, pH, level, concentration, cycle times — feed iFactory immediately via OPC-UA, without new hardware. AI establishes baselines for every parameter and flags deviations as shift logbook events. Process parameter anomalies are often the earliest signal for equipment degradation in chemical and continuous process environments.
All SCADA/DCS-connected process assets
How IoT Data Integrates with the Digital Shift Logbook in Practice
The technical architecture of iFactory's IoT-to-logbook integration is designed for industrial environments — working with existing sensor infrastructure, existing SCADA and DCS systems, and existing CMMS platforms without requiring a rip-and-replace. Here is exactly how the data flows from physical sensor to shift record to maintenance action.
LAYER 1
Sensor & Edge Layer
IoT sensors connect via WirelessHART, ISA100, Bluetooth LE mesh, or wired configurations. Edge gateways translate legacy protocols (Modbus, Data Highway Plus) to modern standards (MQTT, OPC-UA, HTTP). Sub-second data capture with local edge processing reduces cloud latency for time-critical anomaly detection. Most plants have existing sensors that feed iFactory immediately.
OPC-UA · MQTT · Modbus · BLE · WirelessHART
LAYER 2
AI Analytics & Prediction Engine
ML models trained on 60–90 days of historical operating data learn asset-specific baselines. Baseline model training takes 5–7 days. Real-time anomaly classification with confidence scoring. RUL calculated per monitored component. Failure probability updated continuously. Fleet-wide learning — anomaly patterns detected at one facility improve models across all deployed plants globally.
ML · Edge AI · Digital Twin · 95% accuracy
LAYER 3
Digital Shift Logbook Integration
Anomaly events are written automatically to the shift logbook timeline — classified, attributed to the asset and sensor, and prioritised alongside operator observations and quality events. Open predictive alerts carry forward to every handover until resolved. Incoming shift operators see all open machine health alerts in their AI-generated summary before starting work. Nothing falls between shifts.
Auto-logged · Shift carry-forward · AI summary · e-acknowledged
LAYER 4
CMMS Closed-Loop
Prioritised work orders auto-generated in SAP PM, IBM Maximo, Oracle EAM, or Fiix with full diagnostic context. Spare parts availability checked automatically. Technician assigned based on skill and availability. Completion data fed back to the AI model for continuous improvement. The loop is fully closed — from sensor signal to prevention to learning — without manual steps at any stage.
SAP PM · Maximo · Oracle EAM · Fiix · REST API
SEE THE COMPLETE LOOP LIVE
Watch an IoT Anomaly Become a Logged Shift Event and a Closed Work Order — in Under 60 Seconds
A 15-minute walkthrough using your equipment types as the scenario. See the sensor feed, the AI prediction, the auto-logged shift entry, and the CMMS work order — and find out which of your existing sensors can feed iFactory today.
Before and After: Predictive Maintenance With and Without IoT-Logbook Integration
The gap between a plant with IoT sensors and a disconnected alert dashboard versus a plant with IoT sensors connected to a digital shift logbook and CMMS is the gap between monitoring and preventing. These are the measurable outcomes across the dimensions that matter most.
Already have IoT sensors but no closed loop to your shift logbook or CMMS? Book a demo and we'll show you exactly how iFactory connects your existing sensor infrastructure — most plants have existing SCADA data that feeds iFactory immediately without new hardware.
What iFactory's Predictive Maintenance Integration Delivers
The business case for connecting IoT to the digital shift logbook is not theoretical. These are the measurable outcomes iFactory customers report across motor-intensive, rotating equipment, and process manufacturing environments.
35%
Downtime Reduction
Tier-1 automotive supplier with 150+ PLC-controlled robots. Predictive alerts prevented servo failures and conveyor bearing failures 2–4 weeks in advance. Unplanned downtime dropped from 18–24% to 8–12% within 12 weeks.
$2.1M
Annual Production Value Recovered
Production value recovered through eliminated unplanned stoppages at the same automotive facility. Seven bearing defects identified and corrected before failure in the first four months — two would have been catastrophic press failures.
47%
Fewer Emergency Maintenance Events
Sensor-triggered predictive work orders replace reactive emergency responses. Maintenance teams move from fire-fighting to scheduled intervention — matching repair windows to planned downtime rather than discovering failures mid-production.
85%
OEE Reached in 8 Weeks
Four filling lines averaging 58% OEE. Real-time dashboards identified Line 3 running 15% below target from recurring seal failures. Predictive alerts enabled pre-failure replacement. OEE reached 85% — world-class standard — within 8 weeks of iFactory deployment.
5–7 days
AI Baseline Training Time
iFactory's AI models begin learning asset-specific baselines from day one of sensor connection. Reliable failure predictions are available within 5–7 days of deployment on historical operating data. Early anomaly detection begins from the first shift.
4–6 mo
ROI Payback Period
Full investment payback across documented iFactory deployments averages 4–6 months. Plants with high unplanned downtime costs — where a single prevented failure saves $100K+ — often recover investment within the first billing cycle of preventing their first major breakdown.
Frequently Asked Questions
Do we need to install new IoT sensors, or can iFactory use our existing SCADA and sensor data?
Most plants already have SCADA sensors that feed iFactory immediately via OPC-UA, MQTT, or REST API connections — no new hardware required for the initial deployment. iFactory adds wireless IoT sensors only where coverage gaps exist for critical assets not currently monitored. Battery-powered wireless sensors install in minutes without wiring or machine modification. During the demo, we map your existing sensor infrastructure against your critical assets and show you exactly what new hardware, if any, is needed.
How does the IoT anomaly automatically appear in the shift logbook?
When iFactory's AI model detects an anomaly — a bearing vibration pattern, a temperature drift, a pressure deviation — it writes a structured entry to the shift logbook automatically, in under three seconds. The entry includes the asset ID, sensor reading, anomaly type, AI confidence score, Remaining Useful Life estimate, and recommended action. No operator action is required. The event is in the shift record the moment it is detected, visible to all shift personnel and to remote supervisors in the multi-site dashboard.
Which CMMS systems does iFactory connect to for auto-generated work orders?
iFactory connects bi-directionally with IBM Maximo, SAP PM, Oracle EAM, and Fiix via REST APIs, as well as with most other CMMS platforms through standard integration protocols. When the AI detects a degradation pattern requiring intervention, a fully populated work order is automatically created in your CMMS — with asset ID, fault diagnosis, RUL, recommended action, optimal repair window, and parts list pre-filled. Zero manual intervention in the work order creation process.
How accurate are the failure predictions, and how far in advance?
iFactory's ML models predict equipment failures 30–90 days in advance with 95% accuracy on well-monitored assets. Accuracy improves over time as the model accumulates more operating history and resolution data. Fleet-wide learning means that failure modes identified at one facility improve prediction models across all plants in the network. Baseline model training on your equipment's operating data takes 5–7 days from initial sensor connection — early anomaly detection begins from the first shift of deployment.
How does the predictive maintenance alert survive multiple shift handovers until the work order is resolved?
Open predictive maintenance alerts carry forward automatically in the iFactory shift logbook until the linked work order is marked complete in the CMMS. Every incoming shift supervisor sees all open machine health alerts in their AI-generated handover summary and must acknowledge them digitally before their shift is formally accepted. The alert cannot be forgotten, overwritten, or lost between shifts — the logbook enforces continuity across every shift change until resolution is confirmed and logged with full attribution.
IoT · SHIFT LOGBOOK · CMMS · CLOSED LOOP
Connect Your IoT Sensors to a Shift Logbook That Actually Prevents Failures.
iFactory closes the complete loop from sensor signal to shift record to work order to resolution — without a single manual step. Predictive alerts never fall between shifts. Failures are prevented before they happen. Most facilities go live in 3–4 weeks.
95%
AI prediction accuracy
30–90d
Advance failure prediction
0 sec
Manual steps: alert to WO
35%
Downtime reduction achieved