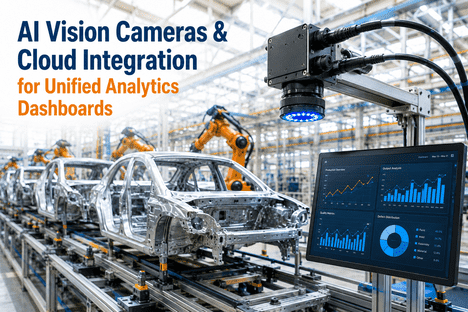
The most significant gap in most manufacturing analytics programs is not a shortage of data — it is the absence of a unified system that connects what AI Vision Cameras see on the plant floor to the cloud infrastructure where that visual intelligence can be aggregated, analyzed, and acted upon across every site in the operation. Cameras that inspect in isolation produce inspection results; cameras that stream structured data through an edge-to-cloud pipeline and feed a unified analytics dashboard produce operational intelligence. That distinction determines whether your vision investment generates a quality report at the end of each shift or drives continuous improvement decisions in real time. iFactory's AI Vision Camera platform is architected from the ground up to bridge this gap — combining edge inference, protocol-native cloud integration via OPC-UA and MQTT, and a unified dashboard layer that gives operations leaders a single, continuously updated view of quality, throughput, and compliance across every production line and every facility. Manufacturers that Book a Demo with iFactory consistently discover that their existing camera infrastructure, when integrated with the right cloud analytics layer, contains far more actionable intelligence than their current fragmented monitoring tools are surfacing.
AI VISION · CLOUD INTEGRATION · UNIFIED ANALYTICS
Connect Your AI Vision Cameras to a Single Cloud Analytics Dashboard
iFactory unifies AI Vision Camera data streams from every production line and facility into one cloud-connected analytics platform — delivering real-time quality intelligence, OEE visibility, and compliance records without manual data assembly.
Why Isolated Vision Data Is the Hidden Cost in Modern Manufacturing
Most manufacturing operations that have deployed AI Vision Cameras are running them in exactly the configuration that limits their value most: as standalone inspection stations that flag defects locally, generate shift reports manually, and share no structured data with the plant's MES, ERP, or cloud analytics environment. The result is a vision system that performs its detection task effectively but contributes nothing to the cross-line, cross-facility, and trend-over-time analytics that operations leadership requires to make capital allocation, process improvement, and staffing decisions. When a defect rate spikes on a Tuesday morning across three facilities in parallel, the operations team running isolated cameras learns this from three separate shift reports compiled the following day — not from a cloud dashboard that surfaced the pattern in real time and correlated it with a common raw material lot.
Unified cloud integration changes the fundamental value proposition of AI Vision Camera investment. Instead of inspection data living in local edge logs, every detection event — defect classification, severity score, product ID, line ID, timestamp, and camera ID — is transmitted through a structured data pipeline to a central cloud analytics layer the moment it occurs. That data feeds dashboards that operations managers, quality directors, and plant engineers can access from anywhere, on any device, and at any level of organizational granularity — from a single machine up to a twelve-facility enterprise network. Manufacturers exploring this architecture who Book a Demo with iFactory see the full data flow — from camera capture to cloud dashboard — in a single live session.
90%+
reduction in cloud bandwidth cost through edge pre-processing before cloud transmission
<1 sec
edge inference latency for real-time defect detection without cloud round-trip dependency
15–20%
average scrap reduction when vision data is correlated with process parameters via cloud analytics
100%
production visibility across all connected sites from a single unified analytics dashboard
Integration Architecture
The Four Root Causes of Disconnected Vision Analytics — and How Cloud Integration Solves Each
Understanding why vision data remains siloed in most manufacturing operations is the prerequisite to designing an integration architecture that closes each gap systematically. Operations technology teams that have attempted to connect vision systems to cloud analytics consistently encounter four structural barriers. iFactory's integration platform is specifically engineered to eliminate each one without requiring infrastructure replacement or custom middleware development.
01
Protocol Fragmentation Between Vision Hardware and Cloud Systems
AI Vision Cameras from different manufacturers publish data in incompatible formats — proprietary APIs, RTSP streams, vendor-specific SDKs — that cannot be consumed directly by cloud analytics platforms. iFactory's edge gateway layer normalizes vision data outputs into OPC-UA structured data objects and MQTT JSON payloads that are natively consumable by all major cloud analytics environments including AWS IoT, Azure IoT Hub, and Google Cloud Manufacturing Data Engine. Protocol translation is handled at the edge, so no cloud-side middleware development is required to unify multi-vendor camera deployments.
02
Raw Image Volume Overwhelming Cloud Bandwidth and Storage Budgets
Transmitting full-resolution camera frames to the cloud for remote processing generates bandwidth and storage costs that scale prohibitively with line speed and camera count. iFactory's edge computing architecture performs all defect classification and measurement inference locally — at the camera or edge device — and transmits only structured inspection result records to the cloud rather than raw image data. Edge pre-processing reduces cloud data volume by over 90% while preserving the full analytical fidelity required by cloud dashboards and trend models. Raw images are retained locally for a configurable window and are transmitted to cloud storage only when a defect event warrants archival.
03
Missing Context Links Between Vision Events and Production Records
A defect detection event that carries only a timestamp and image crop has limited analytical value in the cloud. Understanding whether that defect correlates with a specific material lot, a particular machine state, a shift changeover, or an environmental condition requires that the vision event be enriched with production context at the point of transmission. iFactory's integration layer automatically tags every inspection result with the corresponding production order ID, material lot number, machine operating parameters from the PLC data stream, and operator shift record — creating a context-complete data record that cloud analytics models can query without manual cross-referencing.
04
No Unified Dashboard Layer Across Multi-Site Deployments
Organizations operating AI Vision Cameras across multiple facilities typically end up with a separate analytics interface per site — requiring operations managers to log into multiple systems and manually aggregate data to form an enterprise picture. iFactory's cloud analytics layer ingests vision data streams from every connected site into a single data model and presents it through a unified dashboard that supports role-based filtering from enterprise-wide KPIs down to individual camera views. A quality director can move from a global first-pass yield trend to a specific defect classification breakdown on a single line in three clicks — without switching systems or requesting a data export.
Platform Capabilities
Five Core Capabilities of iFactory's Vision-to-Cloud Analytics Integration
A genuine vision-to-cloud analytics integration does not simply move data from a camera to a server — it builds an intelligent pipeline that enriches, correlates, and presents visual inspection intelligence in a form that drives decisions at every level of the manufacturing organization. Quality engineers evaluating vision integration platforms should assess each candidate system against these five capability dimensions to determine whether the integration delivers real-time operational intelligence or simply digitizes the local inspection log. If you want to see how iFactory performs across each dimension in a live manufacturing environment, Book a Demo with our integration team for a hands-on technical walkthrough.
01
Edge-to-Cloud Data Pipeline with OPC-UA and MQTT Native Support
iFactory's integration architecture follows the consensus industrial IoT stack: OPC-UA organizes and contextualizes inspection data at the edge with full semantic tagging — asset ID, production order, inspection type, and result classification — while MQTT with Sparkplug B transports that structured payload to the cloud broker at scale. This architecture is supported natively by AWS IoT Core, Azure IoT Hub, and Google Cloud IoT — meaning iFactory's vision data stream integrates with your existing cloud infrastructure without custom connector development. The pipeline operates at sub-second latency for real-time dashboard updates while managing bandwidth through configurable edge aggregation intervals.
02
Real-Time Unified Analytics Dashboard Across All Connected Sites
iFactory's cloud dashboard consolidates inspection KPIs from every connected camera and production line into a single, role-configured interface. Live metrics include first-pass yield by line, defect rate by classification type, OEE impact from vision-detected stoppages, and compliance pass rate against specification thresholds. Dashboard views are configurable at enterprise, facility, line, and individual camera levels — each with drill-down capability to the individual inspection event and the associated defect image evidence. Operations managers receive a continuously updated operational picture without waiting for shift reports, enabling same-shift response to quality deviations rather than next-day corrective action.
03
Cross-Facility Defect Trend Analytics and Root Cause Correlation
The highest-value analytical capability that cloud integration unlocks is cross-facility defect correlation — the ability to identify when a quality pattern is appearing consistently across multiple plants and to trace it to a shared root cause such as a common supplier lot, a distributed equipment model, or a process parameter drift that affects multiple lines simultaneously. iFactory's cloud analytics engine continuously compares defect rate trends across all connected facilities, surfaces statistically significant cross-site patterns, and correlates them with shared production variables in the enriched data record. This enterprise-level quality intelligence is structurally impossible with isolated, site-local vision systems.
04
Automated Compliance Record Generation and Audit-Ready Documentation
Every inspection event processed through iFactory's cloud integration pipeline is automatically logged as a structured compliance record containing inspection timestamp, product ID, lot number, camera ID, defect classification, severity score, and disposition decision. These records are stored in a tamper-evident audit log that satisfies ISO 9001 quality record requirements and customer-specific SPC documentation mandates without any manual documentation effort. Audit-ready quality reports — first article inspection packages, process capability studies, defect Pareto analyses — are generated directly from the cloud data layer on demand, eliminating the labor-intensive manual compilation that currently precedes every customer audit or regulatory submission.
05
MES, ERP, and CMMS Integration for Closed-Loop Quality Response
iFactory's cloud analytics layer exposes a REST API and webhook interface that enables bidirectional integration with existing MES, ERP, and CMMS systems. When the vision analytics platform detects a defect rate crossing a configurable threshold, it can automatically trigger a quality hold in the MES, generate a non-conformance report in the ERP, or create a corrective maintenance work order in the CMMS — without requiring operator intervention. This closed-loop architecture transforms the vision platform from a detection tool into an active participant in the quality management system, accelerating the time from defect detection to corrective action from hours to seconds. Manufacturers ready to activate closed-loop quality response are encouraged to
Book a Demo to see the integration workflow in a live environment.
Performance Benchmark
Isolated Vision Systems vs. iFactory Cloud-Integrated Analytics: 2026 Comparison
The performance gap between standalone vision inspection and cloud-integrated vision analytics has widened significantly as cloud data infrastructure has matured and manufacturing organizations have accumulated multiple years of isolated camera deployments that do not communicate with enterprise systems. The benchmark below reflects operational outcomes from manufacturers that transitioned from isolated AI Vision Camera deployments to iFactory's unified cloud analytics architecture.
Vision Analytics Integration Performance Benchmark — 2026
Implementation Roadmap
Building a Vision-to-Cloud Analytics Integration: A Phased Implementation Guide
Successfully integrating AI Vision Camera data with cloud analytics infrastructure requires a sequenced approach that delivers measurable value at each phase without requiring a complete infrastructure replacement before the first dashboard goes live. The following roadmap reflects implementation patterns validated across manufacturing operations ranging from single-facility quality teams to multi-site enterprise deployments spanning twelve or more production locations.
Phase 1
Vision Data Audit and Integration Architecture Design (Weeks 1–4)
Conduct a full audit of existing AI Vision Camera deployments — camera models, current output formats, network topology, and data retention practices. Map every camera to its associated production line, MES asset record, and quality specification. Identify protocol translation requirements between current camera outputs and the target cloud analytics environment. Design the edge gateway configuration, MQTT topic structure, and cloud data schema that will standardize vision data across all camera types and sites. Manufacturers who want iFactory's engineers to facilitate this audit and architecture design can
Book a Demo to initiate a scoping engagement.
Outcome: Integration architecture blueprint, data schema design, edge gateway specification
Phase 2
Edge Gateway Deployment and Cloud Pipeline Activation (Weeks 5–10)
Deploy iFactory edge gateways at pilot facilities and connect to existing camera networks without production interruption. Configure OPC-UA semantic tagging and MQTT payload schemas for each camera type in the pilot scope. Activate the cloud data pipeline and validate structured inspection result records arriving at the cloud analytics layer with full production context enrichment. Commission the unified dashboard for the pilot facility, configure role-based access for operations managers and quality engineers, and establish baseline KPI benchmarks. Validate that cloud data latency, bandwidth consumption, and edge inference performance meet operational requirements before extending to additional sites.
Outcome: Live cloud pipeline, pilot facility dashboard active, baseline KPIs established
Phase 3
MES/ERP Integration and Closed-Loop Quality Response (Weeks 11–18)
Connect iFactory's cloud analytics layer to the facility's MES and ERP systems using the REST API and webhook integration interfaces. Configure quality hold triggers, non-conformance record generation, and CMMS work order creation rules based on vision-detected defect thresholds. Activate cross-facility defect correlation analytics using data from all connected sites. Deploy automated compliance record generation and configure audit-ready report templates for the quality team. Conduct a mock audit using the automated documentation output to validate that records satisfy customer and certification body requirements before the next scheduled audit cycle.
Outcome: Closed-loop quality response active, cross-facility analytics live, compliance records automated
Phase 4
Enterprise Rollout and Continuous Intelligence Optimization (Week 19+)
Extend the validated integration architecture from pilot facilities to all remaining sites using the standardized configuration template. Activate enterprise-level analytics including supplier quality correlation, cross-facility OEE benchmarking, and predictive quality models trained on the accumulated cloud inspection data. Establish quarterly analytics review cycles using the unified dashboard to drive structured quality improvement initiatives across the enterprise network. Configure adaptive defect threshold management that automatically tightens specification gates as process capability improves over successive production campaigns.
Outcome: Full enterprise cloud integration, predictive quality models active, continuous improvement program operational
Frequently Asked Questions
AI Vision Camera Cloud Integration — Frequently Asked Questions
Does iFactory's cloud integration work with cameras already deployed on our production lines?
Yes. iFactory's edge gateway layer is camera-agnostic and compatible with any ONVIF-compliant IP camera and most industrial machine vision systems. The integration layer handles protocol translation and data normalization without requiring hardware replacement, protecting existing capital investments while adding cloud connectivity.
How does iFactory manage cloud bandwidth costs for high-speed inspection lines with multiple cameras?
All defect classification inference runs at the edge, so only structured inspection result records — not raw image frames — are transmitted to the cloud under normal operating conditions. This reduces cloud data volume by over 90% compared to raw image streaming architectures. Raw defect images are transmitted selectively, only when an event threshold triggers cloud archival.
Which cloud platforms does iFactory's integration support?
iFactory's MQTT and OPC-UA data pipeline is natively compatible with AWS IoT Core, Azure IoT Hub, and Google Cloud IoT. The platform also supports on-premises cloud environments and hybrid architectures where data sovereignty requirements prevent public cloud transmission of inspection records.
What happens to the dashboard and quality records if the cloud connection is interrupted?
Edge computing architecture ensures that defect detection and local inspection logging continue without interruption during cloud connectivity loss. Inspection results are buffered at the edge and transmitted to the cloud when connectivity is restored, with no data loss. Local edge dashboards remain operational throughout, providing site-level visibility independently of cloud connectivity status.
How long does implementation typically take from first connection to live dashboard?
A standard single-facility implementation — from edge gateway deployment through cloud pipeline activation to live dashboard commissioning — takes 5 to 10 weeks depending on the number of camera types and the complexity of MES integration requirements. Multi-facility rollouts use a standardized configuration template that reduces per-site deployment time for sites beyond the pilot.
What ROI can manufacturers expect from cloud-integrated vision analytics?
Most manufacturers achieve full ROI within 10 to 16 months, driven by three primary value streams: a 15 to 22% improvement in first-pass yield from faster defect response, a 92% reduction in audit documentation labor, and avoided quality holds and recall exposure from cross-facility defect correlation. iFactory provides facility-specific ROI modeling based on current defect rates and audit costs during the initial scoping engagement.
CLOUD INTEGRATION · UNIFIED DASHBOARD · REAL-TIME VISION ANALYTICS · 2026
Turn Your AI Vision Cameras Into an Enterprise Analytics Asset
iFactory's cloud-integrated AI Vision platform connects every camera, every line, and every facility into one unified analytics dashboard — delivering the real-time quality intelligence, compliance documentation, and cross-facility insight that operations leaders need to drive continuous improvement at enterprise scale.