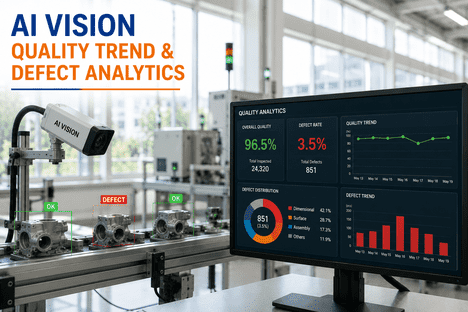
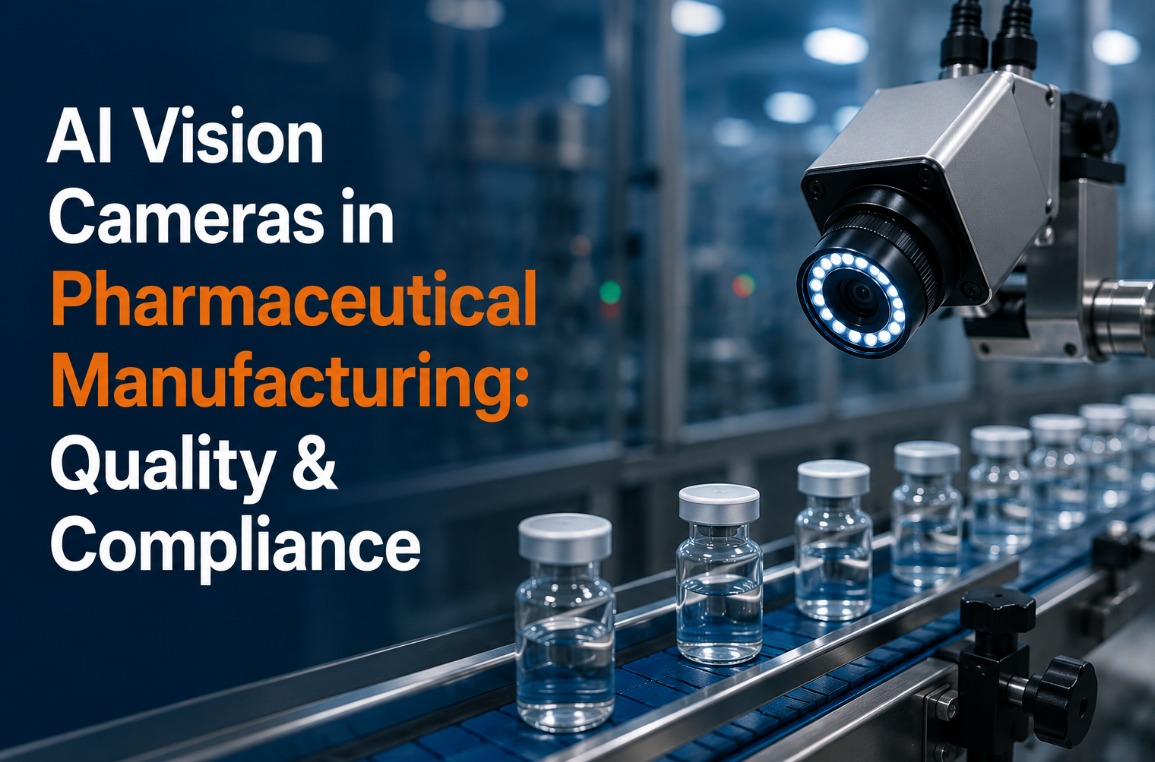
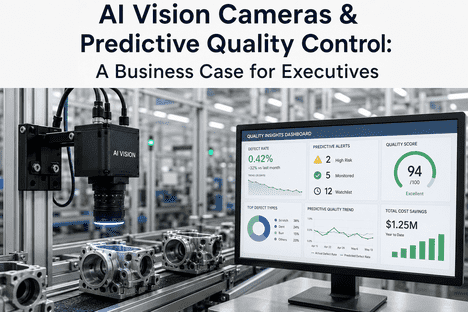
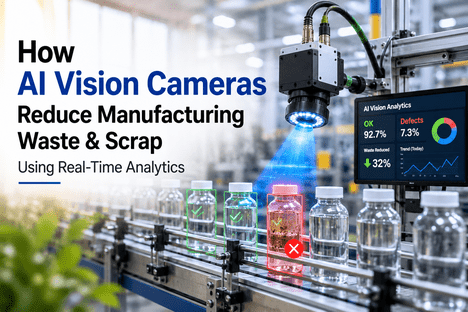
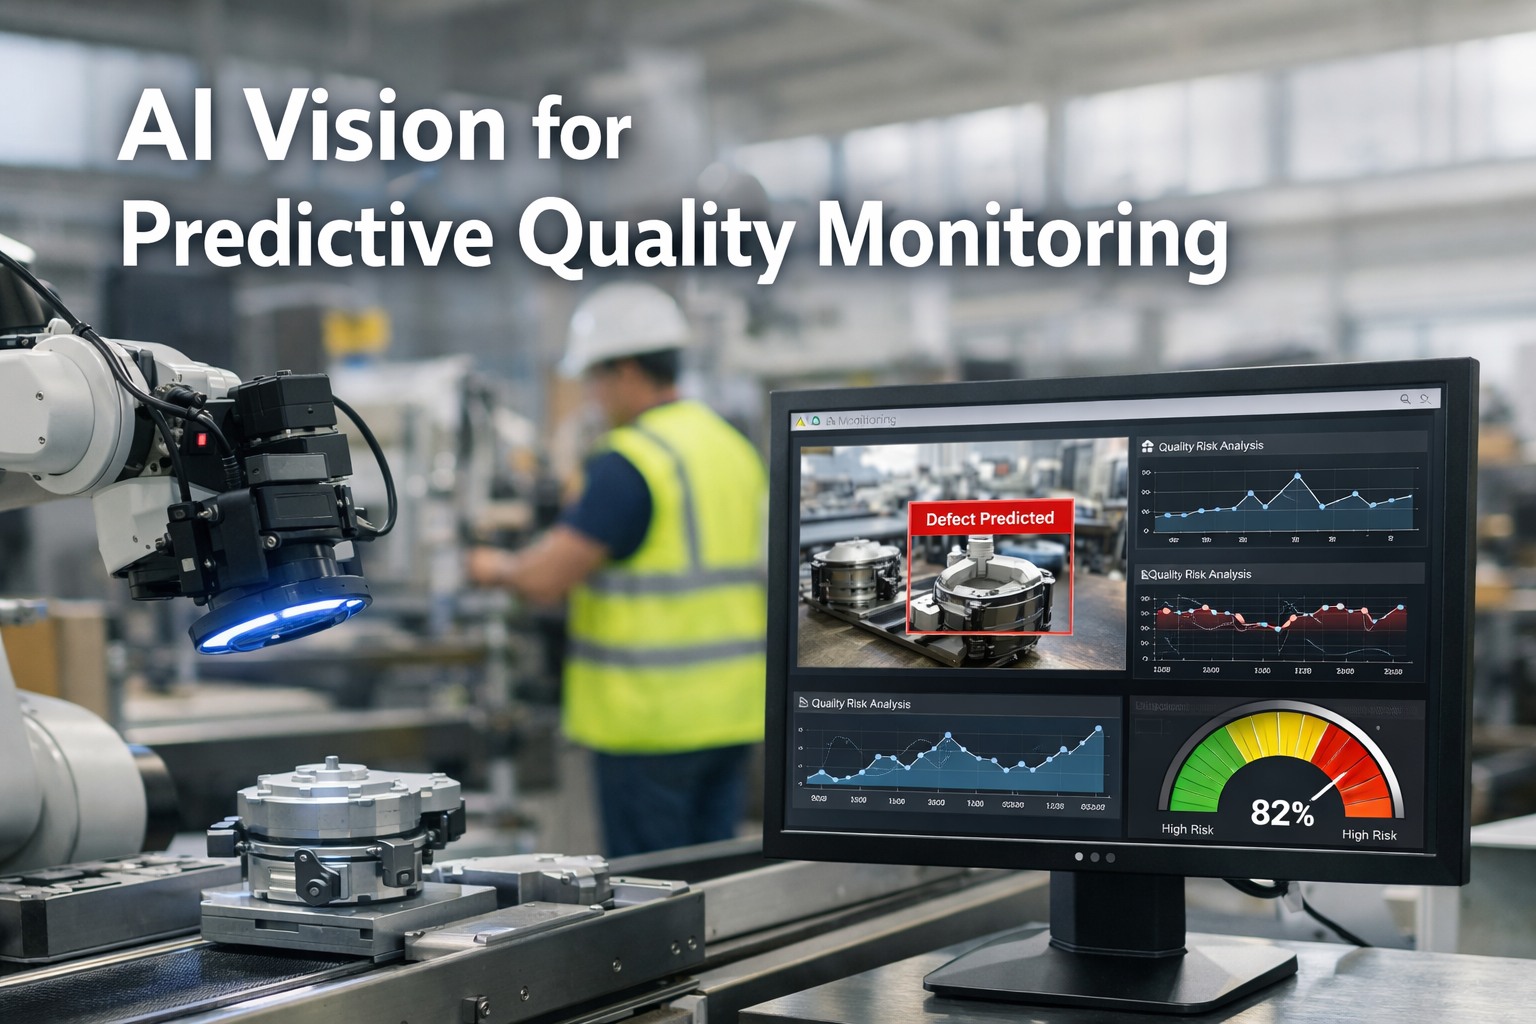
AI Vision Cameras for Predictive Quality Analytics represent the transition from a factory that finds defects after they have already been produced to one that forecasts quality failures before a single defective unit exists on the line. Traditional reactive inspection — even AI-powered detection at 99% accuracy — still operates downstream of the problem: the defect has already formed, the material and labor are already consumed, and the risk of escape is already real. Predictive quality analytics changes the equation entirely by correlating continuous visual data from iFactory's AI Vision Camera platform with process parameters, environmental conditions, and historical defect patterns to generate quality forecasts 1 to 2 hours before a failure emerges. Manufacturers deploying this architecture are cutting rework by up to 50%, reducing scrap by 30–50%, and reaching quality performance thresholds that reactive inspection structurally cannot achieve. Book a Demo to see iFactory's predictive quality analytics running on a live production line.
From Detecting Defects to Preventing Them — Before They Occur
iFactory's AI Vision Camera platform analyzes continuous visual production data in real time, correlates process parameters and defect patterns, and forecasts quality failures before they materialize — with 99.4% detection accuracy and sub-50ms inference on-premise.
Why Reactive Quality Inspection Is No Longer Enough
The Rule of 10 is one of the most consequential cost principles in manufacturing quality management: every stage a defect passes undetected, the cost to resolve it multiplies by a factor of ten. A defect caught at source costs one dollar to fix. The same defect caught at final test costs one hundred. Caught by the customer, it costs one thousand — and triggers the relationship damage, warranty exposure, and brand erosion that financial models consistently underestimate. A product recall compounds this to five figures per event or beyond.
Reactive AI vision inspection — however accurate — operates at the "caught at final test" stage of this cost curve. It prevents escapes to the customer, but it does not prevent the waste of producing defective units in the first place. Every batch of rework, every scrap bin filled during a night shift, every quality hold waiting for root cause analysis represents cost that detection cannot recover. Predictive quality analytics, anchored in continuous visual data from iFactory's AI Vision Camera module, intervenes before the defect is produced — shifting the cost curve from the $100 stage to the $1 stage or eliminating it entirely.
How iFactory AI Vision Cameras Generate Predictive Quality Insights
Predictive quality analytics is not a feature bolted onto a detection system — it is an architecture built from four integrated layers that transform raw visual data into actionable forecasts. iFactory's AI Vision Camera module is designed from the ground up to serve this architecture, with on-premise NVIDIA edge GPU processing, YOLOv8 and Vision Transformer models, and zero cloud dependency ensuring that every inference and every prediction runs inside the facility's firewall at sub-50ms latency.
Continuous Visual Data Collection at Line Speed
High-resolution RGB, thermal, and multi-spectral camera streams capture every unit at full production throughput — 200+ units per minute — generating a continuous visual record of the production process. iFactory integrates with any ONVIF-compliant or RTSP-streaming camera in the existing infrastructure, meaning historical visual data begins accumulating from day one without hardware replacement. This data layer is the foundation on which all predictive analytics are built: the richer and more continuous the visual history, the more precise the forecast model becomes over time.
Real-Time Defect Pattern Recognition and Classification
YOLOv8 object detection and Vision Transformer models analyze each frame at sub-50ms inference latency, classifying detected anomalies by defect type, severity, and location with bounding-box annotation and confidence scoring. Critically, iFactory's models do not merely flag individual defective units — they track defect class frequency, spatial distribution on the production surface, and rate-of-change across consecutive inspection windows. A defect rate that is rising at 0.3% per hour is a different signal than a stable 2% defect rate, and predictive analytics treats these as distinct quality states requiring different responses. Book a Demo to see defect pattern trending on a live production run.
Process Parameter Correlation and Upstream Root Cause Mapping
The defining capability of predictive quality analytics is the correlation between visual defect patterns and upstream process variables. iFactory ingests PLC, SCADA, and OPC-UA sensor feeds alongside visual data — connecting temperature profiles, feed rates, spindle speeds, pressure readings, and tooling wear indicators to the defect patterns they produce downstream. When a specific visual signature begins trending, iFactory's correlation engine identifies which process parameter is the statistically most likely upstream cause, providing the operator with a targeted corrective action rather than a generic quality alert. This transforms quality alerts from reactive warnings into predictive instructions.
Automated Corrective Action, CAPA, and Compliance Documentation
When a predictive quality threshold is breached, iFactory automatically generates a work order with annotated visual evidence, assigns it to the responsible process engineer, and — if configured — triggers a PLC output signal to adjust the parameter directly. The corrective action record, timestamped visual frames, defect trend data, and operator response time are all captured in an immutable CAPA document satisfying FDA 21 CFR Part 11, BRC Grade A, and SQF Level 3 audit requirements. This closes the loop from visual forecast to documented corrective action with zero manual transcription.
Predictive Quality Analytics by Production Zone
Predictive quality analytics is not a single model applied uniformly across a production line — it is a zone-specific intelligence framework where different process variables drive different defect prediction models at each stage. iFactory's AI Vision Camera platform deploys these models independently per camera zone, with each zone feeding its own defect trend data into the unified quality dashboard.
In-Process Material and Surface Inspection
1–2 Hr Prediction WindowAt in-process inspection zones, iFactory tracks subtle changes in surface texture uniformity, dimensional variance across consecutive units, and color gradient shifts that precede visible defect formation. A surface that is trending toward roughness threshold before the defect is visually obvious provides a 1 to 2 hour intervention window — time to adjust tooling pressure, material feed rate, or temperature before the defect manifests. This is the primary value generation zone for predictive analytics: upstream of end-of-line inspection, where corrective action cost is lowest.
Assembly and Alignment Verification
Sub-5ms Per-Unit DecisionAssembly zones generate predictive insights by tracking the statistical distribution of component placement accuracy across consecutive units. Where a single unit outside tolerance is a detection event, a distribution of placements trending toward the tolerance boundary across 50 consecutive units is a predictive event — indicating tooling wear, fixture drift, or feed mechanism degradation that will produce systematic failures within the next production window. iFactory maps these trends in real time against the assembly zone's process parameters to identify the upstream cause before the distribution breaches the tolerance boundary.
Packaging, Label, and Seal Integrity Monitoring
100% Unit CoveragePackaging integrity failures — degrading heat seal strength, progressive label misalignment, fill volume drift — follow consistent patterns that predictive analytics identifies before individual units fail inspection. A heat sealer whose jaw temperature is drifting 0.5°C per hour will produce first visible seal failures in 3 to 4 hours — but the predictive model flags the thermal drift signature 2 hours before the first failed unit appears. iFactory's thermal camera integration provides the temperature trend data that makes this forecast possible, integrated with the same visual inspection stream that confirms seal appearance.
Predictive Quality KPIs: What iFactory Tracks and Why They Matter
Predictive quality analytics generates a distinct set of KPIs that reactive inspection dashboards never surface. The difference is directional intelligence — not just what the quality rate is right now, but where it is heading, at what rate, and which process variable is driving the change. These KPIs are the operational foundation of proactive quality management and are available natively in iFactory's unified production dashboard alongside OEE, maintenance, and compliance data. Plant engineers who Book a Demo consistently identify quality deterioration patterns in their historical data that were invisible in their existing systems.
The rate at which defect frequency is increasing per hour across each camera zone — the earliest leading indicator of upstream process drift before absolute defect rates breach thresholds.
iFactory's AI model confidence score for the probability of a quality failure event within the next 60 to 120 minutes — calibrated per production zone and updated with every camera frame.
Statistical correlation between a visual defect class trend and specific upstream process parameters — directing the operator to the exact parameter requiring adjustment rather than requiring manual root cause investigation.
The time between a predictive quality alert and the operator's process parameter correction — tracked per shift and per zone to measure the effectiveness of the predictive analytics response workflow.
How iFactory Integrates Predictive Quality Analytics with CMMS, MES, and SAP
The most common failure mode of predictive quality deployments is not model accuracy — it is data isolation. A vision platform that generates quality forecasts in a separate dashboard that the production team never opens, that does not connect to the work order system, and that does not feed the MES production record is analytically capable but operationally inert. iFactory is designed specifically to prevent this failure mode by serving as the production intelligence layer that bridges visual analytics with the systems where production decisions actually happen.
Automatic Work Order Generation on Predictive Quality Triggers
When iFactory's predictive model exceeds a configured quality forecast threshold, it automatically generates a CMMS work order with the annotated visual trend data, the identified process parameter correlation, and the recommended corrective action. The work order is assigned to the responsible process engineer via push notification and logged in the same work order management system as all other production and maintenance tasks — eliminating the separate "quality alert" workflow that most plants never action consistently.
MES Production Order Quality Record Linkage
Every predictive quality event and its associated corrective action is linked to the corresponding MES production order number in iFactory's platform. This traceability chain means that every quality deviation is associated with a specific batch, shift, equipment ID, and upstream process state at the time of the predictive trigger — providing per-batch quality provenance that satisfies full traceability requirements across food, pharmaceutical, and automotive regulatory frameworks.
OEE Quality Rate Impact Quantification
iFactory's OEE Analytics module uses the defect rate and first-pass yield data from the AI Vision Camera layer to populate the Quality Rate component of line-level OEE in real time. This means that a predictive quality event that results in rework is immediately visible as an OEE Quality Rate impact on the production dashboard — connecting quality analytics to the operational performance metric that plant managers and operations directors monitor daily. Where predictive analytics prevents a defect event, the avoided OEE impact is quantified and tracked as a realized benefit. Plant engineers building the financial case for predictive quality investment regularly Book a Demo to review the OEE impact modeling for their specific line configuration.
Ready to Move from Detecting Defects to Preventing Them?
iFactory's AI Vision Camera platform connects to your existing cameras and PLCs in 1 to 2 weeks — delivering predictive quality forecasts, automated CAPA documentation, and OEE quality impact tracking with no cloud dependency and no infrastructure replacement.
AI Vision Cameras for Predictive Quality Analytics — Frequently Asked Questions
How is predictive quality analytics different from standard AI vision defect detection?
Standard AI vision detection identifies defects after they have formed and flags individual non-conforming units. Predictive quality analytics tracks defect rate trends, spatial distribution patterns, and rate-of-change across consecutive inspection windows — then correlates these visual trends with upstream process parameters to forecast quality failures 1 to 2 hours before they produce a defective unit. Detection answers "Is this unit defective?" Predictive analytics answers "Is this process about to produce defective units, and which parameter is causing it?"
Does iFactory's AI Vision Camera module work with our existing ONVIF cameras?
Yes. iFactory integrates with any ONVIF-compliant or RTSP-streaming IP camera. In most facilities the existing camera infrastructure is fully reusable — iFactory adds AI inference and predictive analytics as a software layer on NVIDIA edge GPU hardware without requiring camera replacement. Thermal and multi-spectral camera streams can be added to the same platform for zones where heat or spectral data enhances predictive model accuracy. Book a Demo to confirm compatibility with your specific camera models and production environment.
How much training data does the predictive quality model require?
Initial detection models require 500 to 1,000 annotated images per defect class. The predictive correlation layer is built on top of the detection model using production-run data — typically 3 to 6 weeks of annotated production history is sufficient to establish statistically significant correlations between visual defect trends and upstream process parameters. iFactory's model management workflow allows the predictive layer to be activated incrementally as production data accumulates, delivering detection value from day one while the predictive layer matures.
Can iFactory's predictive quality alerts trigger automatic process parameter adjustments?
Yes, where PLC output integration is configured. iFactory can send a direct OPC-UA or MQTT signal to the relevant PLC control loop upon a predictive quality threshold breach — automatically adjusting temperature setpoints, feed rates, or conveyor speeds within the PLC's configured safe operating range. Where automatic adjustment is not configured or appropriate, the alert generates a push notification and CMMS work order directing the operator to the specific parameter requiring manual adjustment.
Does iFactory require cloud connectivity to run predictive quality analytics?
No. All AI inference and predictive model processing runs on-premise on NVIDIA edge GPU hardware inside the facility's firewall. There is zero cloud dependency, zero data leaving the factory network, and full predictive analytics operation during internet outages. iFactory's architecture is IEC 62443-aligned and air-gap ready for facilities with data sovereignty or cybersecurity requirements prohibiting cloud data transmission.
What is the typical deployment timeline and ROI horizon for predictive quality analytics with iFactory?
Detection capabilities go live in 1 to 2 weeks using existing camera infrastructure and iFactory's pre-built industry templates. The predictive correlation layer typically achieves production-ready accuracy within 4 to 8 weeks as the model builds its process-parameter history. Most facilities achieve full ROI within 10 to 16 months, driven by first-pass yield improvement of 15 to 22%, rework and scrap cost reduction, and the avoided cost of quality-related production holds and recall exposure.