Catching a defect on a part is only half of quality control — the harder and more valuable question is why that defect kept showing up, which shift or machine it traces back to, and whether it is part of a pattern that is quietly costing far more than any single rejected unit. AI vision quality trend and defect analytics answers this by taking the raw pass/fail and defect-type data captured during inline inspection and turning it into structured trends, Pareto rankings, and root-cause signals that quality and maintenance teams can act on. In 2026, as manufacturers push to inspect 100 percent of production rather than relying on statistical sampling, the volume of inspection data being generated has outgrown what a manual quality review can meaningfully interpret. iFactory's AI-driven EAM platform addresses this through its Vision Process Analytics feature, which aggregates inspection results from cameras already covering the line into dashboards that surface which defects matter most, where they originate, and what process or maintenance action will reduce them. Quality and reliability teams evaluating defect analytics programs are encouraged to Book a Demo with iFactory to start a pilot scoped to your own defect classes.
Turn Inspection Data Into Defect Trends and Root-Cause Insight
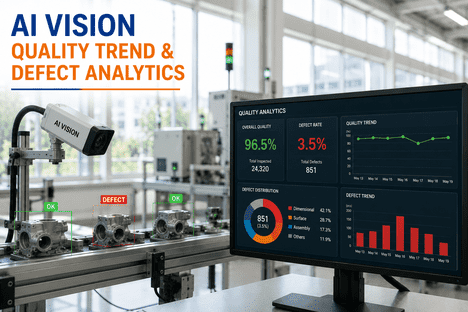
iFactory's Vision Process Analytics feature converts AI vision inspection results into defect trends, Pareto analysis, and root-cause signals that feed directly into process control and maintenance action.
Why Raw Inspection Data Alone Does Not Improve Quality
An AI vision system that classifies every part as pass or fail, or tags each defect by type, generates a constant stream of inspection events — but a stream of pass/fail flags by itself does not tell a quality engineer where to focus. The value only emerges once that data is aggregated into trends: which defect type accounts for the largest share of rejects, whether a defect rate is rising on a specific shift, line, or supplier lot, and whether a process parameter shift correlates with a quality dip. This is the same logic behind classic statistical process control and Pareto analysis, applied automatically and continuously instead of through periodic manual sampling. iFactory's Vision Process Analytics feature takes the defect classifications already produced by AI vision inspection and rolls them up into the dashboards, control charts, and ranked defect lists that quality teams use to decide what to fix first — and whether the fix belongs to a process adjustment or a maintenance work order.
Find What Matters Most
Defect types are automatically ranked by frequency and cost impact, surfacing the small number of defect categories responsible for the largest share of rejects and rework.
Continuous SPC Tracking
Defect and dimensional data feed live statistical process control charts, flagging when a metric drifts outside expected control limits rather than waiting for a periodic quality review.
Shift & Line Comparison
Defect rates are segmented by shift, line, machine, and supplier lot, exposing whether a quality issue is isolated to one source or spread evenly across the operation.
Root-Cause Linkage
Defect trends are correlated against upstream process and equipment signals, helping teams trace a quality drift back to a specific machine, tool, or maintenance condition.
How Vision Process Analytics Turns Inspection Data Into Action
Building a usable quality analytics layer requires more than storing inspection results — it requires a structured path from raw defect detection to a specific corrective action. The following framework outlines how iFactory's Vision Process Analytics feature processes inspection data from the moment a defect is detected through to the action it triggers. Book a Demo to see this pipeline mapped against your own defect classes and process data.
| Pipeline Stage | Description | Data Captured | Downstream Value |
|---|---|---|---|
| Inspection Event Capture | Every inspected unit is logged with its pass/fail result and defect classification | Defect type, timestamp, asset ID, shift, line, lot number | Creates a complete, unsampled inspection record for analysis |
| Defect Trend Aggregation | Individual inspection events are rolled up into rates over time | Defect rate by hour, shift, day, line, and product family | Reveals whether a defect rate is rising, falling, or stable |
| Pareto & Cost Ranking | Defect categories are ranked by frequency and estimated cost impact | Top defect types contributing the largest share of total rejects | Focuses improvement effort on the highest-impact defect first |
| SPC Control Charting | Key quality metrics are monitored against statistical control limits | Control limit breaches, out-of-trend runs, drift signals | Flags quality drift before it produces a wave of rejects |
| Root-Cause & Maintenance Feed | Defect trends are correlated with upstream process and asset data | Process parameter shifts, equipment condition signals | Routes the right corrective action to process control or maintenance |
How iFactory's AI Vision Camera Feeds the Quality Analytics Layer
Quality trend analytics is only as good as the inspection data feeding it, which is why the detection layer matters as much as the dashboards built on top of it. iFactory's AI Vision Camera inspects parts in real time using on-premise deep learning models, classifying each defect by type and severity and logging the result with annotated photographic evidence rather than a bare pass or fail flag. Every one of those classified events flows into the Vision Process Analytics layer, where it is aggregated into Pareto charts, SPC trends, and shift-level comparisons automatically — without quality engineers needing to manually compile spreadsheets from sampled inspection logs. When a defect trend crosses a threshold, the system can generate a work order with the correlated process or equipment data attached, so the team responding already knows whether the issue points to a process adjustment or a piece of equipment that needs maintenance attention. Many teams begin with a focused pilot on one defect class or line before expanding analytics coverage further. Book a Demo to scope a pilot for your own production environment.
AI Vision Quality Trend & Defect Analytics — Frequently Asked Questions
What is defect Pareto analysis in AI vision quality control?
Defect Pareto analysis ranks defect categories by how frequently they occur and how much they contribute to total rejects, helping quality teams focus improvement effort on the small number of defect types responsible for most of the loss.
How does AI vision support statistical process control?
AI vision inspection generates continuous, unsampled defect and dimensional data that feeds live SPC control charts, allowing quality drift to be flagged the moment a metric moves outside its expected control limits rather than during a periodic review.
Can defect trend data point to a root cause automatically?
Defect trends become more useful for root-cause analysis when correlated against upstream process parameters and equipment condition data, helping teams trace a quality drift back to a specific machine, tool, or maintenance issue rather than treating each defect as isolated.
Does Vision Process Analytics replace manual quality sampling?
Yes — because AI vision inspects every unit rather than a statistical sample, the resulting defect and trend data covers 100 percent of production, giving a more complete picture than periodic manual sampling can provide.
What does a quality analytics pilot with iFactory involve?
A pilot typically focuses on one defect class or production line, validating defect classification accuracy and trend reporting against your existing quality records before expanding Pareto, SPC, and root-cause analytics to additional lines.
Turn Every Inspection Into Defect Trend and Root-Cause Intelligence
iFactory's Vision Process Analytics feature converts AI vision inspection data into defect trends, Pareto analysis, and root-cause insight that feed process control and maintenance — starting with a focused pilot.