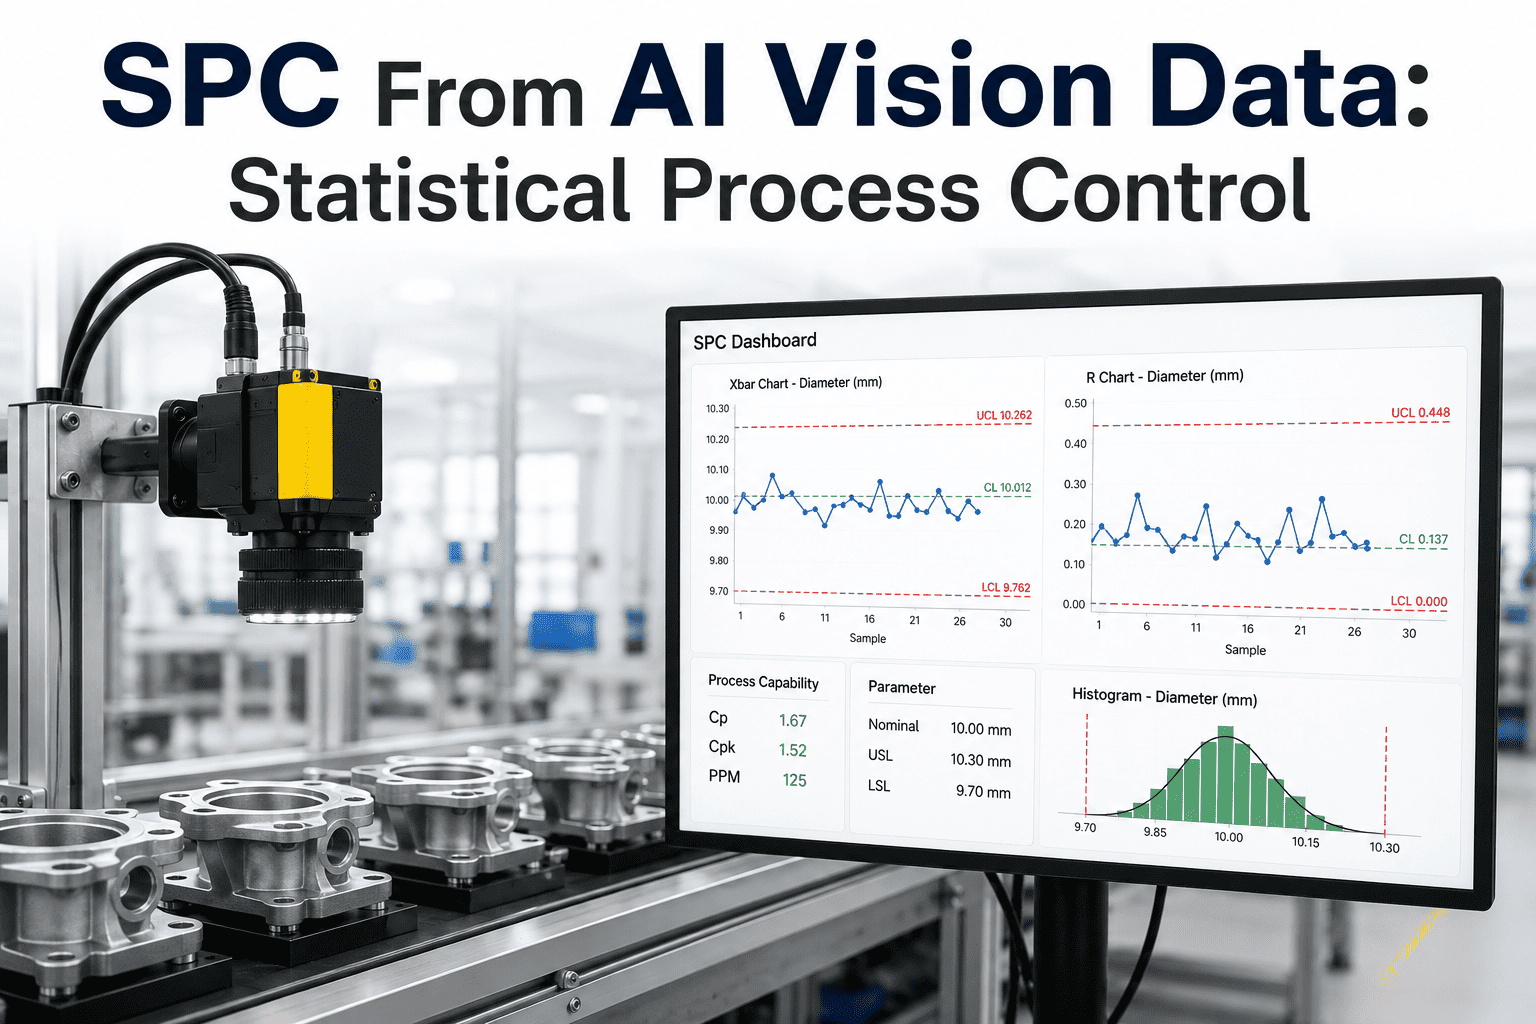
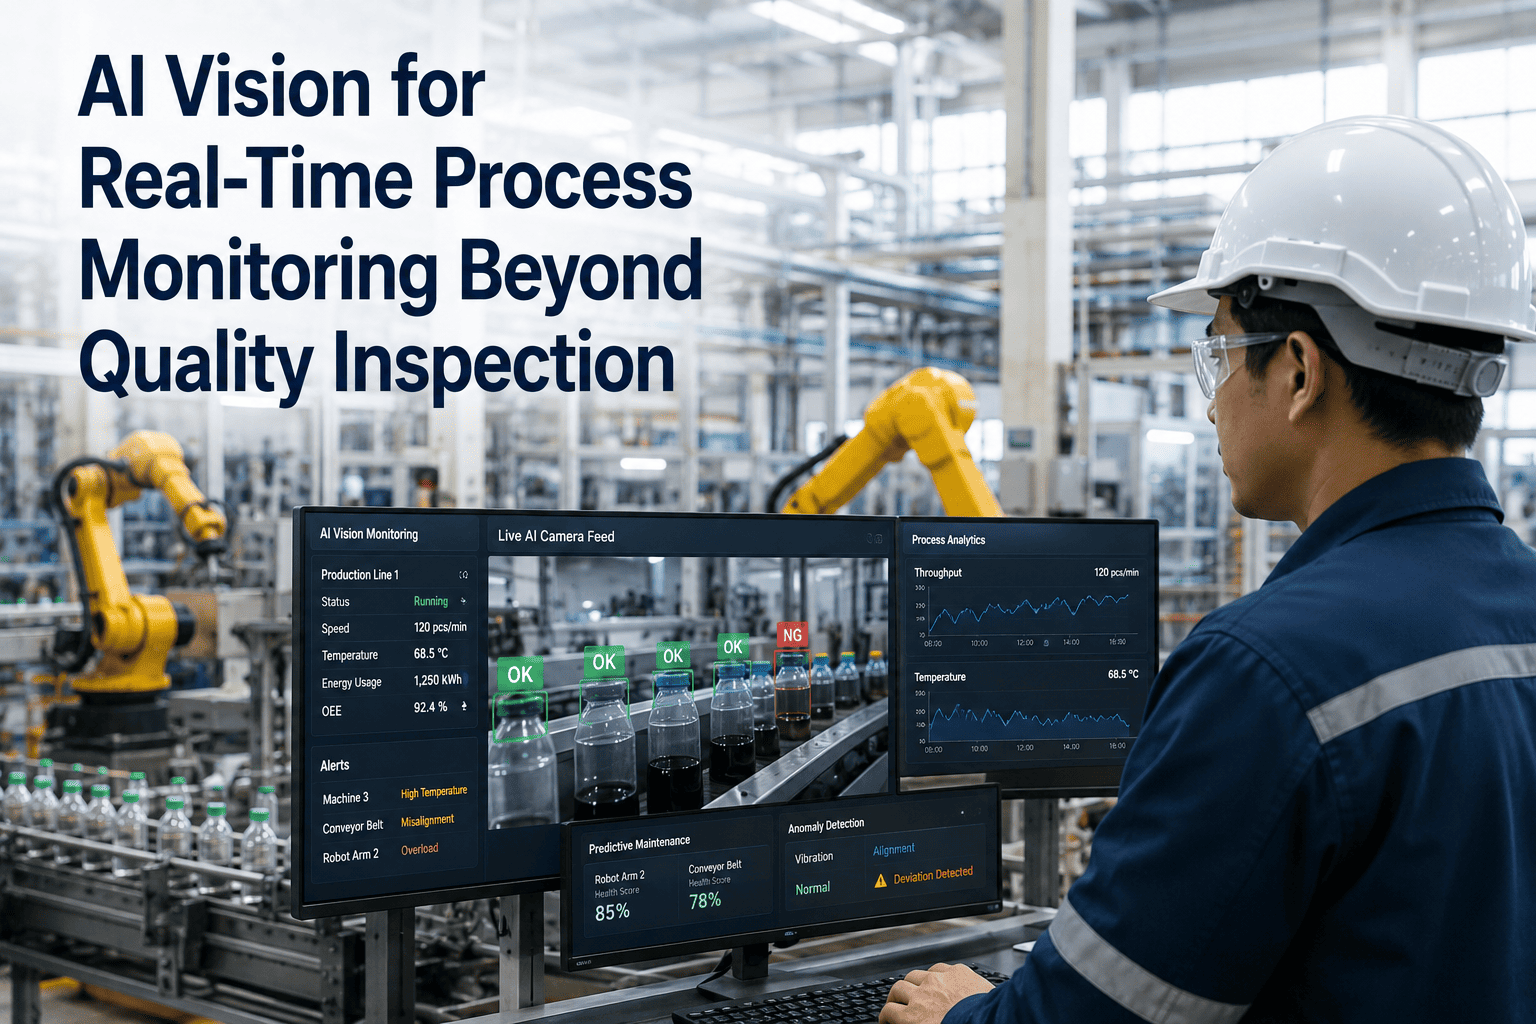
AI vision inspection generates far more data than any quality team can manually review — every part scanned produces defect classifications, coordinate measurements, and pass/fail verdicts at line speed. The intelligence gap was never the camera; it was what happened to that data after the image was taken. Real-time Statistical Process Control fed directly from AI inspection results closes that gap: instead of batching inspection outcomes into weekly reports, iFactory converts each inspection result into a live SPC data point, updates control charts within seconds, runs all eight Western Electric rules automatically, and surfaces Pareto breakdowns that show exactly which defect type is consuming your scrap budget. Plants that complete this integration have cut defect escape rates by 37% and sustained Cpk values above 1.67 on lines that were previously hovering at 1.0 or below. The complete workflow, from how AI inspection feeds SPC to how trend dashboards trigger corrective action, is documented at iFactory support.
Real-Time SPC · AI Vision Inspection · Defect Analytics
Real-Time SPC and Defect Trending from AI Vision Inspection Data
AI converts every inspection result into a live SPC data point. Control charts update in seconds. Pareto analysis identifies the defect costing you the most. Process drift gets flagged before a single out-of-spec part reaches the customer.
37%
Average defect rate reduction after AI-SPC integration
Cpk 1.67+
Sustained process capability on connected lines
Seconds
From inspection result to updated control chart
100%
Inspection coverage vs 5–10 samples/hour manual SPC
The Core Problem
Why Traditional SPC Fails When Vision Inspection Runs at Line Speed
Standard SPC programs were designed around manual sampling — a technician pulls a part every 20 minutes, measures it, plots it on a chart, and files the result. That was the world SPC was built for. An AI vision system inspects every single part at line speed and generates thousands of classified results per hour. Feeding that volume into a manual SPC workflow creates a data pile, not a quality signal.
Manual SPC Approach
5 to 10 measurements per hour — process changes between samples go undetected
Control charts updated at end of shift — drift identified hours after it started
Pareto built manually in spreadsheets — weekly, not hourly
Western Electric rules checked by eye — rule violations missed under production pressure
Cpk calculated once monthly — not a live process signal, a lagging report
AI-Integrated Real-Time SPC
Every inspection result becomes a data point — complete population control charts
Charts update within seconds of each inspection — drift visible as it develops
Pareto refreshes continuously — which defect type is spiking right now
All 8 Western Electric rules automated — alert fires the moment a pattern forms
Cpk recalculated continuously — live capability trending, not a monthly snapshot
How It Works
From Camera Pixel to SPC Alert: The Data Pipeline
Understanding the flow from inspection event to quality action is the prerequisite for configuring a system that actually catches drift before it produces defective parts. The pipeline below shows each stage and what intelligence is added at every step.
1
AI Vision Inspection
High-resolution cameras capture every part at line speed. Deep learning models classify defects by type, location, and severity. Each inspection produces a structured result: part ID, timestamp, defect classes present, dimensional measurements, and pass/fail verdict.
2
Real-Time Data Ingestion
Each inspection result streams directly into the SPC engine within milliseconds. No batch upload, no end-of-shift export. The system maps defect classifications and measurement values to the corresponding SPC characteristic for the part being run.
3
Live Control Chart Update
Control charts for defect rate, dimensional characteristics, and defect type frequency update with each new data point. X-bar R, I-MR, P-charts, NP-charts, and C-charts are selected automatically based on the data type and sample structure.
4
Western Electric Rule Detection
All eight Western Electric sensitizing rules run automatically against every new data point. Rule violations fire an alert to the process engineer's dashboard and mobile device within seconds — not at the next shift review meeting.
5
Pareto and Trend Analysis
Defect results aggregate continuously into ranked Pareto charts showing which defect type accounts for what percentage of total rejects. Trend lines show whether each defect category is climbing, stable, or declining compared to the prior shift, day, or week.
6
Corrective Action Trigger
When the system detects a rule violation or a Cpk drop below threshold, it initiates the defined response chain: operator notification, process parameter review prompt, CAPA creation, and optional production hold pending engineering sign-off.
Process Capability Reality
What Cpk Actually Means in Parts Per Million — and Why Live Tracking Changes Everything
Most quality managers can recite the Cpk benchmarks. Few have them displayed as a live number updating continuously from inspection data. The difference between a monthly Cpk report and a live Cpk signal is the difference between finding out your process drifted to 0.95 on Friday afternoon and catching it Tuesday morning before three days of marginal product leave the building.
| Cpk Value |
Defects Per Million |
Process State |
Typical Industry Requirement |
iFactory Response |
| Below 1.00 |
2,700+ ppm |
Incapable — producing defects by design |
Fails most customer specifications |
Immediate alert, production hold review |
| 1.00 – 1.33 |
2,700 – 64 ppm |
Marginal — vulnerable to variation shifts |
Minimum for general manufacturing |
Elevated monitoring, engineering review triggered |
| 1.33 – 1.67 |
64 – 0.6 ppm |
Capable — acceptable for regulated industries |
ISO, IATF, aerospace standard |
Normal monitoring, trend tracking active |
| 1.67 and above |
0.6 ppm and below |
Highly capable — Six Sigma performance |
Safety-critical and medical device target |
Sustained with automatic drift alerts |
Data source: NIST/SEMATECH Engineering Statistics Handbook, AIAG VDA SPC Manual, iFactory Deployment Data 2026. Cpk values recalculated continuously from AI inspection results in real time.
Your process drifted Tuesday. You found out Friday. AI-SPC would have told you Tuesday morning — before you shipped 3,000 marginal parts.
iFactory connects AI vision inspection results to live control charts, Pareto dashboards, and automated Western Electric rule alerts. See it running on your line's data in a 30-minute demo.
Pareto Analysis from Inspection Data
Defect Pareto Is Not a Weekly Report — It Is a Live Prioritization Engine
The original Pareto principle holds: in most manufacturing environments, roughly 20% of defect types account for 80% of total rejects. Identifying that 20% used to require a week of data collection, a spreadsheet, and a quality manager with time to build the chart. AI-integrated defect trending makes the Pareto a live dashboard that updates with every inspection cycle.
Defect Type Ranking
Scratch, pit, dimensional out-of-tolerance, burr, missing feature, color drift, contamination — each defect class iFactory's vision AI classifies gets its own running count. The Pareto bar chart sorts them by occurrence in real time, so the top defect is always visible without building a report.
Location Heatmapping
Defect coordinates on the part are aggregated across the inspection population to produce a heatmap showing where defects are clustering. A scratch concentration at the same edge across hundreds of parts points to a fixture alignment issue or a tool contact problem that a classification count alone would not surface.
Shift-Over-Shift Trend
Pareto rankings change across shifts, operators, and material lots. iFactory overlays the current shift's Pareto against the rolling 7-day baseline, making it immediately visible when a defect type that was previously minor suddenly climbs — which is the early signal that something upstream has changed.
Cost-Weighted Prioritization
Not all defects cost the same. A dimensional out-of-tolerance on a critical characteristic costs far more than a cosmetic surface mark on a non-visible surface. iFactory applies configurable cost weights to defect classes so the Pareto can be sorted by either occurrence frequency or financial impact — surfacing the defect that needs attention most urgently, not just the one that happens most often.
Process Drift Detection
Detecting Drift Before It Produces Defects: The Eight Western Electric Rules
A process can be drifting toward an out-of-control state while every individual point on the control chart is still inside the control limits. The Western Electric sensitizing rules were designed precisely to catch these patterns — and AI-SPC runs all eight of them automatically on every new data point, not just the ones a technician happens to check at the end of the shift.
Rule 1
One point beyond 3-sigma
The classic out-of-control signal. A single measurement beyond the upper or lower control limit. Statistically unlikely by chance alone — almost always indicates a real special cause. Alert fires immediately.
Rule 2
Nine consecutive points same side of centerline
All nine inside control limits, but all on the same side. The process mean has shifted — something changed upstream and the chart is showing it through a run, not a spike. Classic tool wear or material shift signature.
Rule 3
Six points in a row trending up or down
A monotonically rising or falling sequence indicates a process that is drifting systematically — tool wear, temperature build-up, gradual fixture loosening. Caught here, the corrective action is a tool change or adjustment; caught at Rule 1, it is a scrap sort.
Rule 4
Fourteen points alternating up-down
An oscillating pattern suggests two alternating process streams — two spindles, two operators, two material lots running interleaved. The individual streams may each be capable; the blended chart looks chaotic and hides the root cause.
Rule 5
Two of three points beyond 2-sigma
Points are still inside control limits but clustering near the edge. The process variation has increased even if no individual point has crossed the line yet — this rule catches the increase while there is still time to act before a breach.
Rule 6
Four of five points beyond 1-sigma
The process mean is shifting toward one control limit. Not yet a breach, but the trajectory is clear. This early warning is exactly the signal that stops a process at marginal capability from producing rejects before the next inspection sample is pulled.
Rule 7
Fifteen points within 1-sigma of centerline
Counterintuitively, this pattern signals a problem — either the control limits were set too wide, the measurement system resolution is insufficient, or subgroups are being mixed from multiple streams. The chart appears stable but the statistics are being artificially compressed.
Rule 8
Eight points in a row beyond 1-sigma both sides
Points are consistently away from the centerline on both sides. The process distribution has broadened — variation has increased even though no single point is out of control. Often indicates a worn tool or fixture that is allowing the process to drift unpredictably.
Live Dashboard Architecture
What the Quality Team Sees on the Production Floor in Real Time
A live SPC dashboard fed from AI inspection is only useful if the right people see the right information at the right time. iFactory structures the dashboard output by role — what the line operator needs to see differs substantially from what the process engineer needs and what the quality manager tracks across the shift.
Line Operator View
Workstation terminal or tablet at the machine
Current pass/fail rate for the last 100 parts
Active defect type if rate is elevated
Color-coded process status — green/amber/red
Alert notification with required action step
Last calibration and equipment check timestamp
Process Engineer View
Engineering workstation with full SPC visibility
Live X-bar R / I-MR control charts per characteristic
Active Western Electric rule violations with timestamp
Cpk trending over last 4, 8, and 24 hours
Defect Pareto by type — current shift vs 7-day baseline
Defect location heatmap overlaid on part geometry
Process parameter correlation view — defect rate vs temperature/speed/pressure
Quality Manager View
Multi-line overview with CAPA and audit trail access
All active lines — Cpk status and open rule violations
Shift summary — total inspected, defect rate, escapes
CAPA queue with status and overdue flags
Week-over-week defect trend by line and product family
Audit-ready data export with full inspection image archive
Field Example
Automotive Stamping Plant: From 2.8% Customer Rejection Rate to 0.3% in One Quarter
A tier-1 stamping supplier running body panels for three automotive OEMs was operating AI vision cameras on its main press lines but analyzing inspection results through daily batch exports into a quality spreadsheet. The cameras were catching defects at line speed; the analysis was still happening the next morning. When a micro-scratch pattern emerged on a specific panel variant mid-shift, the Pareto analysis that would have flagged it as the dominant defect type did not exist until the following morning's quality meeting — by which point 14 hours of production on that variant had been completed and staged for shipment. Customer rejection rate on that panel family was running 2.8%, costing $840,000 annually in rework and logistics fees.
After connecting the AI vision system to iFactory's real-time SPC engine, the scratch defect Pareto updated continuously throughout the shift. Within the first week of live operation, a surface scratch spike appeared in the Pareto dashboard 47 minutes into a production run — traceable to a new material lot that had different surface hardness characteristics. The press parameters were adjusted before the end of that hour. The pattern that had previously required a full shift of production and a next-morning root cause session was addressed in under an hour of run time. Over the following quarter, the customer rejection rate on that panel family dropped from 2.8% to 0.3%, removing $705,000 from the annual rework budget.
2.8% to 0.3%
Customer rejection rate, one quarter
47 min
Time to defect pattern detection vs next-morning
$705K
Annual rework and logistics savings
1 Quarter
Time from deployment to measurable customer impact
Frequently Asked Questions
What Quality Engineers Ask Before Integrating AI Inspection With SPC
Can AI vision inspection data feed existing SPC software, or does this require replacing our current system?
In most deployments, iFactory integrates with the existing QMS and MES infrastructure rather than replacing it. The AI inspection results stream into iFactory's SPC engine as an additional data source, and that data can also be exported in formats compatible with most standalone SPC packages. The integration is additive, not a rip-and-replace. iFactory's value is in providing the real-time connection layer that converts inspection results into SPC data points at line speed — a function that most legacy SPC installations were not designed to handle because they predate AI vision systems. For integration mapping specific to your current QMS or MES,
contact iFactory support with your existing system details and we can confirm the integration path before any deployment commitment.
Which control chart type does iFactory use for defect count data from vision inspection?
The chart type is selected automatically based on the data structure of what the AI vision system is producing. For inspection results where each part is classified as conforming or non-conforming, and sample sizes are constant, iFactory uses P-charts or NP-charts tracking the proportion or count of defective units. When the AI system classifies multiple defect types per part and counts are meaningful (scratches per square meter, pits per panel), C-charts or U-charts are used. For dimensional measurement characteristics produced by the vision system alongside defect classification, X-bar R or I-MR charts are applied depending on subgroup structure. The system does not require a quality engineer to configure chart types manually for each characteristic — it detects the data type and applies the correct chart automatically. For a walkthrough of how chart selection maps to your specific inspection output,
book a demo.
How does the system differentiate between a real process shift and a false alarm from the vision AI itself?
This is one of the most important integration design questions. False positives from the vision AI — parts flagged as defective that are actually within specification — appear in the SPC data as artificial spikes. iFactory addresses this in two ways. First, the inspection system's false positive rate is tracked as its own SPC characteristic: if the AI model's false alarm rate drifts upward, that is flagged as a separate alert indicating the model needs retraining rather than a process alert. Second, Western Electric rule patterns caused by genuine process shifts look different from statistical noise — a systematic run of nine points on the same side of the centerline is a process signal, a single spike followed by immediate return to baseline is more likely measurement noise. The system is configured with alarm filtering thresholds during deployment based on the baseline false positive rate of the specific AI model, so alerts reflect real process events rather than camera noise. Questions about false positive handling for your specific application can be directed to
iFactory support.
How quickly after a defect pattern emerges will the Pareto dashboard and control chart reflect it?
Each inspection result updates the Pareto and control chart within seconds of the vision system completing the inspection. There is no batch collection interval — the data pipeline is continuous. In practical terms, if a scratch defect begins appearing on parts after a material lot change, the Pareto ranking for the scratch category begins climbing immediately. Whether that emerging pattern becomes statistically significant enough to trigger a Western Electric rule violation depends on both the defect rate and the rule in question — a Rule 1 violation (single point outside 3 sigma) can fire on the very first inspection result that represents an extreme outlier, while a Rule 2 violation (nine consecutive points same side of centerline) requires nine inspection results to accumulate. At a production rate of 120 parts per minute, nine data points accumulate in under ten seconds. At 10 parts per minute, under a minute. The detection speed scales directly with production volume.
What does iFactory specifically deliver that our existing AI vision camera software does not already provide?
Most AI vision camera platforms are optimized for classification accuracy — they are excellent at determining whether a specific defect is present on a specific part. Where they typically fall short is in the statistical process control layer: they do not automatically calculate Cpk from inspection data, run Western Electric rule analysis against a continuously updated baseline, build Pareto rankings across the running production population, or route rule violation alerts through a structured corrective action workflow with timestamps and response tracking. iFactory's role is the intelligence layer between the inspection result and the quality response — transforming each classified outcome into a process signal rather than a pass/fail data point that goes into a log. If your vision camera already provides live Cpk, automated Western Electric rules, and defect Pareto by cost weight, the overlap would be significant and worth discussing. If it produces inspection results that currently feed a report, iFactory closes that gap. To see the specific gap analysis for your setup,
book a demo.
Your AI Camera Sees Every Defect. iFactory Turns That Into Live SPC, Real-Time Pareto, and Drift Alerts Before Parts Go Out the Door.
Connect your AI vision inspection output to real-time control charts, automated Western Electric rule detection, and defect trend dashboards — and stop finding out about process drift on the morning quality report.