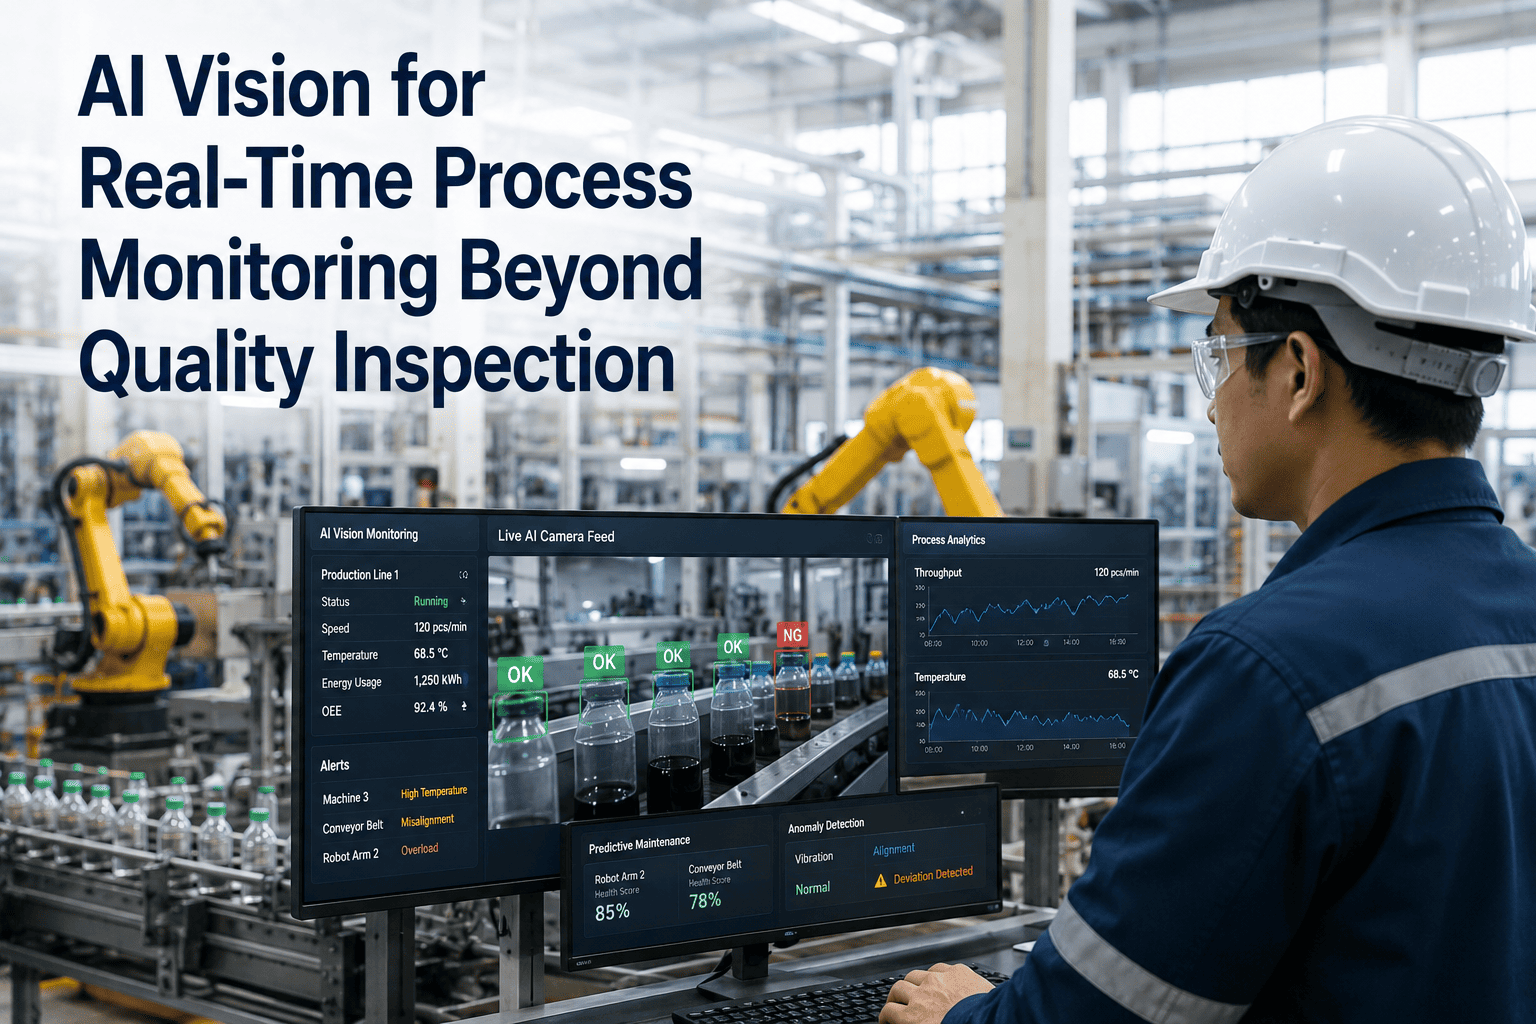
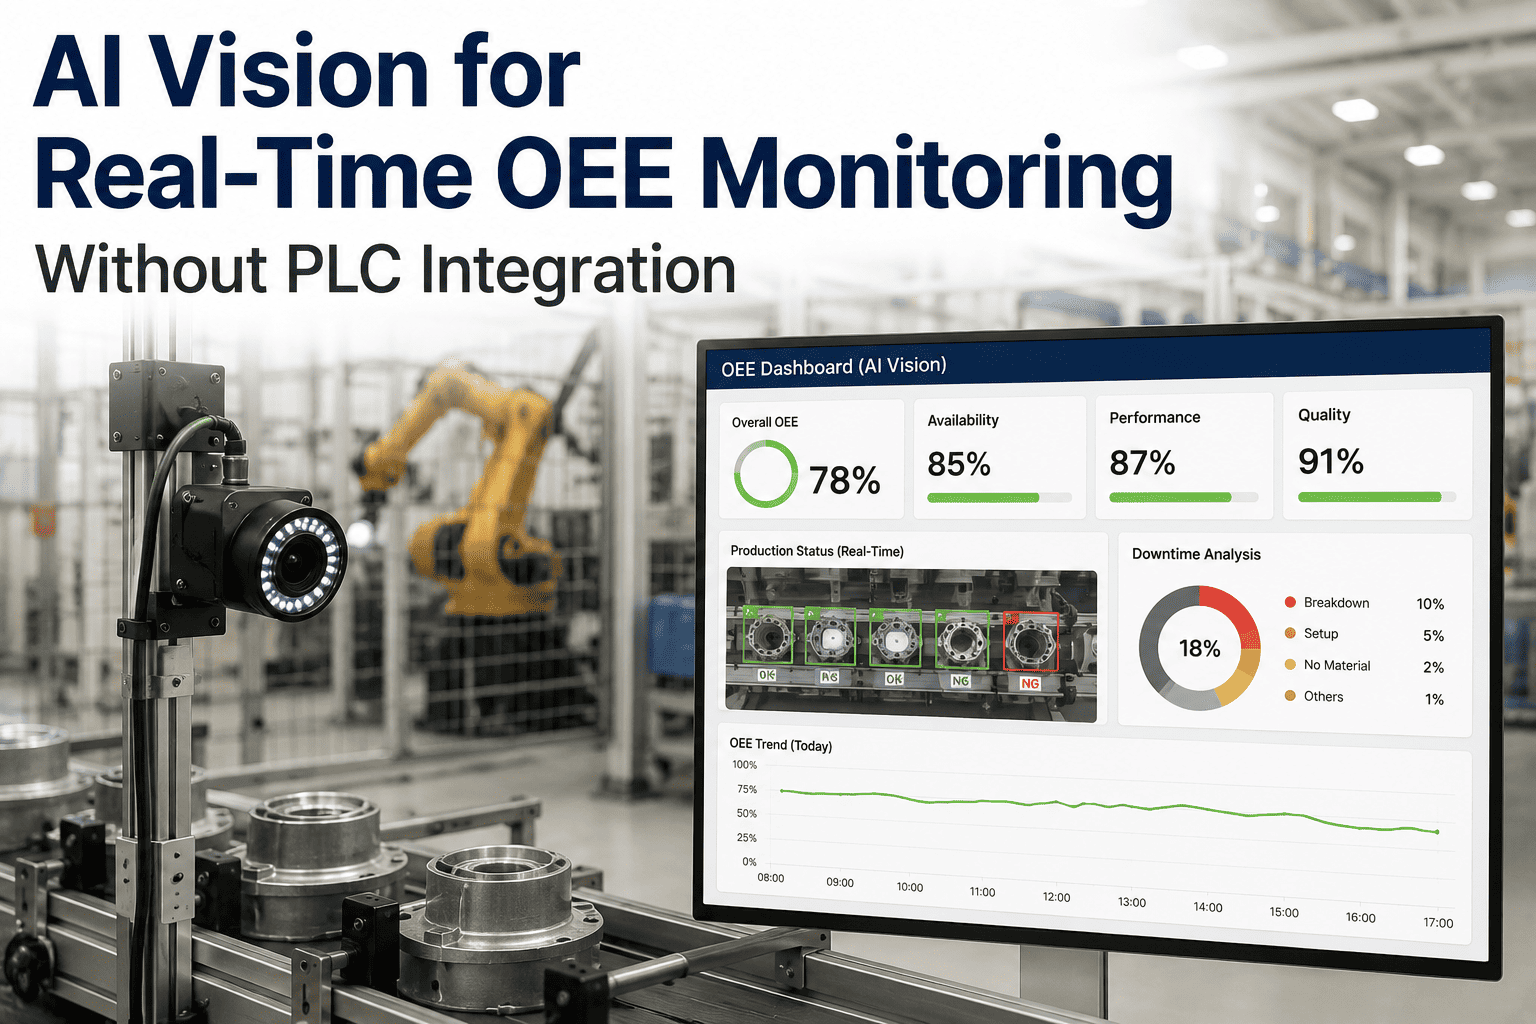
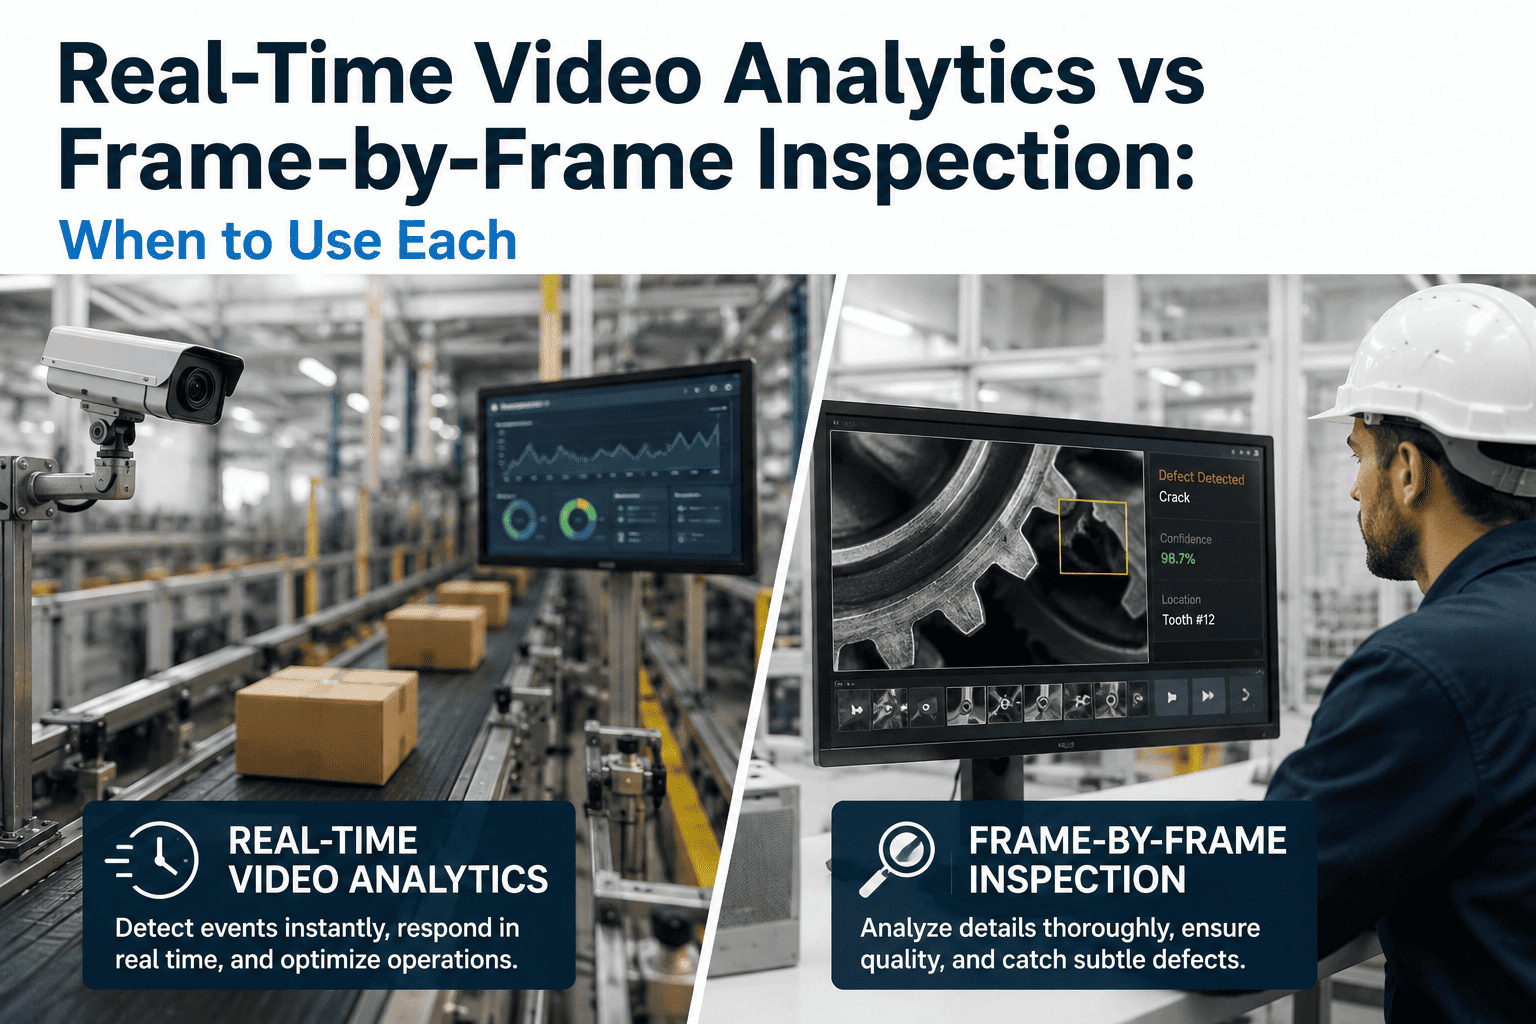
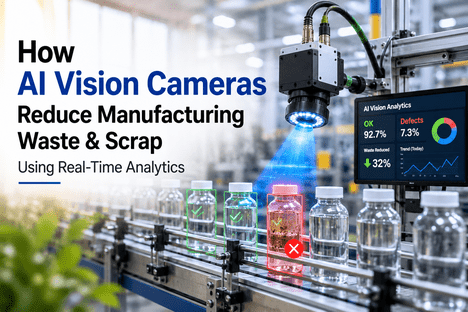
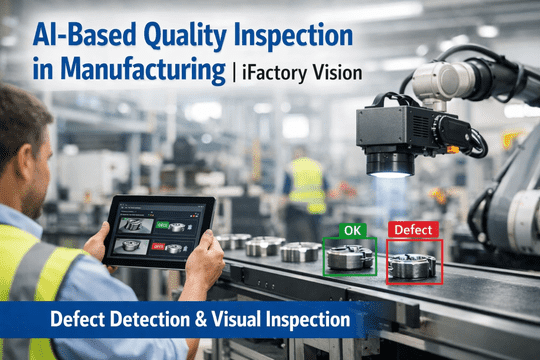
A camera pointed at a production line is usually there for one reason: catching defective parts before they leave the cell. That is a narrow use of what the sensor actually sees. The same 30-frames-per-second video stream that classifies a bad weld also carries readable information about tank levels, conveyor loading, operator presence, forklift proximity, dial-gauge readings, steam plume behavior, and dozens of other process signals the plant is currently paying separate sensors to measure — or paying nobody to measure at all. AI vision has quietly grown out of quality inspection and into something broader: a general-purpose process-signal layer that turns every camera in the facility into a source of continuous operational intelligence. Operations teams evaluating that shift can Book a Demo to see how iFactory converts existing camera streams into structured process telemetry.
AI VISION · REAL-TIME PROCESS MONITORING · BEYOND QUALITY INSPECTION
AI Vision for Real-Time Process Monitoring Beyond Quality Inspection
Liquid levels, material flow, equipment state, environmental conditions, operator activity — read directly from camera streams already installed on your floor. Process intelligence from visual data, not just defect detection.
TRADITIONAL SCOPE
Vision = Quality Inspection
Defect classification
Dimensional gauging
Assembly verification
Presence/absence checks
EXPANDED SCOPE
Vision = Full Process Layer
Liquid & bulk material levels
Flow rate & conveyor loading
Equipment state & gauge reading
Environment, safety, operator activity
What Is Actually Visible In a Single Production-Line Frame
The most useful mental model for AI vision-based process monitoring is not "camera plus classifier" but "camera as a general-purpose sensor that answers many different questions from the same pixels." A typical fixed camera watching a filling line, a mixing vessel, or a conveyor already captures signals that traditional sensor deployments would require five to ten dedicated instruments to measure independently. What has changed in the last few years is not the sensor — it is the AI stack behind the sensor, which now handles read-outs that previously required a human operator interpreting the same visual scene.
A single camera frame — what AI reads
01
Liquid Level in Vessel
Tracked pixel-by-pixel against a reference line, producing continuous percentage-fill telemetry from a transparent sight glass, tank window, or open vessel.
02
Analog Gauge Reading
Pressure, flow, temperature dials on non-networked legacy equipment digitized visually — 0 to 100 percent of scale extracted from needle position, with normal/alarm band recognition.
03
Material Flow on Conveyor
Belt loading percentage, product spacing, jam detection, and cumulative throughput — read continuously without contact-based load cells or sensor arrays.
04
Equipment Motion State
Running vs. idle vs. stopped vs. faulted classification from visible motion patterns, indicator light state, and physical positioning of moving components.
05
Operator Presence & Activity
Whether an operator is at the station, what task they are performing, whether PPE is worn correctly, and whether unsafe proximity to hazards is developing.
06
Environmental Anomalies
Steam or smoke plumes indicating leaks, spills on floor surfaces, lighting failures, or unexpected visual changes in the physical work environment.
The economic argument is straightforward once the scene is framed this way. A plant with existing camera coverage — most modern facilities already have significant CCTV, quality-inspection, or safety-monitoring camera infrastructure — can turn on five or ten additional process signals per camera without installing a single new physical sensor. Every one of those signals is a data stream that would previously have required its own instrument, its own wiring, its own PLC input, and its own maintenance. The AI-vision approach compresses that hardware cost to zero and shifts the value creation to software. The second-order effect matters more than the first: because adding a new signal is a model update rather than a hardware installation, the cost of asking "what else could this camera tell us" drops toward zero. Plants that historically had to justify every new instrument through a capital request now iterate on signal coverage the same way they iterate on software features — weekly if the value is there, monthly if it is not.
Four Domains Where Vision Beats Traditional Sensors On Cost and Coverage
Not every process measurement makes sense to solve with computer vision — flow meters remain the right tool for high-accuracy custody transfer, and temperature sensors remain the right choice for precise thermal control loops. But there is a large middle territory where traditional sensors are either impractical, expensive to install and maintain, or physically unable to reach the measurement point, and where vision-based measurement has now crossed the accuracy threshold to become the default choice. Four domains capture the majority of that middle territory, and understanding which domain a specific measurement point falls into is the fastest way to decide whether vision is the right approach for it. Plants that try to force-fit vision into every measurement point overreach; plants that only use vision for quality inspection under-reach. The correct middle ground is domain-by-domain evaluation.
DOMAIN 01
Level & Fill Monitoring
Vessels, tanks, hoppers, silos, bins, and open containers where installing a contact-based level sensor is impractical, unsafe, or cost-prohibitive. Vision tracks fill level continuously from sight glasses, transparent walls, top-down camera angles, or reference marker patterns.
Typical applications
Chemical mixing vessels, food processing tanks, bulk material silos, hazardous material containers, reaction vessels in R&D and pilot-plant environments
DOMAIN 02
Material Flow & Throughput
Conveyor loading, product spacing, jam detection, unit counting, and cumulative throughput measurement without contact-based load cells or beam sensors. Vision reads the actual physical material flow, not a proxy signal from equipment status.
Typical applications
Packaging lines, mining and aggregate conveyors, food processing belts, warehouse sortation, bulk-handling systems, discrete part manufacturing
DOMAIN 03
Legacy Equipment Digitization
Analog gauges, mechanical counters, panel indicators, and older equipment output that is not networked and would require expensive retrofit to bring into a modern data stack. Vision reads the display visually and outputs a normalized digital value.
Typical applications
Legacy pressure and flow gauges, mechanical hour counters, mechanical stroke counters on presses, analog thermometers, older utility meters on plant infrastructure
DOMAIN 04
Safety, Environment & Activity
PPE compliance, restricted-zone incursion, forklift-pedestrian proximity, spill detection, steam or smoke plume anomalies, and operator task activity — signals that no traditional sensor produces because they require scene-level understanding rather than point measurement.
Typical applications
EHS compliance monitoring, warehouse safety zones, chemical spill detection, ergonomic activity analysis, workforce productivity monitoring
CAMERA STREAMS · PROCESS SIGNALS · STRUCTURED TELEMETRY
Turn Every Camera Already On Your Floor Into a Multi-Signal Sensor
iFactory ingests existing camera streams, applies process-specific vision models to extract level, flow, gauge, equipment, and activity signals, and pushes normalized telemetry into your MES, historian, and SCADA systems as if it originated from dedicated instruments.
The Deployment Stack: How Vision Signals Actually Get Into Your Data Layer
The architecture behind production-grade vision-based process monitoring has stabilized around a specific set of components in the last two years. Edge inference sits close to the camera to keep decision latency inside cycle-time constraints; model training and refinement happen centrally with data flowing back from every deployed camera; extracted signals normalize into standard industrial protocols so downstream MES, historian, and SCADA systems consume them the same way they consume any other sensor. Understanding the stack matters because it determines what installation actually looks like on the floor, and where vendor lock-in risk lives.
01
Camera Layer
Existing CCTV, quality inspection, or safety cameras with sufficient resolution, frame rate, and viewing angle for the target signal. New installations use industrial IP cameras with PoE. Most deployments reuse existing infrastructure.
02
Edge Inference Layer
Industrial-grade edge computing devices running vision models locally, with inference latency in low milliseconds. Keeps decisions inside cycle time and avoids bandwidth costs of streaming full video to central servers.
03
Signal Normalization Layer
Raw model outputs — bounding boxes, classification labels, keypoint coordinates — converted into engineering-unit signals: percentage fill, units per minute, gauge value, state code. This is where vision output becomes indistinguishable from traditional sensor telemetry.
04
Industrial Protocol Bridge
Signals published to OPC UA, MQTT, Modbus, or direct historian ingestion — the same integration surfaces your PLCs, DCS, and instruments already use. Downstream systems consume vision-derived data without changes to their integration logic.
05
Model Training & Refinement Loop
Centralized platform for labeling new imagery, retraining models against site-specific variations, and pushing updated models back to the edge. Handles the calibration drift that plant conditions inevitably introduce over time.
The critical architectural decision most plants get wrong on their first attempt is trying to run inference in the cloud rather than at the edge. Cloud inference works for offline batch analytics but breaks down for real-time process control — cycle-time constraints in most manufacturing environments are measured in milliseconds, and network round-trip latency alone consumes that budget before any inference computation happens. Edge deployment is not a nice-to-have architectural choice; it is what makes vision usable as a control-loop input rather than a reporting-only signal. Automotive manufacturers deploying these systems now standardize on industrial-grade edge devices positioned within the production cell itself, running inference locally and streaming only extracted signals — not full video — to central data platforms. This architecture also solves a bandwidth cost problem that would otherwise cripple plant-wide vision deployment: a single 4K camera at 30 frames per second generates several megabytes per second of raw video, and multiplying that across dozens of cameras streaming to a central inference cluster produces network utilization figures no plant network was engineered for. Edge inference keeps the video local and sends only the structured signals the rest of the stack actually needs.
Vision Signals vs. Traditional Sensor Signals: Where Each Wins
Vision-based measurement is not a universal replacement for traditional sensors — the two categories have complementary strengths, and mature deployment programs use each where its physics makes it the right answer. The comparison below breaks down the practical differences that determine when a vision signal beats a dedicated sensor and when it does not.
The pragmatic path most plants land on is a hybrid: keep traditional sensors on the measurement points where accuracy or safety certification requires them, and add vision signals as a broad overlay across every process point that previously had no measurement at all because instrumenting it with a dedicated sensor was not economically justifiable. That overlay is where the operational visibility gap in most plants actually sits, and it is where vision adds coverage no other technology can match on cost. The interesting shift over the next five years is not that vision replaces sensors — it is that the set of measurement points a plant instruments grows by an order of magnitude, because the marginal cost of adding a new measurement drops from thousands of dollars to essentially the cost of a model update. Plants that have historically operated with fewer than a hundred instrumented process points routinely reach several hundred continuously monitored points within the first year of a vision-based rollout, and the operational visibility that produces is what actually drives the ROI, not the cost savings on the sensor purchases themselves.
What Changes Operationally When Cameras Become Process Sensors
The change is not that plants get one more data source — plants already have plenty of data sources. The change is that plants get continuous visibility into the parts of the process that historically were only observed when an operator physically walked past them. That structural shift produces a set of operational outcomes that are easy to underestimate on paper and hard to reverse once they land. The pattern is consistent across facilities and industries: teams that were skeptical during pilot deployment become the strongest internal advocates six months in, because the operational habits that form around continuously visible process data are qualitatively different from the habits that formed around walk-round visual checks. The list below covers the six outcomes production deployments most reliably report.
CONTROL
Real-Time Loop Closure
Vision signals feed process control decisions inside cycle time — a tank filling too fast triggers valve modulation, a conveyor jamming stops upstream feed, a gauge crossing threshold pages the on-call operator. Actions happen before the deviation propagates downstream.
Root-Cause Speed
DIAGNOSTICS
When quality issues appear, correlated vision signals across upstream process points show exactly which parameter drifted first, when, and by how much. Root-cause investigation collapses from days of interviewing operators to minutes of reviewing timestamped signal traces.
COMPLIANCE
Continuous Evidence Capture
EHS, GMP, and quality compliance records shift from periodic inspection logs to continuous automated verification. PPE compliance rate becomes a continuously measured metric rather than a periodic audit sample. Documentation is generated as a byproduct of operation.
PLANNING
Visibility Where Instruments Never Reached
Process areas that were operationally opaque because instrumenting them was too expensive become fully visible. Planning, scheduling, and capacity analysis decisions get made against continuous data rather than sampled walk-throughs.
SAFETY
Proactive Hazard Detection
Unsafe proximity, restricted-zone incursion, missing PPE, and near-miss patterns get detected as they develop rather than after incidents happen. Safety metrics move from lagging incident counts to leading behavioral indicators.
WORKFORCE
Operator Focus Elevation
Routine visual monitoring tasks — walking rounds to check gauges, verify tank levels, confirm equipment states — get automated, freeing operator attention for judgment-level tasks that only humans handle well. Workforce capacity expands without headcount growth.
The common thread across all six outcomes is that they compound rather than substitute for each other. A plant that gains real-time loop closure also gains root-cause speed on the deviations that still make it through; a plant that gains continuous compliance evidence also gains the safety visibility that reduces the incident rate the compliance system is documenting. Programs that treat vision-based process monitoring as an incremental improvement to any single one of these dimensions underestimate what happens when all six move together — which is what actually determines whether the deployment pays back within the first year or the third.
Frequently Asked Questions: AI Vision for Process Monitoring
How accurate are AI vision signals compared to dedicated process sensors?
For monitoring and threshold-based use cases — level tracking, flow-rate estimation, gauge digitization, equipment state classification — modern vision models routinely deliver accuracy sufficient for operational decisions, with reported detection accuracy above 99 percent on well-conditioned scenes. For high-precision applications requiring certified measurement accuracy — custody transfer, safety interlocks, precise closed-loop control — dedicated sensors remain the correct choice. The right architecture uses each where its physics fits the requirement. Teams evaluating specific measurement targets can
Book a Demo to see accuracy benchmarks for their exact use case.
Do we need to install new cameras to deploy vision-based process monitoring?
Usually not for the first wave of deployment. Most facilities already have significant camera coverage installed for CCTV, quality inspection, or safety monitoring purposes, and those existing streams cover a meaningful portion of the process points where vision-based measurement adds value. Additional cameras are added incrementally for specific process areas where existing coverage does not include the target scene, but the initial rollout typically leverages what is already installed rather than requiring parallel new hardware.
How does vision-based monitoring handle changing lighting, occlusion, or camera fouling?
These are the practical failure modes production deployments have to design for explicitly. Modern platforms include capture-quality gates that reject frames failing lighting, focus, occlusion, or contrast thresholds before those frames feed the inference layer — a signal derived from a bad frame is worse than no signal at all. Camera health monitoring flags fouled lenses, misalignment, or environmental changes for maintenance intervention, and confidence scores on every signal reading allow downstream systems to treat degraded readings appropriately rather than trusting them equally with clean readings.
Can vision signals actually feed real-time control loops, or only monitoring dashboards?
Both, and this is where the architectural distinction between edge and cloud inference matters most. Edge-deployed vision models produce inference results in low-millisecond latency, which is fast enough to feed real-time control decisions within cycle-time constraints in most manufacturing environments. Cloud-inferenced vision cannot support real-time control because network round-trip latency alone exceeds the cycle-time budget. Production deployments architected for control-loop integration always use edge inference; deployments architected for monitoring and reporting only can use either.
What is the typical rollout timeline from first camera to production-scale coverage?
Initial pilot deployment on a single production area typically takes weeks rather than months once existing camera infrastructure and target signals are identified. Scale-up to plant-wide coverage runs on the order of months, with the pace determined more by model refinement against site-specific conditions than by hardware installation. Full production programs generally reach steady-state coverage within a single fiscal year and continue expanding signal coverage per camera over subsequent quarters. Operators planning rollout sequencing can contact
iFactory Support to discuss phased deployment architecture.
CAMERA-DERIVED TELEMETRY · EDGE INFERENCE · CONTROL-LOOP INTEGRATION
Stop Paying For Sensors When Your Cameras Already See the Signal
iFactory turns existing camera coverage into a plant-wide process signal layer — feeding level, flow, gauge, equipment, and activity telemetry into the same MES, historian, and SCADA systems your traditional instruments already speak to, with edge-inference latency low enough to close real-time control loops.