Most plants believe they know their OEE. They have a number — written on a whiteboard at shift end, pulled from a SCADA display, or calculated the next morning from paper logs. What that number does not capture is the 4-second jam that cleared itself before anyone could write it down, the line that ran at 91% of ideal speed for the whole afternoon without triggering a single alarm, or the 23 minutes of actual stoppage that the PLC logged as running because the motor kept turning even though no product was moving. The gap between reported OEE and real OEE in plants without continuous visual monitoring averages 12 to 15 percentage points — and every point is recoverable production capacity that is currently invisible. iFactory's AI vision cameras close that gap by watching the line directly, counting every unit, timing every cycle, and logging every stoppage from direct observation — without touching your PLC, without installing new sensors, and without modifying a single line of control code. Contact the iFactory team to see what your line looks like under continuous visual monitoring.
AI Vision · OEE Monitoring · No PLC Required
See Your Real OEE — Not the Number Your Shift Log Produces
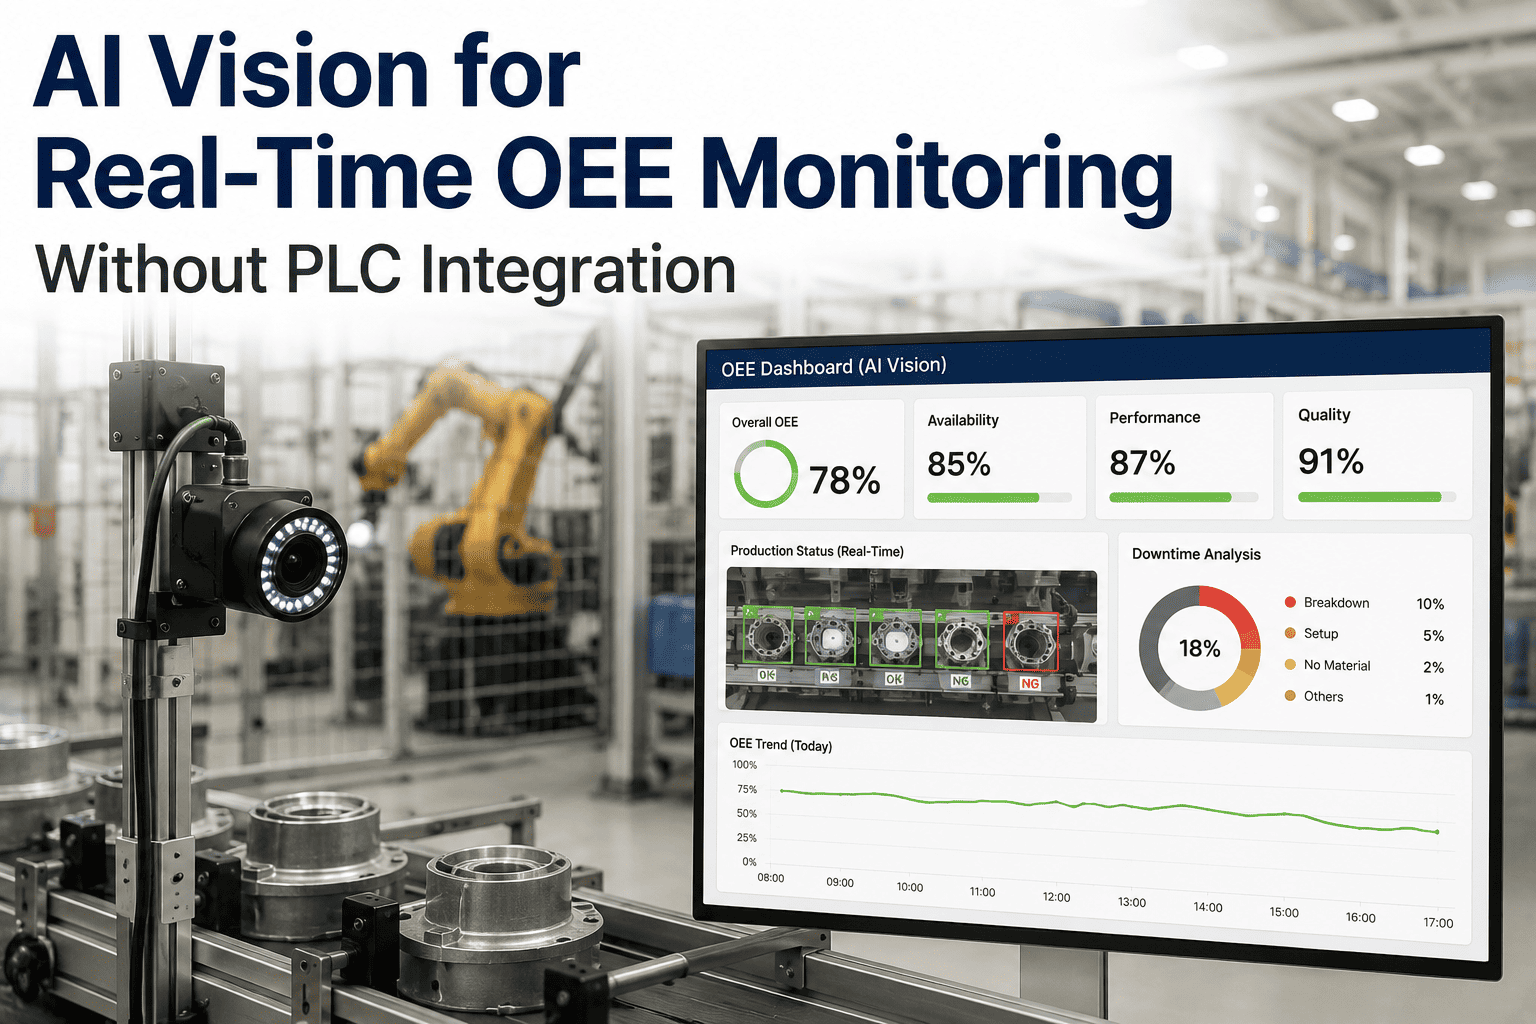
iFactory mounts industrial AI cameras above your production line. They count every unit, time every cycle, and log every stoppage from direct visual observation — calculating Availability, Performance, and Quality in real time, with zero PLC access required.
Live OEE Score
Calculated from visual observation — no PLC connected
The Measurement Problem
Why Reported OEE Is Almost Always Higher Than Actual OEE
The global industry average OEE across discrete manufacturing is 55 to 65%. World-class is defined as 85% — achieved by fewer than 10% of plants. But the most important number is rarely either of those. It is the gap between what your current measurement system reports and what is actually happening on the line. That gap exists because of three structural failures in how most plants collect OEE data.
Micro-Stop Blindness
Stoppages under 2 to 5 minutes are below the logging threshold on most OEE platforms — so operators never record them. A 4-second jam that clears itself is invisible. When this happens 100 times per shift, the cumulative loss is 67 minutes of production that never appears in any report. Micro-stops alone account for 8 to 15% of total production capacity lost.
8-15% capacity lost to unlogged micro-stoppages
Speed Loss Invisibility
A line running at 91% of ideal cycle time triggers no alarms, shows no downtime events, and passes every shift log check. But it produces 9% fewer units per hour than planned — a performance loss that accumulates silently across every shift. PLC motor-run signals cannot detect this because the motor is still running. Only visual cycle-time measurement catches it.
5-15 Performance points hidden in speed losses
Manual Entry Understating
Manual OEE data entry understates downtime by 30 to 60% because operators log events at shift end from memory, not in real time. Stoppages get rounded, merged, or simply forgotten. The OEE number produced by a manual paper-based system is not an accurate measure of line performance — it is an approximation that consistently overstates how well the line ran.
30-60% downtime underreporting in manual systems
How It Works
What the AI Camera Actually Sees — and How Each Observation Becomes an OEE Data Point
A single iFactory AI camera positioned above the production line watches the product flow continuously. It does not measure motor current, read encoder pulses, or poll PLC registers. It watches. And from what it sees, it calculates all three OEE factors independently — creating a measurement source that is completely decoupled from the control system.
Products detected and counted
Unit Counting
Every product passing through the camera field of view is individually detected and counted. The total updates continuously on the shift dashboard. Mixed-SKU lines are handled automatically — the model classifies each unit and maintains separate counts per product type, marking changeover points in the record without operator input.
Feeds: Quality factor (good units vs. total detected)
Running — 2h 14m
Stopped — 4m 12s
Running — 38m
Micro — 7s
Stoppage Detection
When the interval between detected products exceeds a configurable threshold, the system logs a stoppage event with a precise start and end timestamp — capturing every stop including those that resolve in seconds. Unlike PLC-based tracking, vision detects stops upstream of the monitored point even when the motor is still running.
Feeds: Availability factor (run time vs. planned time)
+0.8s per unit — 17% speed loss
Cycle Time Measurement
By timing the interval between successive detected units, the AI calculates actual cycle time per unit and compares it against the ideal cycle time for the current SKU. A line running at 4.8 seconds per unit against an ideal of 4.0 seconds shows a 17% performance loss — invisible to any system that only checks whether the machine is on or off.
Feeds: Performance factor (ideal speed vs. actual speed)
Your Line Is Already Telling You Where the Losses Are. The Camera Just Has to Listen.
iFactory ships a pre-configured NVIDIA AI edge server, racked and ready. Mount the camera above the line, connect power and Ethernet, and real-time OEE monitoring is live — with no PLC access, no sensor installation, and no IT project required. Live in days, not months.
Day 1
Camera mounted, edge server connected, live video feed confirmed
Day 2
AI model calibrated to product type and ideal cycle time — counting live
Week 1
First full shift OEE report with micro-stop breakdown available for review
Month 1
Trend data across shifts and SKUs — root causes ranked by capacity impact
The Six Big Losses — Visible by Camera
Every OEE Loss Category That AI Vision Detects Without PLC or Sensor Data
The Six Big Losses framework behind OEE identifies the six categories of production loss that reduce equipment effectiveness. AI vision detects all six from camera observation alone — and for two of them, cycle time-based performance losses and micro-stoppages, vision measurement is more accurate than PLC-based systems.
OEE Factor
Loss Category
How Vision Detects It
PLC Can Catch?
Availability
Unplanned Breakdowns
Product flow stops entirely — zero units detected for duration beyond threshold. Timestamp logged at exact second of stoppage.
Yes
Availability
Changeovers and Setup
Product flow stops, then resumes with a different unit type detected — changeover boundaries marked automatically without operator input.
Partial
Performance
Micro-Stoppages
Inter-unit interval exceeds ideal cycle time briefly — logged with sub-second precision regardless of duration. No minimum duration threshold.
No
Performance
Reduced Speed
Actual inter-unit interval measured continuously against ideal cycle time. A 9% speed reduction is detected and flagged the moment it begins — not at shift end.
No
Quality
Startup Rejects
Units after a stoppage or changeover are individually classified — defect classification active on the first unit after restart to catch first-piece rejection.
No
Quality
Production Defects
Every unit inspected visually in the same camera pass. Defect events are counted separately from good units to feed the Quality factor of OEE automatically.
No
Legacy Equipment Advantage
The Lines That Benefit Most Are the Ones You Cannot Connect Anything To
Most OEE monitoring solutions assume modern, connected equipment — PLCs with open communication ports, SCADA systems with available OPC-UA tags, and an IT team willing to configure integration. That assumption disqualifies a substantial portion of the installed manufacturing base. Machines from the 1990s and early 2000s often have no external data port at all. Older PLCs use proprietary protocols that require vendor-specific hardware to read. And in many plants, the controls team will not authorise external connections to production PLCs regardless of how the request is framed — the risk of control system disruption is simply too high.
iFactory vision monitoring requires nothing from the machine. The camera looks at the output side of the process — the conveyor, the exit chute, the indexing table, the part accumulator. It counts what comes out. It times the intervals. It logs the stops. The machine's age, protocol, control architecture, and network accessibility are completely irrelevant to whether the system works.
A camera has never interrupted a production line by failing. A new PLC integration has.
CNC Machining Centres
Older Fanuc, Siemens, or Mitsubishi controllers with no open data port — camera monitors part-exit chute for cycle completion without controller access
Injection Moulding Machines
Camera detects each shot cycle by observing the ejection gate or part drop — cycle time, mould open/close events, and short-shot detection without hydraulic sensor access
Packaging and Filling Lines
Units counted at the conveyor exit point — speed losses and micro-jams on infeed mechanisms detected visually regardless of conveyor drive control architecture
Assembly and Manual Stations
No machine at all — camera tracks operator cycle time, idle time, and unit completion rate for work cells where there is nothing to wire into by definition
Measured Outcomes
What Plants Discover in the First Weeks of AI Vision OEE Monitoring
12%
Average OEE recovered within 6 months
Plants deploying iFactory's micro-stop detection recover an average of 12 OEE percentage points within six months — without adding equipment, headcount, or capital expenditure.
10-15%
OEE gain in first weeks
Customers typically see 10 to 15 percentage points of OEE improvement in the first weeks of monitoring, driven by micro-stop visibility that was simply not captured before.
30-60%
Downtime previously unreported
Manual OEE systems structurally understate downtime by 30 to 60 percent. Visual monitoring captures every event, including those that resolve before any human can log them.
48 hrs
From mount to first OEE data
Camera installation, edge server configuration, and model calibration to product type completes in 48 hours or less on a standard conveyor line — no PLC project timeline required.
0
PLC connections or modifications
Every OEE data point — Availability, Performance, and Quality — is derived from camera observation alone. No control system access. No IT security review. No engineering change order.
5x+
ROI in cycle time visibility alone
One EMS manufacturer deploying AI cycle time monitoring across assembly stations achieved a 5.2% UPH improvement within four weeks — a greater than 5x ROI on the monitoring investment itself.
Frequently Asked Questions
What Production and Operations Teams Ask Before Deploying Camera-Based OEE Monitoring
How accurate is visual unit counting compared to PLC counter or photocell data?
In controlled deployments, iFactory's AI unit counting achieves accuracy above 99.5% on single-lane conveyors and above 98% on multi-lane or irregular product flows, verified against ground truth counts. The accuracy advantage over PLC counters is in what is counted: a photocell counts interruptions, which can include phantom counts from vibration or miss counts from products passing simultaneously. The AI camera counts detected product instances, which is conceptually closer to the actual unit count that matters for OEE. For lines with existing and trusted PLC counter data, iFactory supports a hybrid mode where visual counting cross-validates the PLC count and flags divergences — giving you a confidence measure on your existing data rather than replacing it.
Book a demo to run a live counting comparison on your specific product type.
What happens when the product changes and the line runs a different SKU?
iFactory handles SKU changeovers in two ways depending on how your line operates. If changeovers involve a visual change in the product — different shape, size, colour, or packaging format — the AI model detects the change automatically and creates a changeover event in the OEE record without any operator input. Cycle time targets and ideal speed for the new SKU are applied automatically from the pre-configured product library. If changeovers are not visually distinguishable, an operator can confirm the changeover on the iFactory HMI screen, which takes under 10 seconds. Either way, the OEE calculation resets for the new production order and the changeover duration is attributed to the Availability factor. Mixed-SKU lines that run multiple product types simultaneously are also supported through multi-class detection.
Contact our team to confirm model configuration for your specific product mix.
Can the camera-based OEE data feed into our existing MES or ERP system?
Yes — while the core OEE monitoring system requires no MES connection to operate, iFactory provides outbound data integration via REST API, OPC-UA, and MQTT for plants that want vision-derived production counts, cycle times, and OEE scores to flow into their existing MES production order records or ERP production reporting. Shift-level OEE summaries can be pushed to SAP, Oracle, or any MES that accepts structured API input. Real-time event streams — stoppage events, SKU changeovers, count milestones — can be subscribed to by any MQTT-capable system. The integration is optional and additive: the vision monitoring system delivers full OEE reporting through its own dashboard without requiring any external system connection, and MES integration can be added at any point after initial deployment without modifying the camera configuration.
Does the system work in poor lighting, high-vibration, or dusty production environments?
iFactory specifies industrial IP67-rated cameras rated for the temperature, dust, and humidity conditions of the target environment. For low-light applications — common in older facilities without LED overhead lighting — the camera mount includes a supplemental illumination ring that provides consistent, controlled lighting on the inspection zone without affecting the broader production environment. High-vibration environments require vibration-isolated camera mounts, which iFactory includes in the mounting hardware package for applications where conveyor vibration would otherwise blur the image at the required frame rate. The AI model is also calibrated for the specific background and lighting conditions of each installation during the Day 2 commissioning step, so environmental variation that is consistent is absorbed by the model rather than producing false stoppage events. Environments with highly variable lighting — outdoor lines, lines with large overhead doors — require additional assessment.
Book a demo to review camera specification for your environment.
Can one camera monitor multiple machines or do we need one per line?
The standard deployment uses one camera per measurement point — typically positioned above the output end of a line, machine, or work cell where the product exits the process. A single camera field of view can cover a conveyor width of up to 1,200 mm at standard mounting height while maintaining sufficient resolution for reliable product detection. For cells where multiple outputs are visible in a single overhead view, the AI can track multiple lanes simultaneously from one camera position. For longer production lines with multiple bottleneck points, additional cameras can be added and all feeds are aggregated into a single OEE view in the iFactory dashboard — giving you per-station OEE breakdowns alongside the overall line score. The edge AI server handles up to eight simultaneous camera streams on standard hardware, so multi-point monitoring does not require additional server hardware for most plants.
Contact iFactory to design the camera layout for your specific line configuration.
Your Shift Log Is Not Telling You What Your Line Is Actually Doing. A Camera Will.
iFactory AI vision cameras deploy in 48 hours on any production line — including legacy equipment with no PLC access, no open data ports, and no control system documentation. Real OEE from direct observation. No integration project. No engineering change order.