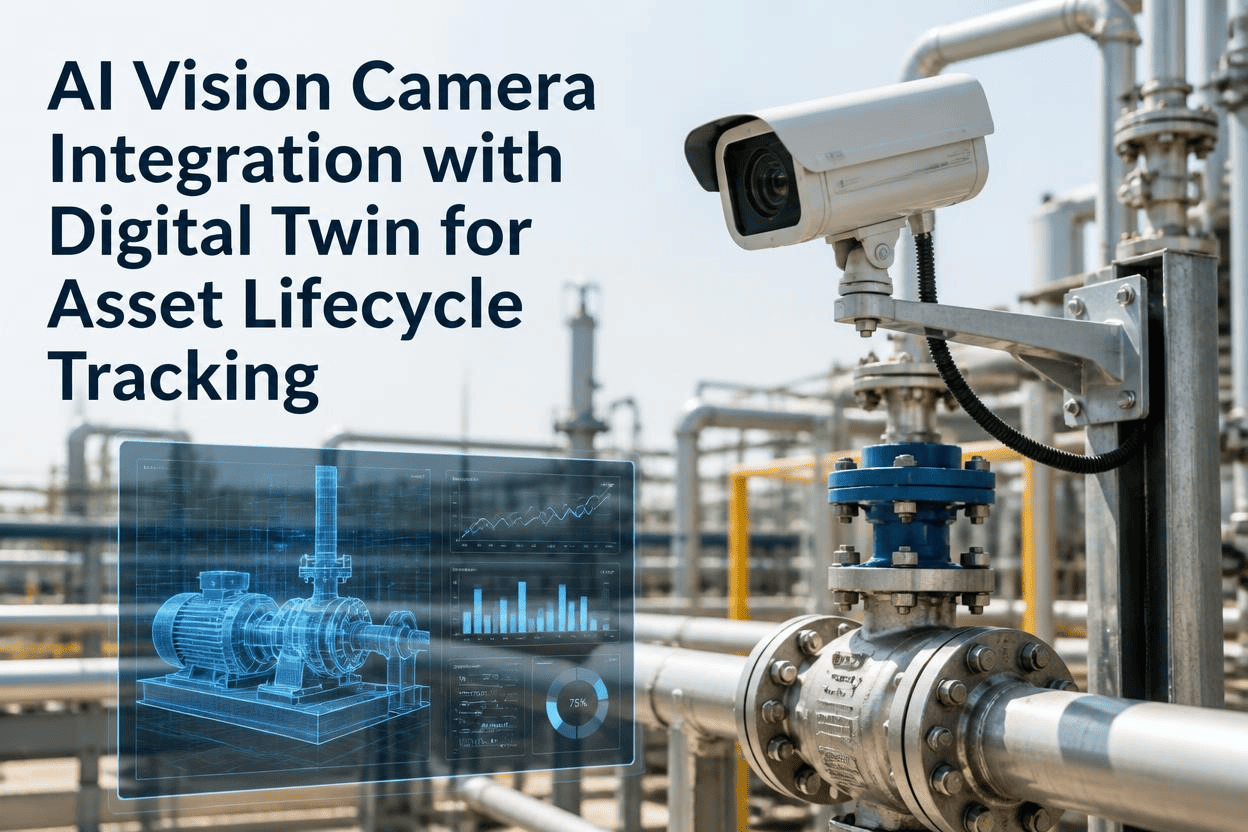
A digital twin that models your equipment geometry and process parameters but has no visual sense of what is actually happening on the plant floor is like a building blueprint that cannot tell you whether the walls are cracking. Most digital twin implementations in manufacturing today are populated from SCADA data, ERP records, and engineering CAD models, all of which describe what the asset is supposed to be doing rather than what it actually looks like right now. Corrosion spreading across a vessel, a conveyor belt fraying at the edges, or a seal developing surface cracks are conditions that exist in the physical world but have no representation in a data-only twin. AI vision cameras close that gap by feeding measured visual condition data, timestamped defect images, and inspection histories directly into the twin model so that every asset carries its complete visual record through every stage of its operational life. You can book a demo to see how iFactory connects vision data to your digital twin infrastructure.
DIGITAL TWIN · AI VISION · ASSET LIFECYCLE · INDUSTRY 4.0
Your Digital Twin Knows the Spec — AI Vision Shows It the Reality
iFactory's AI vision platform captures visual condition data at every inspection point and feeds it into your digital twin, giving every asset a living visual history that updates with each camera capture.
Install and Commission
Baseline Visual Record
Operational Monitoring
Scheduled Condition Captures
Degradation Detection
AI Flagged Anomalies
Maintenance Intervention
Pre and Post Repair Images
End of Life Assessment
Full Visual History Archive
THE VISUAL GAP
Most Digital Twins Are Visually Blind — Here Is What They Cannot See
Digital twins built from sensor data and engineering models capture the operational behavior of an asset but miss the physical surface conditions that precede the majority of mechanical and structural failures. The four metrics below quantify the scale of that blind spot across manufacturing facilities that have deployed twins without visual integration.
67%
Of Asset Failures Have Visible Precursors
Two-thirds of equipment failures in manufacturing show detectable surface changes like corrosion, cracking, wear, or discoloration before they produce any sensor anomaly that a data-only twin would capture.
91%
Of Twins Lack Any Visual Data Layer
The vast majority of manufacturing digital twins in production today are built entirely from SCADA, historian, and ERP data feeds with no image-based condition information from any source.
5.3x
More Accurate Remaining Life Estimates With Vision
When visual degradation measurements are combined with sensor-based models, remaining useful life estimates improve by over five times compared to sensor data alone on the same asset population.
38%
Of Maintenance Decisions Change With Visual Context
When maintenance planners can see the actual visual condition of an asset inside the twin rather than relying solely on a numerical health score, over a third of maintenance decisions change in priority or timing.
DATA LAYERS
Five Data Layers That AI Vision Adds to a Digital Twin Model
A vision-integrated digital twin does not replace the existing sensor and process data layers. It stacks five additional visual data layers on top, each providing information that no other data source can deliver. The visualization below shows how these layers build from raw image capture up to predictive lifecycle intelligence.
LAYER 5
Predictive Lifecycle Projection
Degradation trends projected forward to estimate remaining useful life and optimize replacement scheduling based on measured visual deterioration rates
LAYER 4
Temporal Condition History
Time-stamped sequence of condition scores and associated images showing exactly how the asset's visual state evolved over weeks, months, and years
LAYER 3
Anomaly and Defect Classification
AI-identified defect types, severity levels, and spatial locations mapped to specific zones on the digital twin geometry for each monitored asset
LAYER 2
Quantified Condition Measurements
Numerical degradation scores including corrosion area percentage, crack length in millimeters, wear depth, and surface quality indices extracted from each image
LAYER 1
Raw Visual Capture Stream
Time-stamped high-resolution images from fixed camera positions at each monitored asset, stored as the foundational visual record in the twin's data architecture
LIFECYCLE STAGES
Where Vision Data Changes Decisions at Every Stage of Asset Life
Each stage in an asset's operational lifecycle generates visual information that influences different decisions and different stakeholders. The cards below map the specific vision data captured at each stage to the decisions that data enables.
Vision Data Captured: Baseline condition images of every monitored surface, component, and connection point at the moment the asset enters service
Decisions Enabled: Verified-as-built visual record for warranty claims, insurance documentation, and future degradation comparison with a known-good starting point
Vision Data Captured: Periodic condition images at defined intervals tracking surface state, environmental exposure effects, and any early deviation from the commissioning baseline
Decisions Enabled: Condition-based maintenance scheduling that replaces calendar-based intervals with evidence of actual degradation progression for each individual asset
Vision Data Captured: AI-flagged anomalies with classified defect type, measured severity, spatial location on the asset, and timestamped image evidence for each detected issue
Decisions Enabled: Prioritized maintenance work order generation with visual evidence attached, allowing planners to assess urgency and stage parts without a physical walk-down
Vision Data Captured: Pre-repair condition images showing the failure state, and post-repair images documenting the as-repaired condition for quality verification
Decisions Enabled: Repair quality verification without re-inspection visits, contractor accountability through visual before-and-after records, and updated baseline for resumed monitoring
Vision Data Captured: Complete visual lifecycle archive from commissioning through final condition, forming the empirical basis for replacement specification and vendor evaluation
Decisions Enabled: Data-driven replacement procurement based on how the previous asset actually degraded, not just its rated specifications or the vendor's claimed service life
A Digital Twin Without Visual Data Is a Simulation — With Vision It Becomes a Mirror
iFactory's AI vision platform captures condition images, measures degradation, classifies defects, and feeds every data point into your digital twin with timestamps and asset mapping so your team sees the real physical state of every monitored asset. Book a demo to see vision data flowing into a digital twin for your equipment.
DATA PIPELINE
From Camera Capture to Digital Twin Update in Four Processing Steps
Every image captured by a vision camera on the plant floor passes through a four-step pipeline before it becomes a structured data point inside the digital twin. This pipeline runs automatically at each scheduled capture interval with no manual intervention required.
01
Image Acquisition and Timestamping
Fixed cameras capture images at the defined interval for each asset. Every image is tagged with asset ID, camera position, capture timestamp, and ambient condition metadata from any available environmental sensors.
02
AI Analysis and Feature Extraction
The image is processed by the trained AI model to identify any degradation or defect conditions present. Detected issues are classified by type, measured for severity, and spatially located within the image frame.
03
Condition Score Calculation
Measurements from the AI analysis are converted into a standardized condition score for the asset, weighted by the criticality of each detected issue and compared against the previous score to calculate the degradation rate.
04
Twin Data Model Update
The condition score, classified defects, measured degradation values, and the original image are written to the digital twin's asset data model through its API, updating the visual state of that asset in the twin immediately.
QUERY CAPABILITY
What Your Team Can Ask the Twin When Vision History Lives Inside It
Once visual condition data is integrated into the twin, your maintenance planners, reliability engineers, and operations managers can query the actual physical history of any asset instead of relying on paper records or periodic inspection notes. Each query below shows the question, what the twin returns, and who uses the answer.
Show me the corrosion progression on vessel V-402 over the last 12 months
Time-stamped image sequence with measured corrosion area at each capture point, degradation rate curve, and projected month when the corrosion will reach the replacement threshold
Used by: Reliability Engineer
Which assets in zone B have active visual defects flagged in the last 30 days?
Filtered list of all zone B assets with open AI-flagged defects, ranked by severity, with clickable defect images and condition scores for each asset
Used by: Maintenance Planner
What did conveyor C-17 look like before and after the belt replacement in March?
Side-by-side pre-repair and post-repair images from the twin's maintenance event record, with the condition score delta showing the improvement achieved
Used by: Maintenance Manager
Compare the actual degradation rate of pump P-205 against the vendor's claimed service life
Overlay of the measured visual degradation trend against the vendor's published degradation curve, with deviation analysis showing whether the asset is degrading faster or slower than expected
Used by: Procurement Engineer
Give me the complete visual history of asset HE-101 from commissioning to today
Chronological image gallery from initial commissioning baseline through every scheduled capture and maintenance event, with condition score timeline and all AI-detected anomalies annotated
Used by: Plant Engineer
Which seal types in our rotating equipment fleet show the fastest visual deterioration rate?
Comparative degradation rate analysis across all monitored seals grouped by seal type and manufacturer, identifying which specification or supplier delivers the longest visual service life
Used by: Reliability Engineer
COMPARISON
Static Digital Twin vs Vision-Integrated Digital Twin — Capability Comparison
The table below compares what a standard sensor-fed digital twin can deliver against what becomes possible when AI vision data is integrated as an additional data layer within the same twin architecture.
BUSINESS IMPACT
Measured Outcomes From Vision-Integrated Digital Twin Deployments
These figures reflect measured results from manufacturing facilities where iFactory's AI vision platform has been integrated with existing digital twin infrastructure, each tracked over a minimum six-month period following full deployment.
58%
Reduction
Time to Assess Asset Condition for Maintenance Planning
Planners query the twin instead of scheduling physical walk-downs, cutting the average condition assessment time from hours of floor time to minutes of digital review with visual evidence.
41%
Improvement
Accuracy of Remaining Useful Life Estimates
Visual degradation rates combined with sensor models produce remaining life estimates that match actual asset service life within 12 percent on average, compared to 20 percent for sensor-only models.
29%
Reduction
Unnecessary Preventive Maintenance Tasks
When planners can see actual visual condition in the twin, they defer or cancel nearly a third of calendar-based maintenance tasks that the visual evidence shows are not yet needed.
$510K
Annual Savings
Per Facility With 80+ Monitored Twin Assets
Combined savings from reduced physical inspections, avoided unplanned failures, deferred unnecessary maintenance, and improved replacement procurement decisions across the monitored asset fleet.
FREQUENTLY ASKED QUESTIONS
Questions From Digital Twin and Reliability Teams About Vision Integration
Do we need to rebuild our existing digital twin to integrate AI vision data from iFactory?
No. iFactory's platform pushes structured vision data to your existing twin through standard APIs and data connectors, adding visual data layers to the asset models you already have without requiring any changes to the twin's core architecture or the sensor data streams already connected to it. The integration is additive, not disruptive.
Contact our support team to discuss integration with your specific twin platform.
How much image storage does a vision-integrated twin require, and where does it live?
Storage requirements depend on the number of monitored assets and capture frequency, but a typical facility with 50 assets captured daily generates approximately 50 to 100 gigabytes per year of compressed image data. iFactory can store images in its own cloud infrastructure with the twin holding only the structured condition scores and defect metadata, or images can be stored on-premise if your data residency requirements mandate it.
Book a demo to get a storage estimate for your asset count and capture schedule.
Which digital twin platforms does iFactory integrate with out of the box?
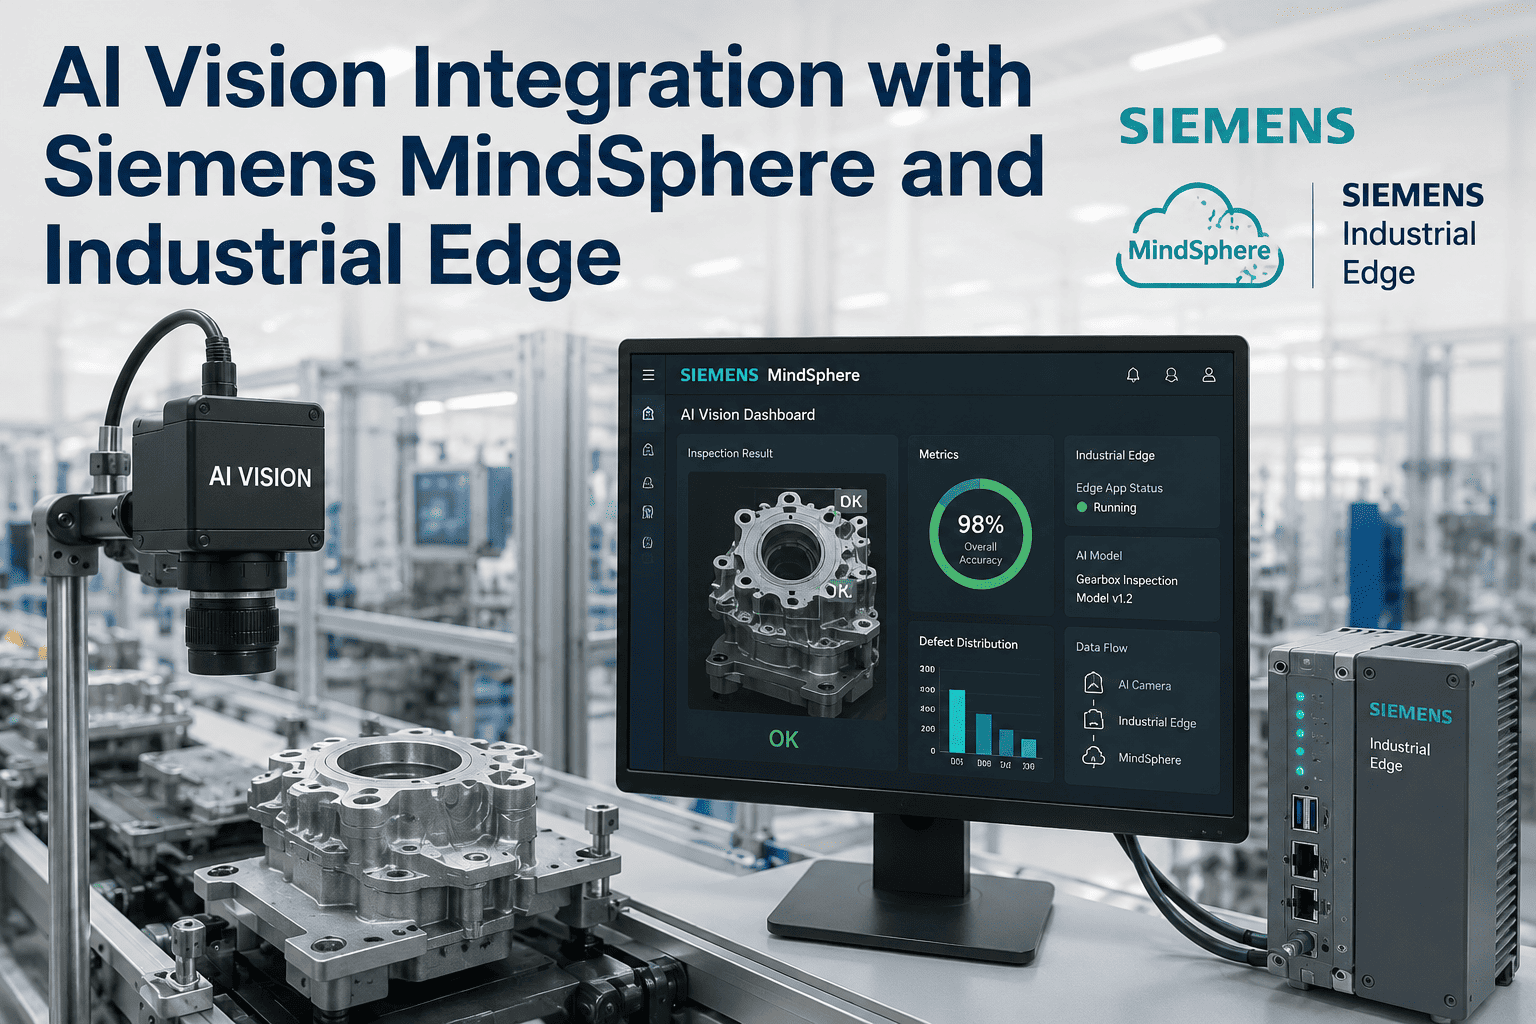
iFactory provides pre-built connectors for the major industrial digital twin platforms including Siemens MindSphere, GE Predix, Azure Digital Twins, AWS IoT TwinMaker, and PTC ThingWorx. For platforms not on that list, the integration uses a standard REST API that your twin development team can connect to within a few days using the documented schema.
Contact our support team to confirm connector availability for your platform.
Can operators view the visual condition data in the twin without leaving their existing dashboard?
Yes. Once the vision data is written to the twin's data model, it becomes accessible through whatever visualization layer your twin already uses, whether that is a custom web dashboard, a HMI screen, or a commercial twin visualization tool. Operators click on an asset in their existing interface and see the current condition score, recent defect images, and degradation trend without opening a separate application.
Book a demo to see vision data rendered in a twin visualization.
How does visual data in the twin support regulatory audits and insurance inspections?
The twin maintains a continuous, timestamped visual record of every monitored asset that serves as auditable evidence of asset condition at any specific date and time. When an auditor or insurance inspector requests evidence that equipment has been maintained in safe condition, your team can query the twin for the complete visual history of that asset and export a condition report with images, scores, and maintenance events without assembling paper files or scheduling a physical re-inspection.
Contact our support team to discuss compliance reporting for your regulatory requirements.
Your Digital Twin Has the Geometry and the Sensor Data — Add the Eyes
iFactory's AI vision platform captures, analyzes, and structures visual condition data from cameras on your plant floor and feeds it directly into your digital twin through standard APIs, giving every asset a living visual history that your entire team can query. Book a demo to see vision data flowing into a twin for your equipment.