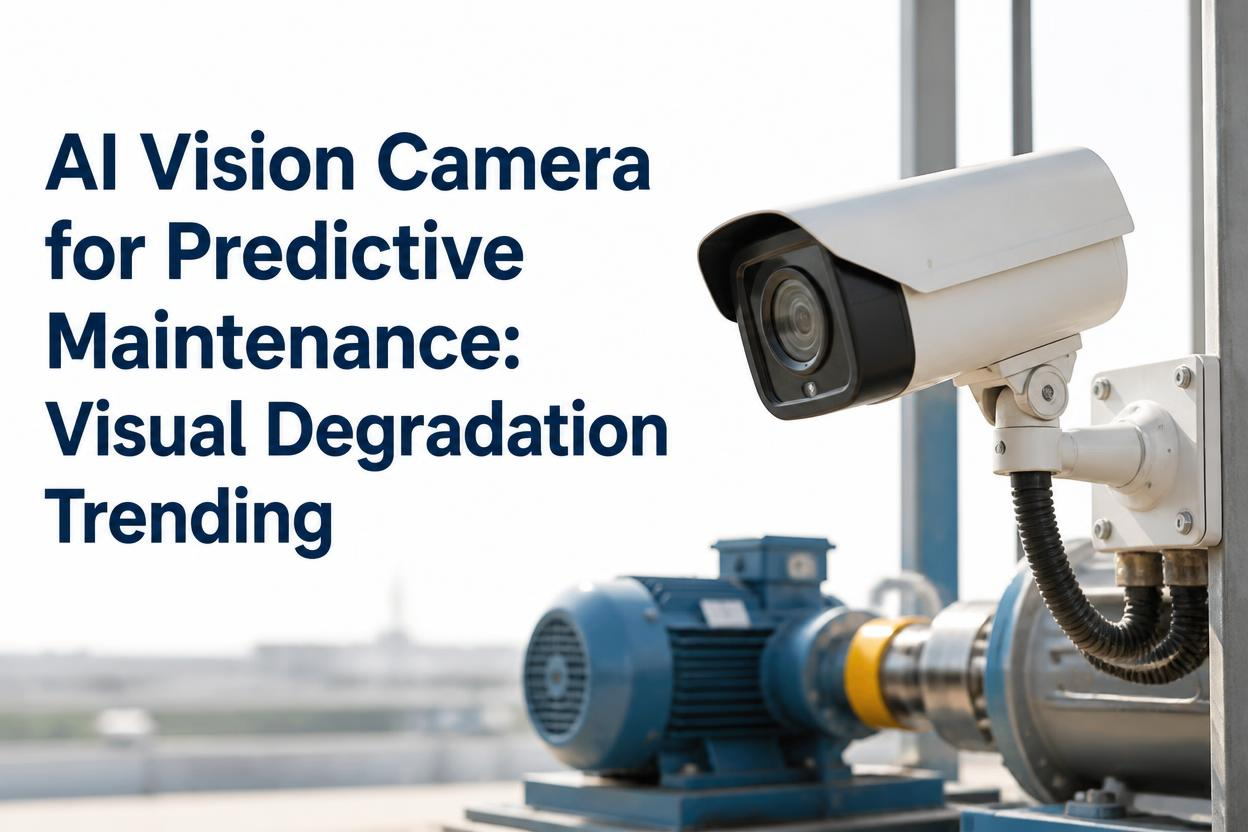
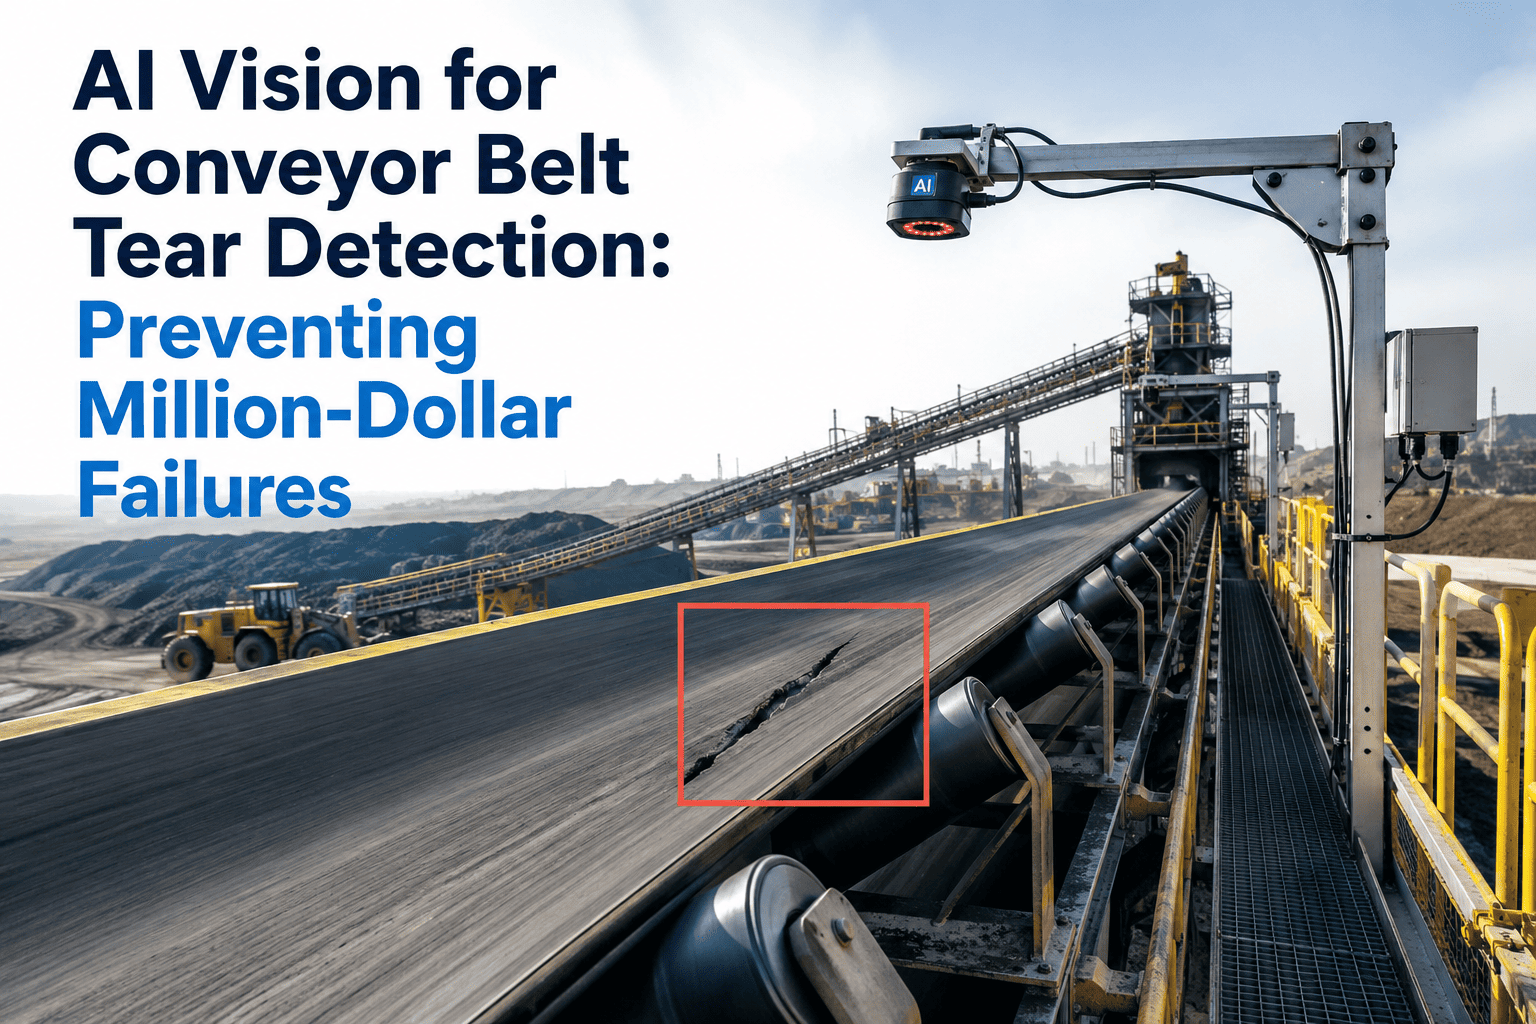
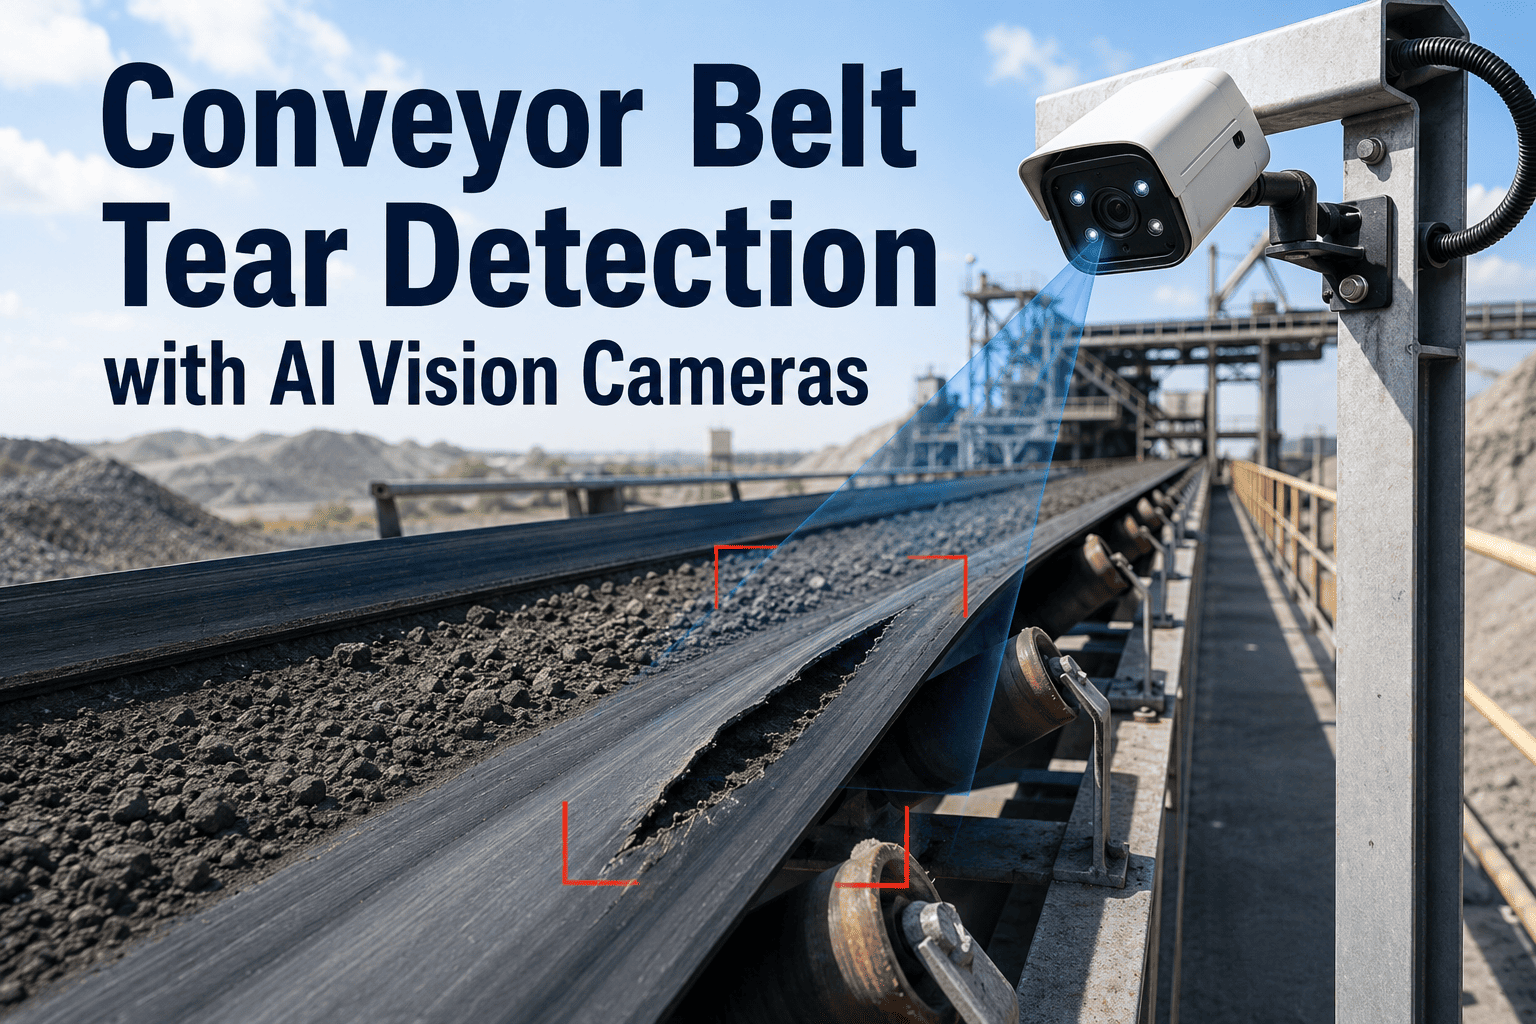
Most predictive maintenance programs rely on vibration sensors, temperature probes, and oil analysis to detect equipment degradation, but a significant category of failure modes produces visible physical changes long before they trigger a vibration alarm. Corrosion spreads across a steel frame for months before structural integrity is compromised, conveyor belts develop fraying edges weeks before a splice fails, and bearing housings show discoloration from overheating days before the bearing seizes. These visual degradation signals are visible to a camera but invisible to the sensor systems that most plants depend on for early warning. iFactory's AI vision platform captures images at regular intervals from fixed camera positions and tracks pixel-level changes over time, converting visual deterioration into a quantified degradation trend with a predicted time-to-failure estimate. You can book a demo to see how your equipment degradation would look as a tracked trend line.
PREDICTIVE MAINTENANCE · VISUAL AI · DEGRADATION TRENDING · EQUIPMENT HEALTH
Your Equipment Is Showing Exactly How It Will Fail — Cameras Can See It Weeks Before Sensors Notice
iFactory positions fixed cameras on critical assets, captures visual condition data at scheduled intervals, and uses AI to track degradation progression from first visible sign to predicted failure point.
Typical corrosion progression timeline tracked by AI vision from first detectable change to structural failure
THE HIDDEN COST
Sensor-Based Maintenance Misses the Degradation It Cannot Touch
Vibration, temperature, and current sensors are effective at detecting mechanical degradation modes like imbalance, misalignment, and bearing wear. But a large share of equipment failures originate from surface-level physical changes that produce no measurable vibration or temperature shift until the damage is already advanced.
82%
Of Equipment Failures Show Visible Signs First
Research across process and discrete manufacturing shows that over four-fifths of mechanical and structural failures exhibit visible surface changes like corrosion, cracking, wear, or discoloration before any sensor threshold is triggered.
3-6 Weeks
Average Visual Lead Time Over Vibration Sensors
Visual degradation indicators like corrosion spread, seal deterioration, and surface cracking become detectable by AI three to six weeks before the same degradation produces a measurable vibration or temperature anomaly.
$260K
Average Unplanned Downtime Cost Per Incident
When a visually detectable failure mode like belt splice separation or structural cracking reaches the point of sudden failure, the resulting unplanned shutdown costs an average of a quarter million dollars per incident across heavy manufacturing.
47%
Of Maintenance Budget Wasted on Fixed Schedules
Plants running purely on time-based preventive maintenance replace components that still have significant remaining life while missing components that are degrading faster than the schedule assumes.
DEGRADATION PATTERNS
Six Physical Degradation Modes That AI Vision Tracks Continuously
Each degradation mode below produces a distinct visual signature that iFactory's AI learns to identify, measure, and trend over time. The severity scale shows how each mode progresses from detectable to critical.
S1: Surface Discoloration
AI measures the percentage of surface area affected by corrosion at each image capture, calculates the spread rate in square centimeters per week, and projects when section loss will reach structural thresholds defined by your engineering standards.
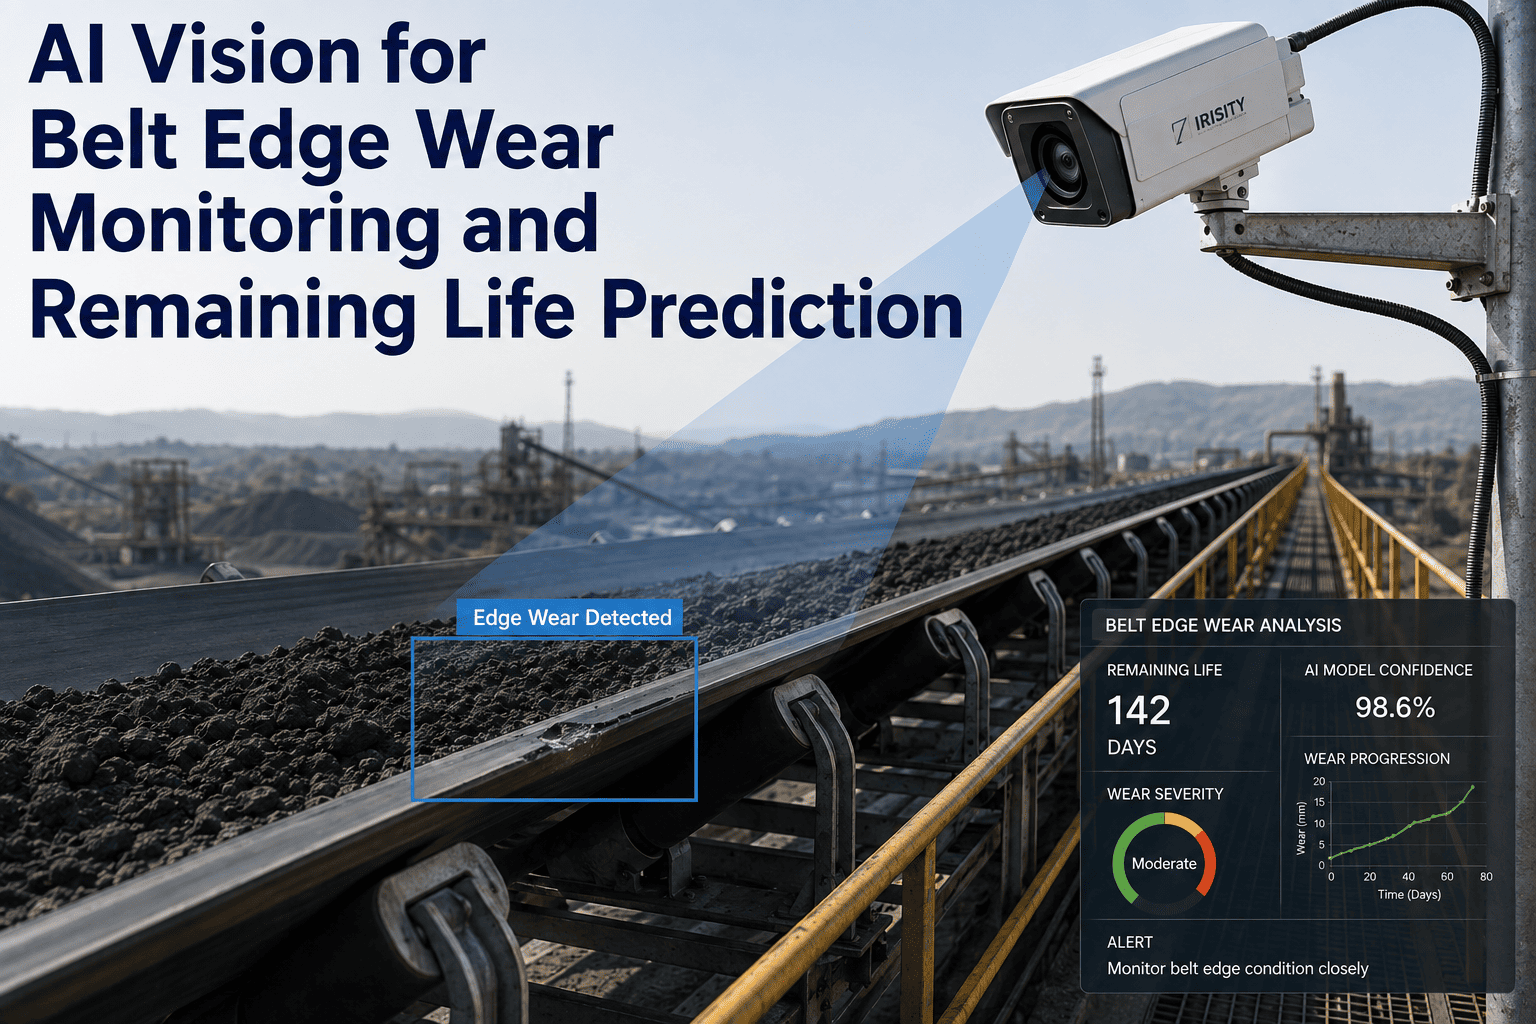
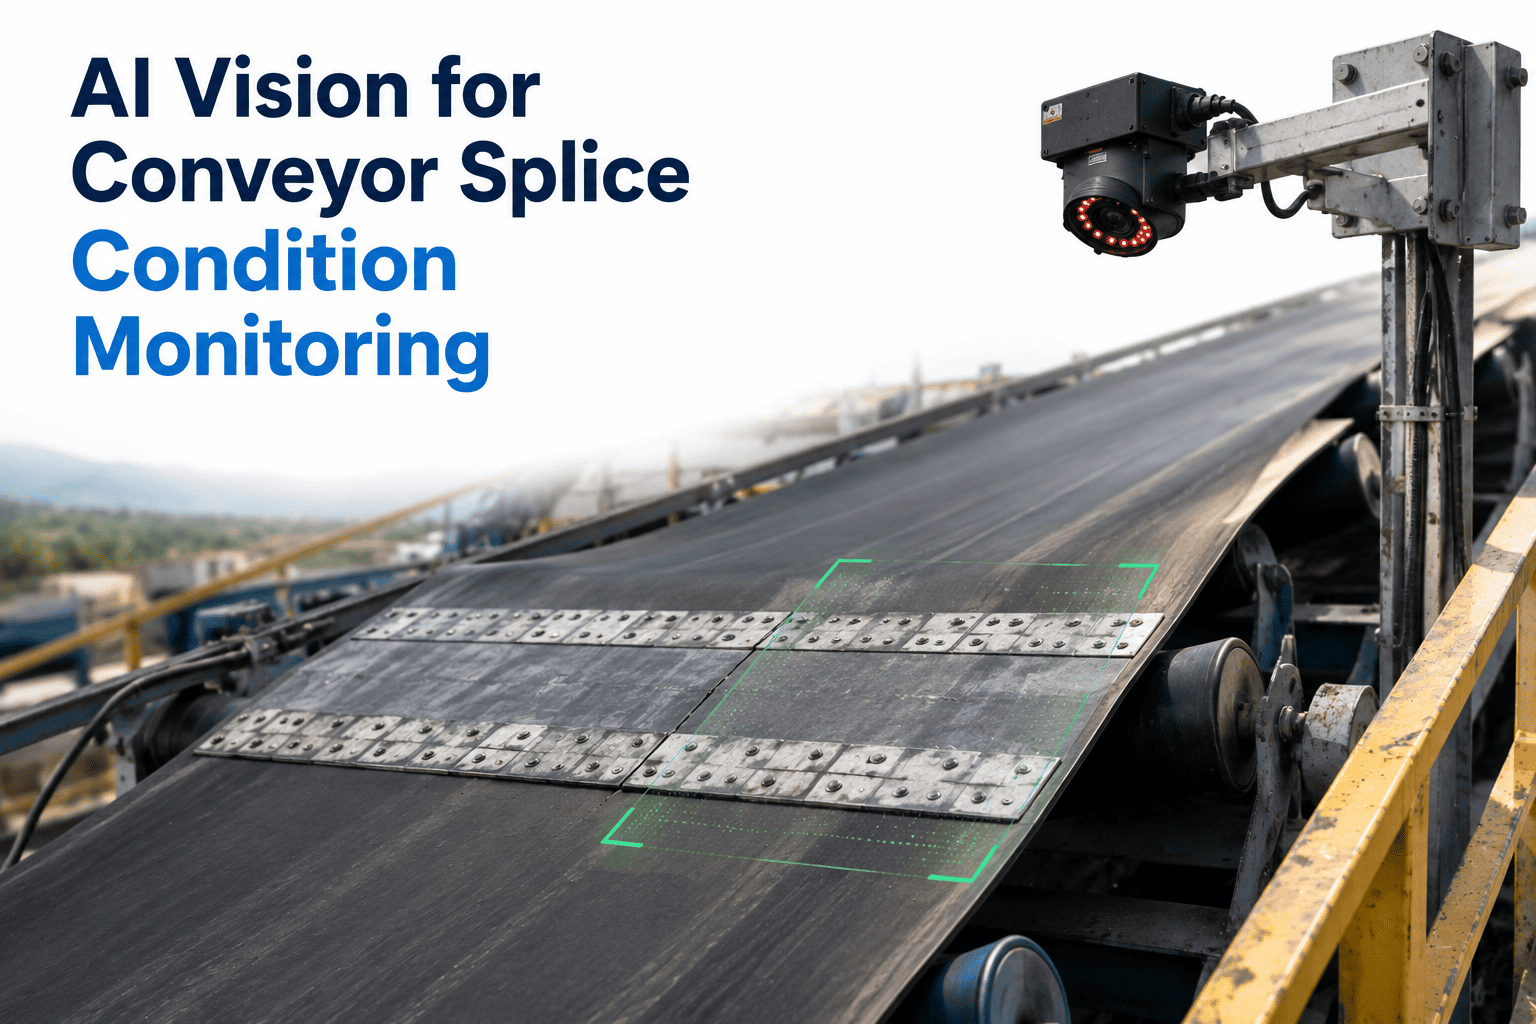
Fixed cameras monitor belt edges and splice areas at regular intervals, measuring fraying length, crack density, and splice condition to predict remaining belt life and schedule replacement before an in-line breakage occurs.
Thermal discoloration on bearing housings indicates lubrication breakdown or overload conditions. AI tracks color shift intensity and area growth to estimate internal bearing temperature trends from external visual evidence alone.
Cameras positioned on flanged connections and seal housings detect surface cracking, compression set, and material extrusion that precedes leaks by days or weeks, enabling seal replacement during a planned window.
AI measures crack length, width, and branching pattern at each inspection interval to calculate propagation rate. When the rate accelerates or approaches critical length thresholds, the system escalates to an immediate maintenance alert.
Protective coating failure exposes underlying metal to corrosive environments. AI tracks the percentage of coated surface that has progressed past each stage, triggering recoating schedules before substrate corrosion begins.
TREND VISUALIZATION
How AI Converts Captured Images Into a Degradation Trend Line
The platform processes each captured image through a measurement pipeline that extracts a numerical degradation score, plots it over time, and fits a projection curve to estimate when the failure threshold will be reached. The visual below shows how a corrosion trend develops from the AI's perspective.
Monthly Image Capture Intervals
Measured Degradation Score
MAINTENANCE STRATEGIES
Reactive vs Time-Based vs AI Visual Predictive — What Each Strategy Actually Delivers
Maintenance strategy determines whether you are constantly fighting fires, replacing parts too early, or targeting exactly the right moment to intervene. The table below compares the three approaches across the operational metrics that drive maintenance cost and asset reliability.
Every Piece of Equipment Degrades Visibly Before It Fails — AI Watches So Your Team Does Not Have To
iFactory's visual predictive maintenance platform positions cameras on your critical assets, measures degradation at each capture interval, and delivers a trending score with a predicted failure date so your maintenance team can plan interventions instead of reacting to emergencies. Book a demo to see degradation trending on your equipment.
EQUIPMENT COVERAGE
Which Plant Assets Benefit Most From Visual Degradation Tracking
Not every asset is a strong candidate for vision-based predictive maintenance. The assets below are selected based on two criteria: they exhibit visible degradation before failure, and the consequence of unplanned failure is high enough to justify the monitoring investment.
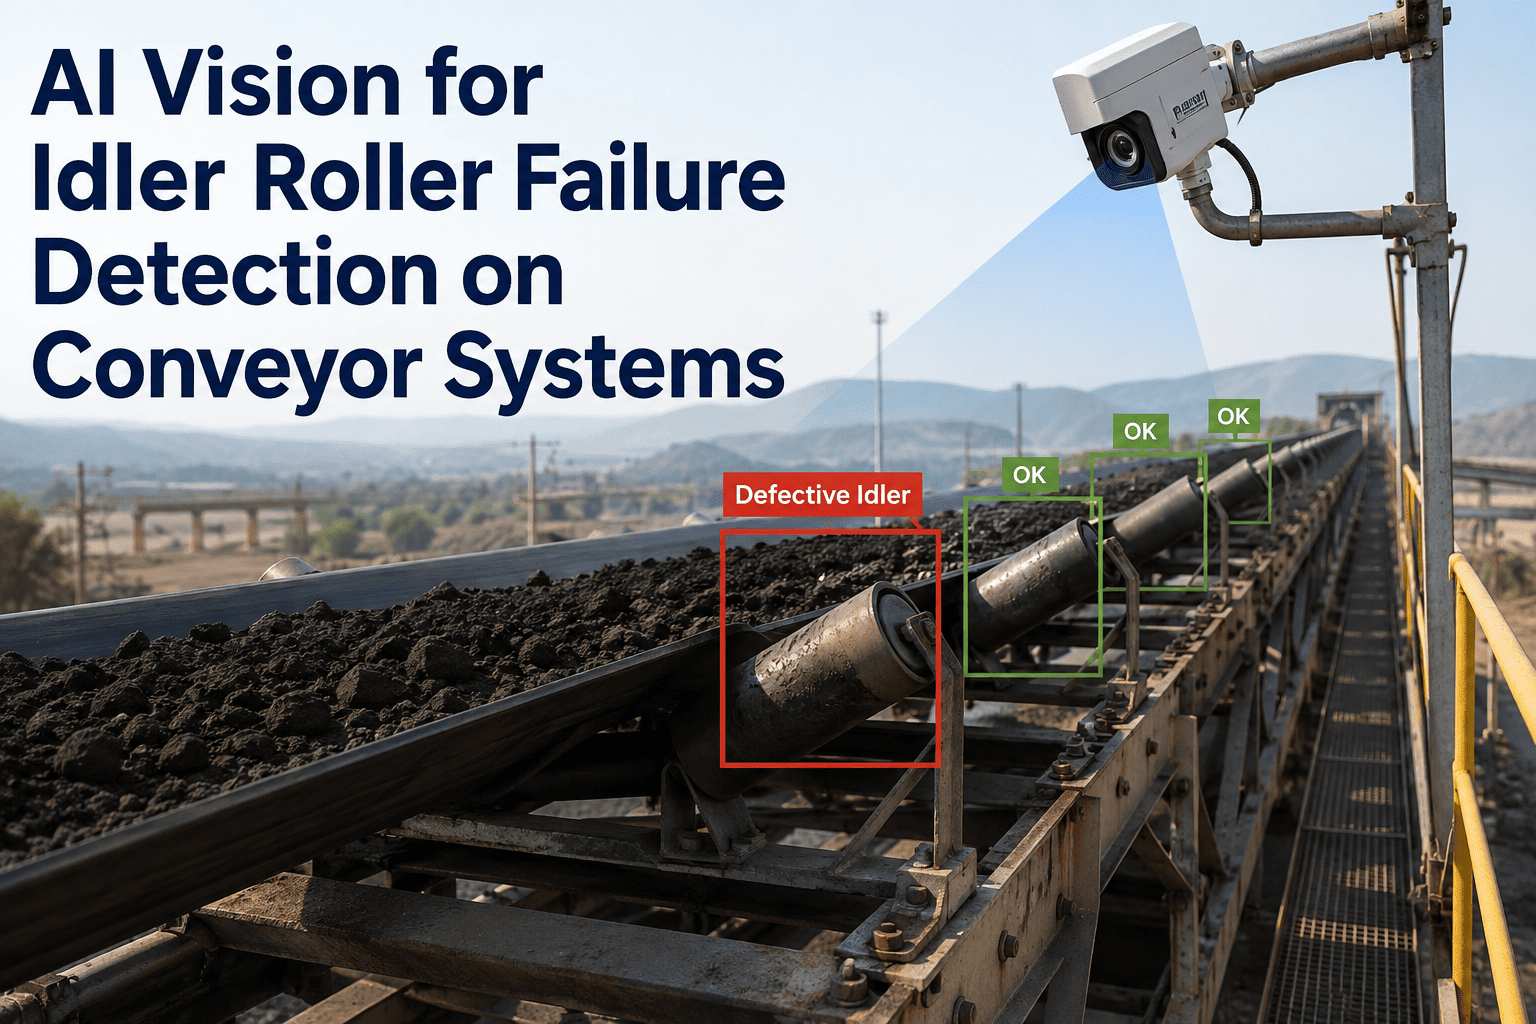
Tracked: Belt edge wear, splice condition, roller coating loss, idler frame corrosion
Failure Impact: Line stoppage, product spillage, secondary equipment damage
Capture Interval: Every 4 hours
HIGH
Steel Structures and Platforms
Tracked: Corrosion area percentage, paint flaking, weld crack length, bolt condition
Failure Impact: Structural failure risk, safety incident potential, regulatory non-compliance
Capture Interval: Daily
HIGH
Pumps and Rotating Equipment
Tracked: Seal deterioration, housing discoloration, baseplate corrosion, coupling wear
Failure Impact: Process interruption, leakage environmental risk, cascading damage to drive system
Capture Interval: Every 8 hours
MEDIUM
Piping and Valve Assemblies
Tracked: External corrosion, insulation damage, valve packing leakage, flange condition
Failure Impact: Process fluid loss, environmental release, shutdown for isolation and repair
Capture Interval: Daily
MEDIUM
Electrical Enclosures and Panels
Tracked: Enclosure corrosion, gasket degradation, vent filter condition, condensation evidence
Failure Impact: Moisture ingress, short circuit risk, arc flash hazard, unplanned electrical outage
Capture Interval: Every 12 hours
MEDIUM
Heat Exchangers and Vessels
Tracked: External corrosion mapping, insulation integrity, shell discoloration, flange leakage stains
Failure Impact: Process efficiency loss, containment breach risk, extended shutdown for vessel repair
Capture Interval: Daily
MEASURED OUTCOMES
Results From Visual Predictive Maintenance Deployments Across Manufacturing Sites
The figures below reflect measured outcomes from iFactory's visual predictive maintenance deployments, each tracked over a minimum six-month period following full deployment on the monitored asset fleet.
73%
Reduction
Unplanned Downtime on Monitored Assets
Failures that were previously unpredictable on visually monitored equipment dropped by nearly three-quarters after AI trending was deployed and integrated with the maintenance scheduling system.
34%
Increase
Average Component Life Utilization
Maintenance teams stopped replacing components on fixed schedules and instead waited for AI-detected degradation signals, extracting over a third more usable life from belts, seals, and coated surfaces.
4.2 Weeks
Average Lead Time
Visual Detection Before Sensor Alarm
On assets monitored by both vibration sensors and AI vision, the visual system detected degradation an average of four weeks before the same condition triggered a vibration or temperature alert.
$420K
Annual Savings
Per Facility With 50+ Monitored Assets
Combined savings from avoided unplanned downtime, reduced component waste, and lower emergency maintenance labor costs for mid-size facilities monitoring fifty or more asset positions.
DEPLOYMENT PATH
From First Camera Mount to Fully Automated Degradation Trending
iFactory's deployment for visual predictive maintenance follows a four-stage path designed so that the first degradation trend is visible within the first three weeks of camera installation.
01
Asset Prioritization and Camera Placement
Critical assets are ranked by failure consequence and visual degradation susceptibility. Camera positions are selected to capture the degradation-prone zones identified in the assessment, with lighting and mounting specifications defined for each position.
02
Baseline Image Capture and AI Calibration
Initial images are captured across all monitored positions to establish a clean baseline. The AI model is calibrated to the specific visual characteristics of each asset, including material type, surface finish, and lighting conditions unique to each camera position.
03
Scheduled Capture and Trend Initialization
Automated image capture begins at the defined interval for each asset. The AI starts measuring and logging degradation scores, building the initial trend data points that will form the basis for projection and threshold alerting.
04
Alert Integration and Maintenance Scheduling
Degradation trend alerts are integrated with the plant's CMMS so that predicted maintenance windows automatically generate work orders with the relevant degradation images, trend history, and severity classification attached.
FREQUENTLY ASKED QUESTIONS
Questions From Maintenance and Reliability Engineers About Visual Predictive Maintenance
How is visual predictive maintenance different from simply putting a camera on a machine and having someone look at the images periodically?
A human reviewing images periodically cannot detect the subtle pixel-level changes that indicate early-stage degradation, and even if they could, they cannot quantify the rate of change or project a future failure date. iFactory's AI measures the exact percentage of surface affected, tracks that measurement at every capture interval, fits a progression curve, and compares the projected trajectory against a defined failure threshold to produce a predicted time-to-failure. This converts a subjective visual impression into a repeatable, quantified maintenance decision.
Book a demo to see the difference between manual review and AI trending on the same image sequence.
What happens if lighting conditions change between captures — does that corrupt the degradation trend?
Lighting variation is one of the primary challenges in visual monitoring, and iFactory addresses it through a combination of controlled lighting recommendations at each camera position and AI-based normalization that separates genuine surface changes from illumination changes. The platform flags captures where lighting conditions deviate significantly from the established baseline so that those data points can be excluded from the trend rather than creating a false degradation signal.
Contact our support team to discuss lighting requirements for your specific asset positions.
How many cameras do we need, and what type of cameras are required for this application?
The number of cameras depends on how many asset positions you want to monitor and the physical layout of each position. Most degradation modes require a single camera per monitored zone, with the camera positioned to capture the surface area where degradation is expected to appear. iFactory works with standard industrial cameras including GigE Vision and USB3 models from major manufacturers, and can recommend specific camera and lens combinations during the asset prioritization stage based on the distance, field of view, and resolution requirements of each position.
Book a demo to get a camera count and specification estimate for your facility.
Can this system integrate with our existing CMMS like SAP PM, Maximo, or Fiix?
Yes. iFactory's platform generates structured maintenance alerts with asset ID, degradation severity, trend history, and predicted failure date that map directly to the work order fields in all major CMMS platforms. The integration can be configured to automatically create work orders when degradation crosses a defined threshold, or to feed trend data into a maintenance dashboard that your planners review as part of their weekly scheduling process.
Contact our support team to discuss integration with your specific CMMS platform.
How long does it take before the AI has enough data to generate a reliable degradation projection?
The AI begins generating degradation scores from the very first capture after baseline calibration, but reliable projections typically require four to six data points, which translates to two to six weeks depending on the capture interval assigned to each asset. For assets with daily capture, a preliminary projection is available within the first week. For assets captured every eight hours, the projection timeline is even shorter. The platform clearly distinguishes between measured data points and projected estimates so your team knows exactly how much confidence to place in each forecast.
Book a demo to see how quickly trending becomes available for your specific capture intervals.
Your Equipment Is Degrading Right Now and a Camera Is the Cheapest Sensor You Can Put on It
iFactory's visual predictive maintenance platform turns standard industrial cameras into degradation tracking sensors that measure corrosion spread, belt wear, seal deterioration, and structural cracking on a scheduled basis with AI-powered trend projection and CMMS integration. Book a demo to see your critical assets as degradation trend lines.