Measuring how long each station, machine, or process step actually takes — and where time is silently lost — has traditionally relied on manual time studies, stopwatch audits, or PLC signals that only capture a fraction of what happens on the floor. AI vision production line cycle-time analysis changes this by using cameras already mounted above the line to continuously watch every station, automatically timing each cycle, and flagging the moment a process step runs slower than it should. In 2026, as manufacturers face tighter margins and rising pressure to hit OEE targets without adding headcount or capital equipment, this visual layer of cycle-time intelligence is becoming the fastest way to find hidden capacity. iFactory's AI-driven EAM platform brings this capability directly into existing camera infrastructure through its Vision Process Analytics feature, turning raw video into structured cycle-time, bottleneck, and micro-stop data without disrupting the line. Operations and continuous improvement teams evaluating vision-based line monitoring are encouraged to Book a Demo with iFactory to get a turnkey AI vision quote scoped to your specific line.
See Exactly Where Your Line Loses Time — Station by Station
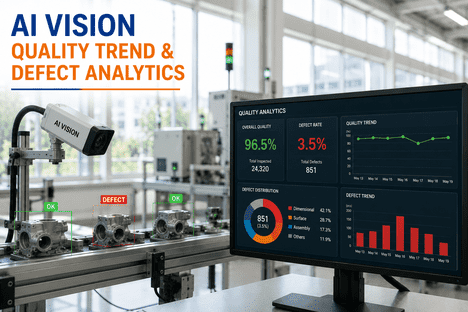
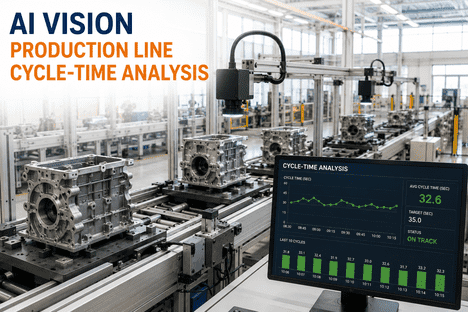
iFactory's Vision Process Analytics feature measures cycle times, detects bottlenecks, and quantifies micro-stops automatically from camera feeds, giving you the data to lift OEE and throughput.
Why Manual Time Studies and PLC Signals Alone Miss the Full Picture
Most plants still rely on periodic manual time studies or PLC-reported cycle times to understand how a line is performing. Both methods leave significant blind spots. A manual study captures a snapshot of a few cycles on a single shift and cannot account for variation across operators, products, or hours of the day. PLC signals report when a machine starts and stops, but they rarely capture the seconds lost to a part being reached for awkwardly, a fixture being adjusted, or work-in-process quietly piling up at a downstream station. These small, frequent interruptions — often called micro-stops — typically occur dozens to hundreds of times per shift and last only seconds to two minutes each, yet they accumulate into hours of lost capacity that conventional downtime tracking never records. AI vision closes this gap by watching the actual physical process continuously, timing every cycle from the same camera feed already covering the line, and surfacing the slow seconds that traditional methods were never built to see.
Every Cycle, Every Shift
Vision-based timing captures every single cycle across every shift rather than a sampled snapshot, replacing periodic manual time studies with a complete, continuous record.
Micro-Stop Visibility
Short stoppages lasting seconds to two minutes are detected and timestamped individually, exposing the high-frequency interruptions that conventional downtime logs typically miss entirely.
Bottleneck Localization
By comparing cycle times across stations in real time, the system identifies exactly which station is constraining the line and whether it is failing, starved, or blocked.
No New Hardware
Cycle-time analysis runs on existing camera infrastructure already installed above the line, avoiding the cost and disruption of retrofitting new sensors at every station.
How iFactory's Vision Process Analytics Builds the Cycle-Time Picture
Turning raw camera footage into usable cycle-time intelligence requires more than recording video — it requires a structured pipeline that detects process events, classifies stoppages, and connects findings back into the systems that act on them. The following framework outlines how iFactory's Vision Process Analytics feature builds and applies cycle-time data across a production line. Book a Demo to see how this maps onto your own line layout.
| Analytics Component | Description | How It Works | Operational Value |
|---|---|---|---|
| Station-Level Cycle Timing | Continuous measurement of how long each station takes to complete one cycle | Camera detects part entry and exit events at each defined station zone | Establishes an accurate baseline cycle time per station, per shift |
| Micro-Stop Detection | Identification of short, frequent interruptions that disrupt steady-state flow | Flags gaps between expected and actual cycle completion below a defined threshold | Surfaces the hidden seconds-per-cycle losses that add up to hours per shift |
| Bottleneck Identification | Comparison of cycle times across all stations to find the constraining step | Aggregates station timings and ranks which station is starved, blocked, or failed | Directs improvement effort to the one station that limits total line output |
| Throughput & Line Balancing | Analysis of how evenly work is distributed across stations | Compares relative cycle times to recommend rebalancing or resequencing | Improves overall throughput without adding labor or equipment |
| OEE Performance Feed | Cycle-time and stoppage data feeding the Performance component of OEE | Actual cycle time is compared against ideal cycle time continuously | Gives a real-time, evidence-based view of speed losses driving OEE |
How iFactory's AI Vision Camera Powers Cycle-Time and Bottleneck Analysis
Cycle-time analysis only delivers value when detection is fast enough to keep up with the line and accurate enough to be trusted by operations teams. iFactory's AI Vision Camera processes video on-premise with sub-50ms inference, so station entry and exit events are timestamped in near real time rather than discovered hours later in an end-of-shift report. As soon as a station's cycle time drifts outside its normal range or a micro-stop pattern repeats, the system raises an alert and can automatically generate a work order with the annotated clip attached, giving the responding technician visual evidence of exactly where and why the line slowed down. This closes the loop between seeing a problem and acting on it, replacing the guesswork of "which machine is holding back the line today" with a continuously updated, camera-verified answer. Most teams start with a focused pilot on one bottleneck line before expanding coverage. Reach out for a Book a Demo session to get a turnkey AI vision quote for your facility.
AI Vision Cycle-Time Analysis — Frequently Asked Questions
What is AI vision cycle-time analysis?
AI vision cycle-time analysis uses camera feeds and computer vision models to automatically measure how long each station or process step takes, detect deviations from the expected cycle time, and identify which station is constraining overall line output.
What are micro-stops and why are they hard to detect?
Micro-stops are short interruptions, typically lasting seconds to about two minutes, caused by minor jams, adjustments, or reach delays. They are hard to detect with manual logging because they happen too frequently and briefly to record consistently, yet they accumulate into significant lost capacity.
How does AI vision identify a bottleneck on a production line?
The system compares cycle times across every station in real time and determines which station is the limiting factor — distinguishing between a station that has actually failed versus one that is simply starved of upstream parts or blocked by downstream congestion.
Does iFactory's Vision Process Analytics require new cameras or sensors?
In most cases no — iFactory connects to existing IP cameras already covering the production line, applying detection and timing models on top of that footage rather than requiring new hardware at every station.
How does cycle-time data improve OEE?
Cycle-time and micro-stop data feeds directly into the Performance component of OEE by comparing actual cycle time against ideal cycle time, giving teams the evidence needed to address speed losses that traditional downtime tracking does not capture.
Turn Your Camera Feeds Into a Continuous Cycle-Time and Bottleneck Map
iFactory's Vision Process Analytics feature measures cycle times, detects bottlenecks, and quantifies micro-stops automatically — giving operations teams the visibility to lift OEE and throughput without new capital equipment.