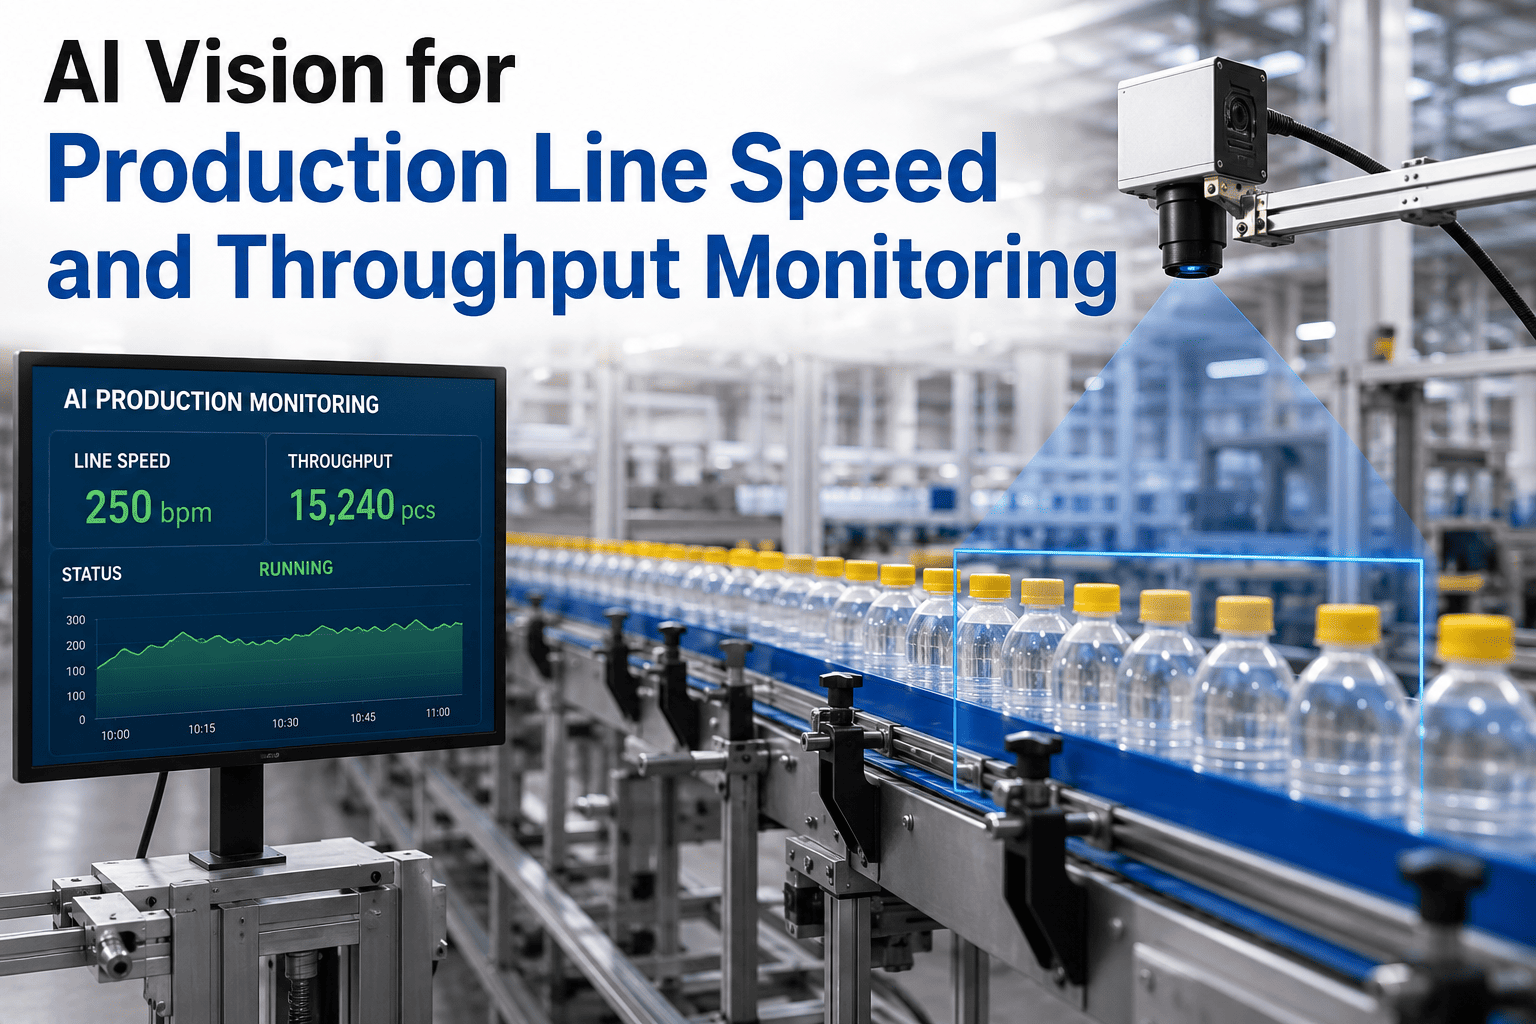
Production line speed and throughput are the two numbers that determine whether a manufacturing shift was profitable or not. Most plants still rely on shift supervisors manually counting output or reading estimates from SCADA displays that were configured months ago and never validated against actual units leaving the line. The gap between what operators think they produced and what actually shipped is almost always larger than anyone admits. AI vision systems close that gap by watching the line with industrial cameras, counting every unit, and calculating real speed and throughput without touching PLC logic. Talk to iFactory support about what vision monitoring looks like on your line.
AI Vision · Production Monitoring · Throughput Analytics
AI Vision for Production Line Speed and Throughput Monitoring: Count Every Unit, Measure Real Speed, Calculate OEE Without PLC Changes
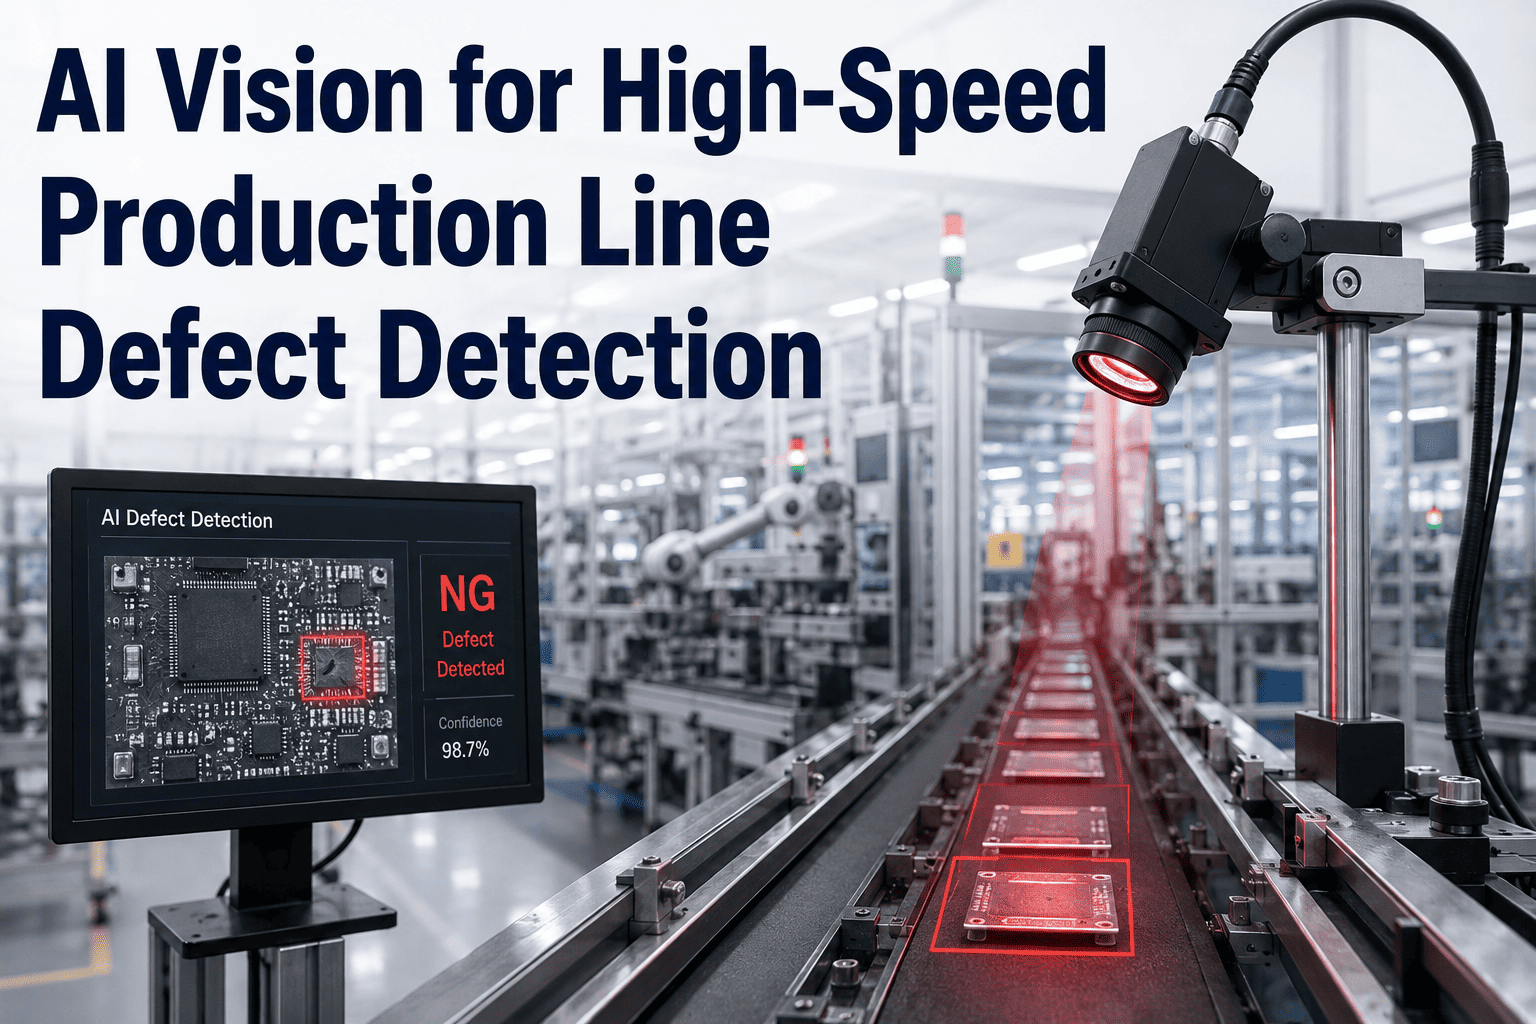
iFactory deploys industrial cameras above your production line that count output, detect stoppages, measure actual line speed, and compute OEE in real time — all from direct visual observation of the conveyor, no PLC integration or MES middleware required for basic deployment.
12-18%
Typical gap between reported shift output and actual verified units on lines using manual counting methods
<2 sec
Latency between a product passing the camera field of view and the count updating on the live dashboard
Zero
PLC code changes or control system modifications required to begin basic AI vision production counting
The Measurement Problem
Your Shift Report Says One Number. The Pallet Leaving the Dock Says Another.
Every manufacturing plant that relies on manual counts, periodic photocell readings, or unvalidated SCADA estimates has a throughput measurement gap. The size of that gap directly translates to production planning errors, inventory discrepancies, and OEE calculations that look fine on paper but do not match reality. The visual below represents a typical shift on a consumer goods packaging line where the only counting method was a shift supervisor checking the line every forty-five minutes.
Shift Report Total
8,400 units
AI Vision Verified Count
7,320 units
Unaccounted Gap
1,080 units (12.9%)
That 12.9 percent gap is not caused by scrap or rejects in this example. It is caused entirely by counting errors: missed hand-counts during high-speed runs, unlogged micro-stoppages between supervisor walk-throughs, and a SCADA total that was extrapolating from a photocell that had been partially blocked by product dust for three weeks. AI vision eliminates each of those failure modes by observing the line continuously and counting individually, not estimating.
How It Works
Four Steps Between a Camera Over Your Conveyor and a Live Throughput Dashboard
iFactory vision monitoring does not require a complex integration project. The data path from camera to dashboard follows a straightforward sequence that can be operational on an existing line within days.
1
Camera Placement
An industrial camera is mounted above the conveyor at a point where every product passes through a clear field of view. The camera connects to the edge processing unit, which can be installed in the same enclosure or on a nearby DIN rail. No changes to the conveyor structure or line controls are needed.
→
2
AI Detection
The vision model identifies each product as it enters the camera view, distinguishing between good units, rejected units, and empty belt sections. The model is trained on images of your specific products, so it recognizes shape, size, and color variations across SKUs without requiring mechanical changes when you change over the line.
→
3
Speed Calculation
The system measures the time interval between consecutive product detections and converts it to a real-time line speed expressed in units per minute. This measured speed is compared against the theoretical ideal speed for the current product run, giving operators an immediate view of whether the line is performing at capacity.
→
4
Dashboard Output
Throughput count, speed trend, stoppage log, and calculated OEE are displayed on the live dashboard and stored for shift-by-shift and day-by-day comparison. Historical data is retained so that production planners can see real throughput trends over weeks and months rather than relying on manually entered shift logs.
Detection Capabilities
What the Camera Actually Sees on Your Production Line
An AI vision system monitoring a production line is not just a counter. It is simultaneously tracking multiple dimensions of line performance from a single camera position, giving reliability and operations teams data that would otherwise require separate sensors for each measurement.
Unit Counting
Every product passing through the camera field of view is individually detected, classified, and counted. The total updates in real time on the shift dashboard, and the system maintains a per-SKU count when the line runs mixed products so that changeover points are marked automatically in the data record.
Stopped Line Detection
When the interval between detected products exceeds a configurable threshold, the system logs a stoppage event with a precise start timestamp and end timestamp. Unlike PLC-based stoppage tracking, vision-based detection captures stops that occur upstream of the monitored point where the PLC might still show the motor running.
Speed Deviation
The system compares the current detection rate against the baseline rate established for the current product and flags when the line is running slower than expected without a full stop. This catches gradual slowdowns caused by worn belts, partial jams, or upstream feeding issues that operators often do not notice until the shift end count comes in low.
Gap and Spacing Analysis
Irregular gaps between products on the conveyor can indicate upstream feeding problems or accumulation that has not yet caused a complete stoppage. The vision system tracks inter-product spacing over time and flags when the spacing pattern deviates from the normal distribution for that product and line speed combination.
OEE Without PLC Dependency
Real-Time OEE Calculated From Direct Visual Observation, Not State Estimates
OEE is the product of three factors: Availability, Performance, and Quality. Most plants calculate OEE from PLC states and manual quality logs, which means every error in the PLC stoppage logic or every missed quality check propagates directly into an OEE number that no one fully trusts. AI vision provides an independent measurement source for each factor.
=
Overall Equipment Effectiveness
Every factor in this OEE calculation comes from the same continuous visual observation of the line. There is no reconciliation needed between separate data sources because the count, the speed, the run time, and the quality classification all originate from the same camera and the same processing pipeline.
Your Production Line Is Already Telling You How Fast It Runs. AI Vision Just Listens.
Continuous visual counting, speed measurement, and stoppage detection for any production line — deployed in days without PLC changes or MES integration projects.
Side by Side
Production Monitoring Methods — Manual and SCADA vs. AI Vision
Measurement
Manual Count and SCADA
AI Vision Monitoring
Output Counting
Shift supervisor counts periodically or reads a SCADA total that may be extrapolating from a single photocell reading
Every unit individually detected and counted in real time with per-SKU breakdown and automatic changeover marking
Line Speed
Derived from conveyor motor speed setpoint, which does not reflect actual product flow rate when belts slip or feeding is irregular
Measured directly from the interval between consecutive product detections, giving true units-per-minute regardless of conveyor condition
Stoppage Detection
Relies on operator log entries or PLC motor-stop flags that miss micro-stoppages and upstream blocks where the motor stays running
Stoppages detected from the absence of product flow with precise start and end timestamps, capturing events that PLC logic does not see
OEE Calculation
Assembled from three separate data sources with different sampling rates and error profiles, requiring manual reconciliation each shift
All three OEE factors derived from the same continuous data stream, eliminating reconciliation and providing a single trustworthy number
Data Accuracy
Typically 82-88% accurate on high-speed lines due to sampling gaps, photocell blockage, and manual entry errors
Greater than 99% counting accuracy on trained SKUs with continuous validation against spot-check counts during commissioning
Deployment Time
Already in place but producing data that operations teams do not fully trust, leading to parallel manual tracking that consumes supervisor time
Camera mounted, model trained, and dashboard live within one to two weeks for a single line with standard product geometry
Line Applications
Production Lines Where AI Vision Counting Delivers the Most Value
Vision-based production monitoring is not equally valuable on every line. The highest return comes from lines where existing counting methods have known gaps, where product characteristics defeat fixed sensors, or where the cost of a counting error is high enough to justify the monitoring investment.
Bottling and Beverage Lines
High-speed lines running two hundred to eight hundred bottles per minute where manual counting is physically impossible and scanner-based counts miss unmarked containers or containers with damaged labels. AI vision counts every bottle regardless of label condition or orientation, providing a verified total that matches what actually goes into the case packer.
Food and Snack Packaging
Products that vary in shape, size, and color across SKUs, where a fixed photocell or proximity sensor cannot reliably distinguish between product and empty belt. The vision model recognizes each SKU individually, so changeovers do not require sensor repositioning or parameter changes in the counting system.
Automotive Parts Assembly
Mixed-model lines where the same conveyor carries different part numbers throughout the shift and throughput needs to be tracked per SKU rather than as a single aggregate count. The vision system classifies each part as it passes and maintains separate counts for each model running on the line.
Consumer Goods and Personal Care
Lines running at moderate speeds where the per-unit value is high enough that even small counting errors represent significant revenue exposure. A two percent counting error on a line producing premium personal care products can represent thousands of dollars per shift in unaccounted inventory variance.
Frequently Asked Questions
AI Vision Production Monitoring — What Plant and Reliability Teams Ask First
Does AI vision production monitoring require integration with our PLC or SCADA system?
No. The basic deployment of AI vision for production counting and speed measurement operates independently of your control system. The camera observes the line directly and the edge processing unit runs the detection model locally, so there is no dependency on PLC data, OPC connections, or SCADA tags for core counting and speed measurement functionality. If you later want to correlate vision data with PLC signals for deeper analysis, that integration can be added, but it is not a prerequisite for getting the monitoring system running and producing actionable throughput data from day one.
Contact support to discuss your specific control system environment.
How accurate is AI camera counting compared to manual counts or photocells?
On trained SKUs with standard product geometry and consistent lighting, iFactory vision counting achieves greater than 99 percent accuracy validated against manual spot-check counts during the commissioning period. The accuracy advantage over photocells comes from the fact that the vision model recognizes the product itself rather than relying on a break-beam or proximity trigger that cannot distinguish between a product and a shadow, a label fragment, or a partially ejected unit. Accuracy is validated during deployment by running the vision system in parallel with your existing counting method and comparing totals until the plant team is confident in the numbers.
Can the system handle multiple product types on the same line without hardware changes?
Yes. The vision model is trained on images of each SKU that runs on the line, and it classifies products in real time as they pass the camera. When the line changes over from one product to another, the system detects the new product type automatically from its visual characteristics and begins counting against the correct SKU profile without any operator intervention, sensor repositioning, or parameter entry. New SKUs can be added to the model by capturing a set of training images from the line and running a model update, which typically takes less than a day for a standard product geometry.
What happens to the data during network outages or camera failures?
The edge processing unit stores detection data locally and buffers it during network interruptions, uploading the complete dataset to the dashboard when connectivity is restored so that no counts are lost. If the camera itself fails, the system generates an immediate alert through the dashboard notification system so that the maintenance team can respond and the operations team knows that counting has paused. The dashboard clearly marks the period of missing data in the shift record so that there is no ambiguity about what was measured and what was not during any given shift.
Book a Demo to see the dashboard failure handling in action.
How long does it take to deploy AI vision monitoring on an existing production line?
For a single line with standard product geometry and consistent lighting conditions, the full deployment from camera mount to live dashboard typically takes one to two weeks. This includes camera installation, edge processing unit setup, initial model training on your products, a parallel validation period where vision counts are compared against your existing counting method, and handoff to the operations team. Lines with complex product geometries, highly variable lighting, or a large number of SKUs may require additional training time, but the core infrastructure deployment timeline remains the same because the camera and processing hardware do not change based on product complexity.
Your Line Is Already Running. The Question Is Whether You Are Counting What It Produces or Just Estimating.
AI vision production monitoring that counts every unit, measures real speed, and calculates OEE from direct observation — deployed without PLC changes and live in as little as one week.