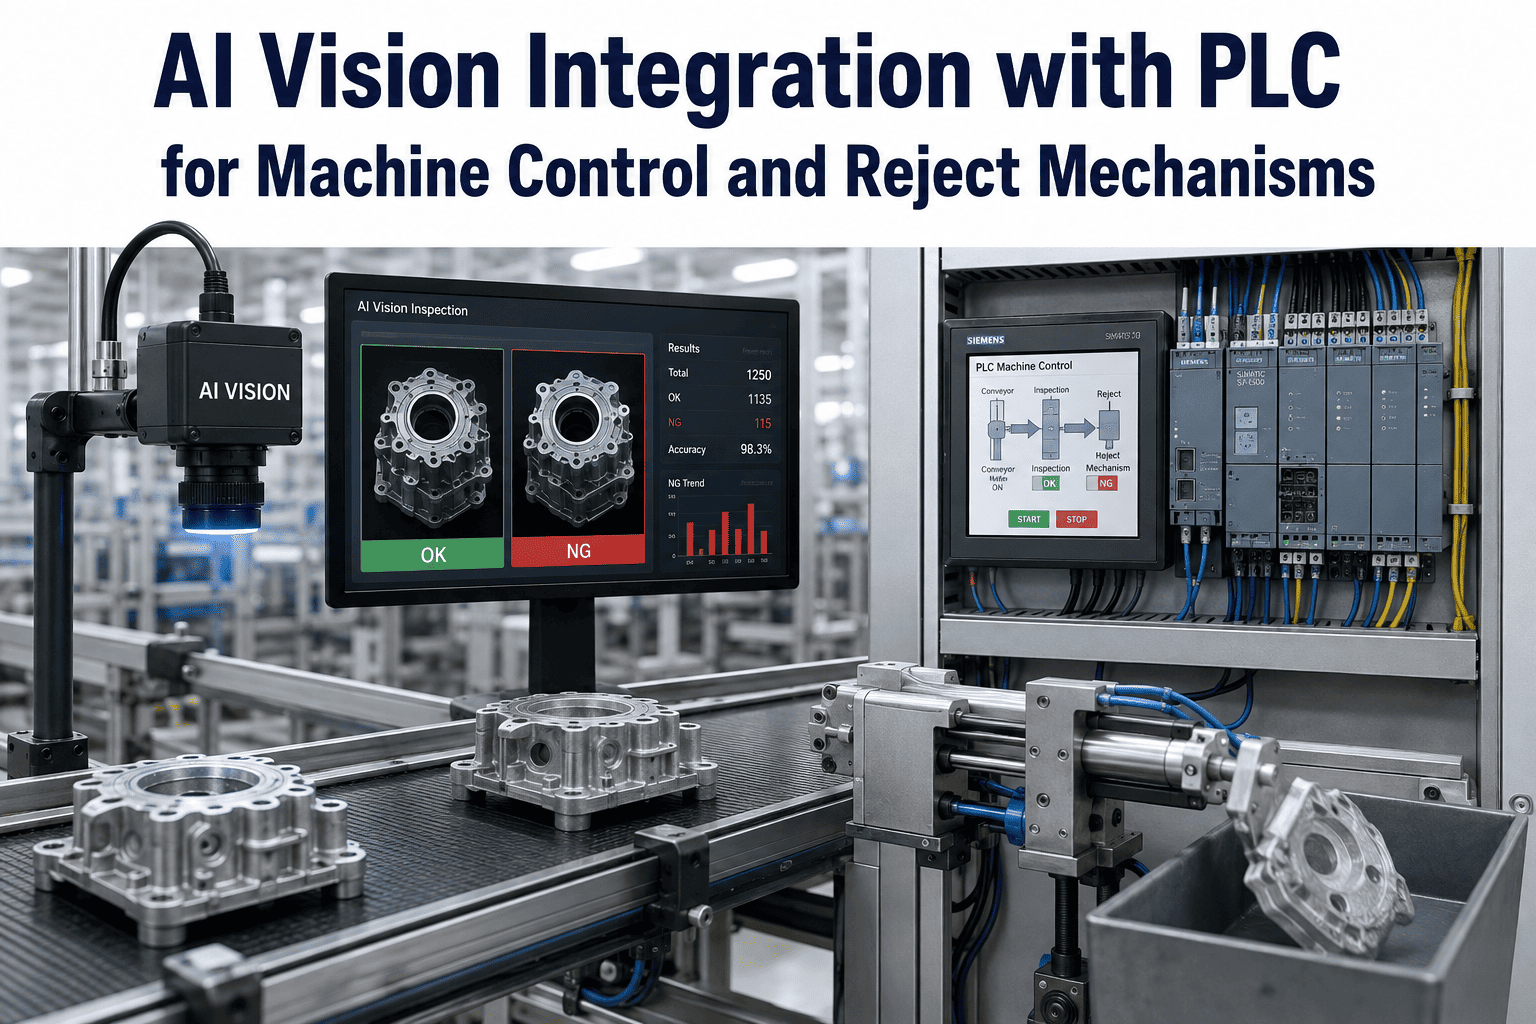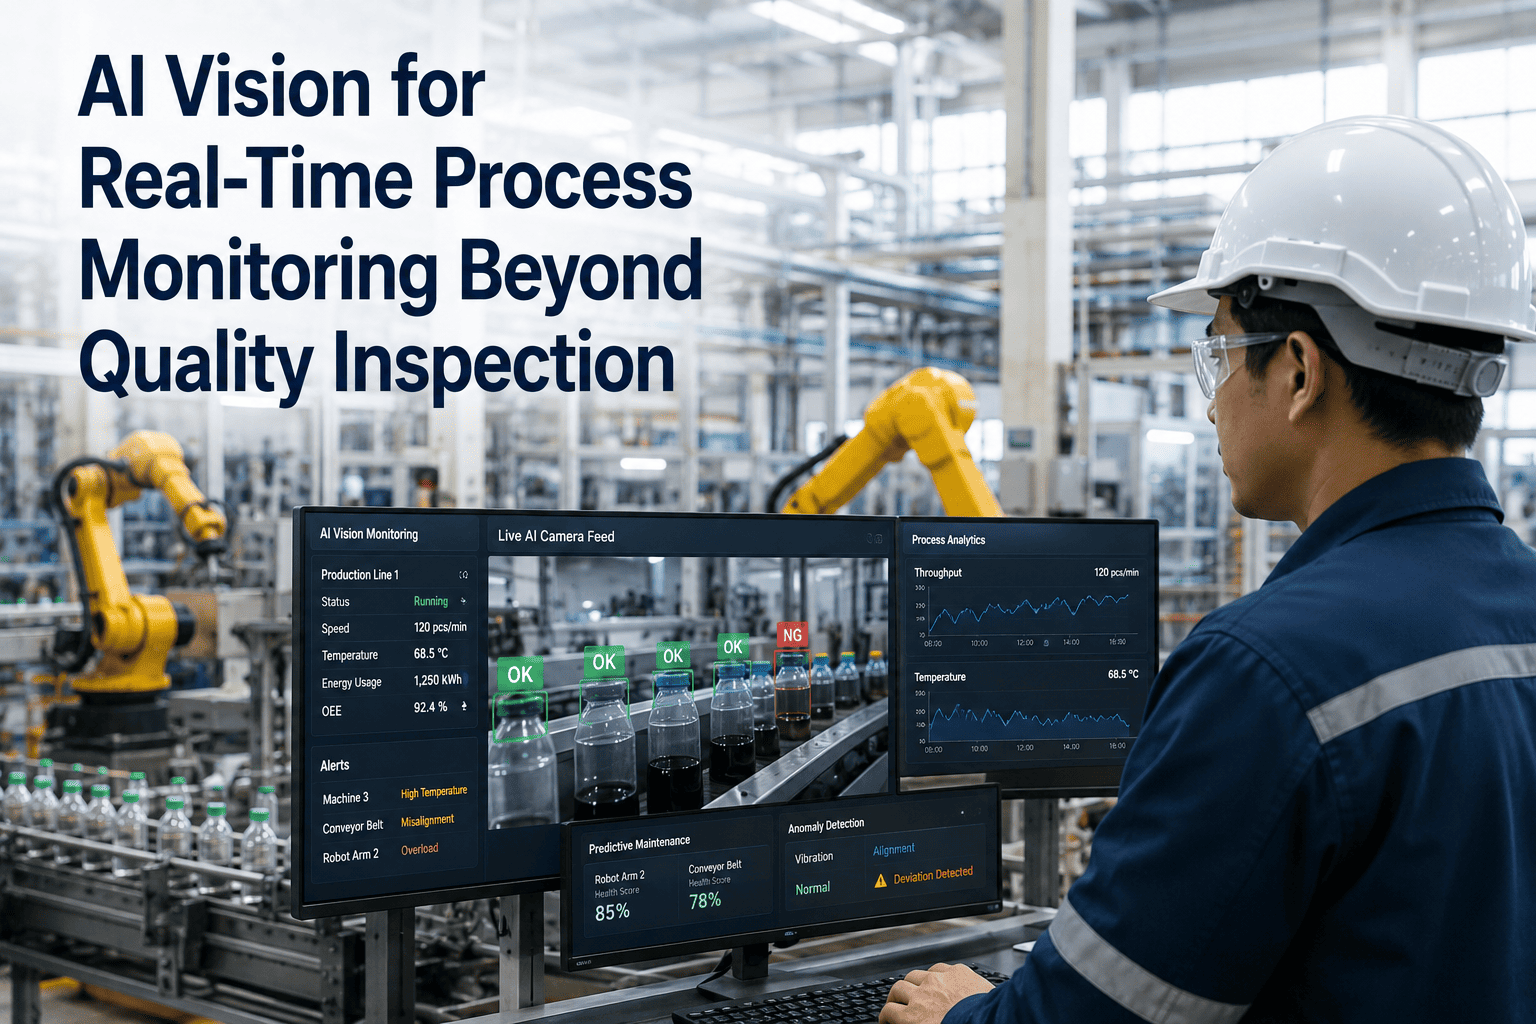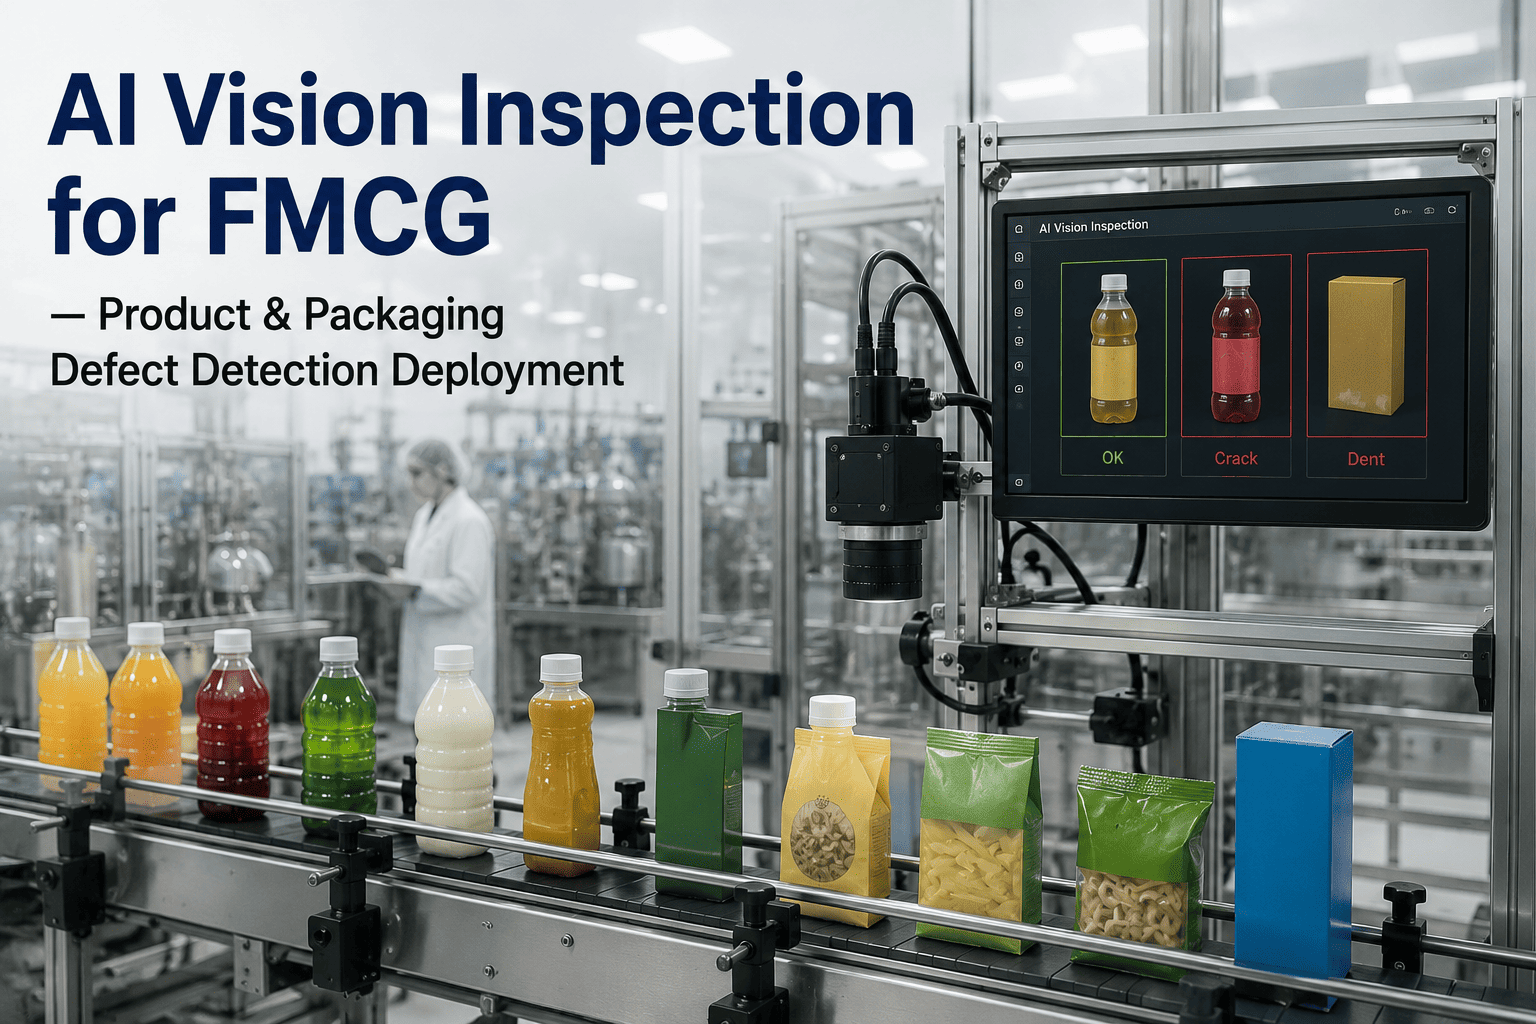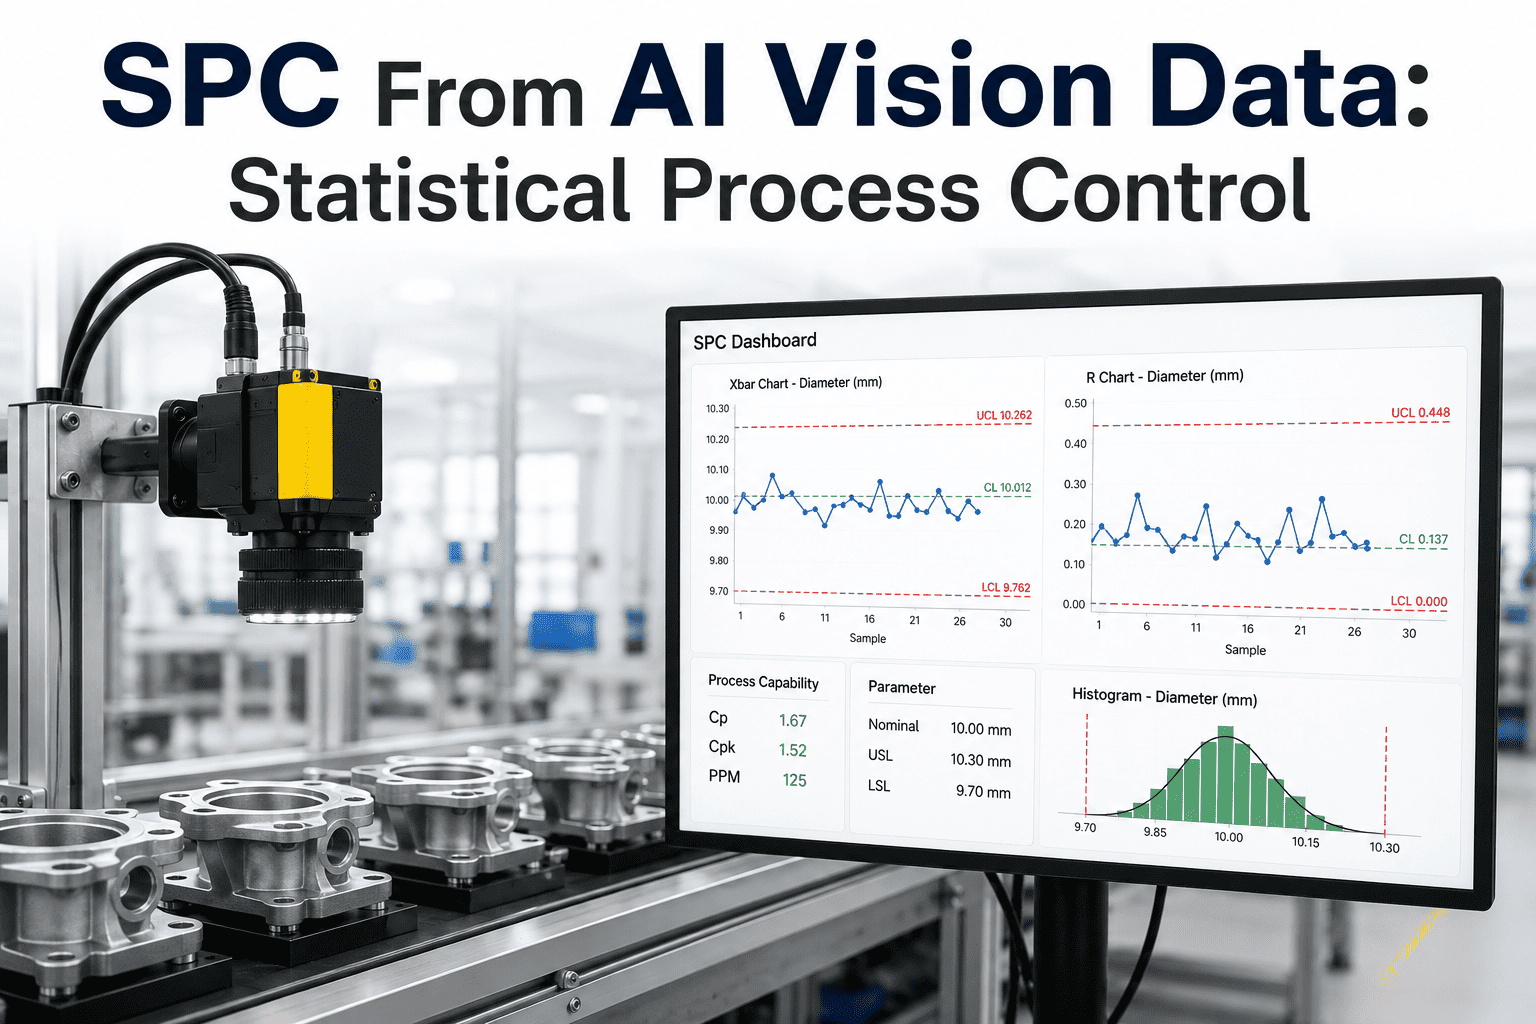
Manual sampling still runs most quality labs — an inspector pulls five parts an hour, measures them with calipers, plots the values on a paper or spreadsheet control chart, and hopes the twenty-fifth part off the tool wasn't the one that drifted. AI vision changes that arithmetic completely. When every part passing under the camera generates a measurement, the control chart stops being a sample of what the process might be doing and becomes a live picture of what it actually did — every cycle, every part, every shift. Statistical Process Control built on that foundation catches drift in seconds instead of hours, and closes the gap between defect creation and defect detection to a single cycle. Cloud-based, AI-integrated SPC has been reported to deliver defect reductions of up to 70% and yield improvements exceeding 25% for early adopters — a scale of improvement that traditional sample-based SPC simply cannot match. To see how a vision-fed SPC layer plugs into your existing line, book a 30-minute walkthrough.
Why Vision Data Belongs on a Control Chart in the First Place
SPC has always had one structural weakness that four decades of quality engineering could never quite solve: it depends on someone measuring the part. When measurement is manual, the frequency of the chart is limited by the endurance of the person holding the caliper — which is why the industry standard settled at five parts an hour or twenty-five parts a shift, not because that's statistically ideal but because it's the most a human inspector can sustain without burning out. Every part between those samples runs unmonitored, and every drift that starts and finishes inside that gap is invisible to the chart until an escape shows up at final inspection.
AI vision removes the human bottleneck from the measurement step. A camera and a trained model can inspect thousands of parts a minute, extracting the same dimensional, positional, and cosmetic features an inspector would — except from every single part, at line speed, without fatigue. When that measurement stream feeds a control chart in real time, SPC finally does what its inventors imagined a century ago: it monitors the process continuously rather than sampling it periodically.
Population, Not Sample
Control limits calculated from every part produced, not from a statistical guess drawn from twenty-five samples an eight-hour shift.
Multivariate by Default
Vision extracts dozens of features per part — length, angle, position, surface class — so the chart tracks the whole part, not one dimension at a time.
Cycle-Time Feedback
Drift alerts fire within the same production cycle the drift began — not at the end of the shift, not at final inspection, not at customer receipt.
Auditable Explainability
Vision measurements plot on classical Shewhart charts, so quality auditors get the same X-bar, R, and Cpk they've always read — with a much richer data foundation underneath.
The Data Pipeline: From Pixel to Control Chart
Getting from a camera frame to a defensible Cpk number involves five discrete stages, each with its own failure modes and each with a specific role in ensuring the SPC output is trustworthy. Understanding the pipeline is the difference between an SPC system that quality leadership actually trusts and one that gets ignored the first time it fires a false alarm.
Which Control Charts Vision Data Actually Feeds
Vision measurement produces both variables data — continuous measurements like a hole diameter — and attributes data — discrete classifications like "scratch present" or "scratch absent" — and different chart types apply to each. A production line that only monitors X-bar-R while its vision system also produces defect classification data is leaving half the SPC value on the table. The mapping below shows which chart type belongs on which data stream.
| Vision Data Type | Chart Applied | What It Detects | Typical Manufacturing Use |
|---|---|---|---|
| Continuous dimension | X-bar & R | Shift or drift in the process mean and spread | Machined bore diameter, stamped part length |
| Continuous dimension (single unit) | I-MR (Individuals & Moving Range) | Point-by-point drift when subgrouping isn't practical | Extrusion cross-section, injection-mold flash |
| Pass/Fail classification | p-chart (proportion defective) | Shift in fraction of defective units produced | Surface pass/fail on painted panels, bottle fill inspection |
| Defect count per unit | c-chart or u-chart | Shift in the rate of surface defects per part | Scratches on glass, blemishes on textile roll |
| Multiple correlated features | Hotelling T² (multivariate) | Joint drift across features individual charts miss | Assembled electronics with dozens of vision checkpoints |
| Small, persistent shifts | CUSUM or EWMA | Slow drift that stays within Shewhart limits | Tool wear over hundreds of parts, thermal drift |
The multivariate case deserves special mention because it's exactly where vision data delivers value that manual sampling never could. When a single part yields thirty measurements, tracking thirty independent Shewhart charts produces so many false alarms that operators start ignoring them all. A Hotelling T² chart collapses those thirty variables into a single monitored statistic that respects the correlations between them — catching the drift patterns that no individual chart would flag on its own.
See Live Control Charts Built From Your Own Line's Vision Data
iFactory ingests measurements from your existing cameras, plots them on the right chart type per feature, and delivers Cpk that updates cycle-by-cycle — no rip-and-replace of your inspection hardware required.
A Composite Scenario: Catching a Drift Nobody Would Have Seen
Consider a mid-sized automotive supplier stamping a bracket at roughly 900 parts an hour on a progressive die. Manual SPC procedure calls for pulling five parts an hour, measuring three critical dimensions, and updating an X-bar-R chart at the end of each shift. The process has run in control for years, Cpk consistently above 1.67 on all three characteristics — the kind of stable operation that quietly stops receiving attention because it never causes problems.
A vision system installed on the exit conveyor begins measuring every part as it leaves the die. Within three days of continuous data, the SPC engine flags a pattern the manual chart had been missing for months: on the first ninety minutes of every second-shift startup, the bracket length shifts systematically about 0.04 mm above target — still well inside specification, still within Shewhart control limits when computed on the historical sample-based data, but visible as a clear non-random pattern once every part is measured. The drift correlates precisely with die temperature stabilization after the shift changeover, when the die runs cooler until it reaches thermal equilibrium.
Because the drift stays inside specification, no defective parts had ever reached final inspection or the customer. The escape rate was zero, and by any traditional quality metric the process was performing beautifully. What the vision-fed SPC surfaced was a genuine special-cause pattern — one that, if a die wear step or a material batch change ever pushed the mean any further, would immediately begin producing rejects. The response was to add a fifteen-minute warm-up cycle before second-shift production started, eliminating the thermal drift entirely. Six months later, when a material supplier changed alloy vendors and the tolerance stack tightened, the previously invisible margin turned out to be exactly the buffer that kept the line running through the transition without a single reject.
The Business Case: What Changes on Your P&L
The value of vision-fed SPC shows up in four line items that operations leaders already track, and understanding which one moves first helps set the right expectations with a plant manager or CFO evaluating the investment. The pattern is consistent across deployments: scrap reduction leads, throughput and yield follow within a quarter, and the labour reallocation savings compound over the second year as inspectors move from measuring parts to responding to alerts.
Real-time drift detection means process corrections happen before defective parts accumulate, not after. Cloud-based AI-integrated SPC deployments have reported defect cuts of up to 70%.
Fewer parts scrapped means more good parts produced per raw material dollar. Yield gains above 25% have been documented at manufacturers running AI-augmented SPC.
Layered AI-SPC catches real process excursions 2–4 hours earlier than Shewhart limits alone, converting shift-length problems into cycle-length problems.
Multivariate models respect correlations between measurements, cutting the nuisance alarms that lead operators to distrust or bypass single-variable charts.
Where Vision-Fed SPC Fits and Where It Doesn't
Not every measurement belongs under a camera, and pretending otherwise is how vision projects earn a reputation for over-promising. Some critical characteristics — internal weld quality, chemical composition, hardness — are fundamentally invisible to a camera and belong on other measurement systems entirely. The honest framing is that vision-fed SPC excels at a specific class of problem, and the plants getting the biggest ROI are the ones that deployed it where the fit was strongest, not the ones that tried to cover every characteristic with pixels.
Implementation Roadmap: From First Camera to Full-Line SPC
Vision-fed SPC works best when it's rolled out in staged phases rather than as a plant-wide big-bang deployment. The staged approach lets the quality team build confidence in the alerting logic on a controlled scope before expanding, and it lets the operations team see measurable wins early enough to justify the next phase's investment.
Select one production station where a defect escape carries real cost, existing inspection is manual, and lighting conditions are stable. A single-station pilot proves the pipeline works before scaling.
Run vision measurement in parallel with existing manual SPC for two to four weeks. Use the population data to calculate true control limits, and compare against the historical sample-based limits — the gap often reveals process realities nobody knew about.
Turn on real-time rule evaluation and route alerts to the operator interface. Start conservative — alert only, no automated adjustment — and tune sensitivity based on the first month of alert response history.
With the pipeline proven and the alert-response workflow established, replicate to adjacent stations. Each new deployment gets faster as the platform, integration patterns, and response protocols are already in place.
The Four Mistakes That Sink Vision-Fed SPC Deployments
Most vision SPC projects that fail don't fail because the technology doesn't work — the cameras capture the images, the models produce the measurements, the charts plot correctly. They fail because of a small set of preventable mistakes in how the deployment is designed and rolled out. Knowing them in advance is how a plant avoids becoming one of the case studies nobody wants to write.
Treating It as a Vision Project, Not an SPC Project
Buying cameras and models without a plan for how the measurement data will feed control charts, trigger alerts, and drive operator response produces a very expensive defect classifier and no process improvement.
Skipping the Baseline Comparison
Turning on live alerts before establishing what "in control" actually looks like for the process — with the new, higher-frequency data — produces a flood of false alarms that quickly train operators to ignore the system entirely.
Ignoring Camera Calibration Drift
A camera whose calibration slowly shifts produces measurements that drift alongside the process it's monitoring. Without periodic reference-part checks, a camera fault gets recorded as a process fault, and the root cause investigation goes in exactly the wrong direction.
Not Redefining the Operator's Role
Vision-fed SPC changes the operator's job from "measure parts and update the chart" to "respond to intelligent alerts." Deployments that don't retrain operators, redesign standard work, and update escalation procedures never capture the full ROI.
How iFactory Handles the Vision-to-SPC Bridge
The gap between having vision hardware and having a working AI-SPC system is where most projects stall — the cameras produce data, but connecting that data to the right chart type, calculating rolling control limits, evaluating rule violations, and routing alerts to the responsible role is where the engineering effort really lives. iFactory's platform ships this bridge as a configurable layer that sits between existing inspection hardware and the quality team's dashboards, so plants don't have to build the pipeline themselves.
Camera-Agnostic Ingestion
Connects to existing 2D, 3D, and hyperspectral cameras from any major vendor. No rip-and-replace of inspection hardware.
Automatic Chart Selection
Detects whether a measurement stream is variables or attributes data and applies the appropriate chart — X-bar-R, I-MR, p, c, or Hotelling T².
Rolling Control Limits
Recalculates control limits on a configurable window, so limits adapt to legitimate process changes without losing sensitivity to genuine drift.
Live Cpk & Ppk
Capability indices update cycle-by-cycle, giving quality leadership a real-time view of process performance instead of a monthly retrospective report.
Western Electric & Nelson Rules
All standard rule sets evaluate every new data point in real time, with alerts tagged by which specific rule triggered and why.
Audit-Ready Records
Every measurement, alert, and operator response logged with timestamps for IATF 16949, AS9100, and FDA Part 11 documentation trails.
Frequently Asked Questions
The questions below cover what quality engineers, plant managers, and IT leaders most often ask when evaluating a move from sample-based SPC to a vision-fed continuous SPC architecture.
Does vision-fed SPC replace our existing quality management system?
No — it feeds it. Vision-fed SPC produces the same X-bar, R, Cpk, and Ppk numbers your quality management system already reports on, just derived from a much richer data foundation. Existing QMS dashboards, customer PPAP submissions, and internal audit records continue to work as they always have, with the difference being that the underlying measurements now come from every part instead of a sample. Contact support to walk through how the integration works with your specific QMS.
Can we use our existing cameras, or do we need new hardware?
In most cases the existing cameras are fine. The bridge layer connects to the measurement outputs of any major 2D, 3D, infrared, or hyperspectral inspection system, so plants that have already invested in vision hardware typically don't need to replace it. New cameras only enter the picture when the current hardware lacks the resolution needed for the specific tolerance being monitored, or when a station has no inspection coverage at all today. A 30-minute demo covers hardware compatibility for your specific line.
How long before we see measurable ROI on a vision-fed SPC deployment?
The first measurable improvements usually appear within the first six to eight weeks — that's when the baseline comparison and initial alerting typically expose the most immediate drift patterns nobody had visibility into before. Full ROI, in the sense of documented scrap reduction, throughput improvement, and inspector reallocation savings, tends to accumulate over the first two to three quarters, with the largest gains in the second year as the alerting logic tunes to the plant's actual behavior. The staged rollout is what compresses that timeline.
What happens when the camera itself drifts or fails?
A well-designed vision-fed SPC pipeline includes periodic reference-part checks — running a known-good calibration part through the camera at set intervals and comparing the measurement against the stored calibration value. If the reference measurement drifts beyond a configured tolerance, the system flags a measurement system alarm rather than a process alarm, so the maintenance team investigates the camera before anyone assumes the process is broken. Without this safeguard, camera drift and process drift become indistinguishable.
Do we still need manual SPC checks if vision covers every part?
Manual gauge checks remain valuable as an independent verification of the vision system itself — the classic measurement system analysis principle that no single measurement source should ever be the only source. Most mature deployments keep a much-reduced manual sampling routine specifically as a cross-check against the vision measurements, catching the rare case where a camera or model has quietly drifted. The frequency of manual checks typically drops by 70–90%, but rarely to zero. Visit support for guidance on the right cross-check cadence.
Turn Every Camera Frame Into a Cpk Number Your Leadership Can Trust
iFactory bridges your existing vision hardware to live control charts, cycle-by-cycle Cpk, and audit-ready SPC records — so quality goes from a shift-end retrospective to a real-time process feedback loop. Book a 30-minute walkthrough and we'll show you what a live chart from your line's data would look like.