The press operator flags it on the second shift: burrs on the trailing edge of a stamped bracket, the kind that slip past a periodic check and show up at the customer's assembly line three days later. By the time quality catches it, 4,000 parts are in the tote, the scrap tag is written, and the root cause is already cold. Stamping dies wear gradually, and the slow drift from acceptable to reject happens between samples, not during them. That gap, between when a defect starts and when someone finds it, is where automotive parts plants lose margin every single day. Automated root cause analysis closes that gap by inspecting 100% of parts in motion and tying every reject back to the machine, die, and process parameter that produced it, in real time.
The Hidden Cost of Sample-Based Inspection on Stamping Lines
Most auto parts plants still run on a first-piece, in-process, last-piece sampling plan. It made sense when inspection was manual. But on a 60-stroke-per-minute progressive die press, a sampling plan covers less than 2% of production. The other 98% is a black box. When a defect escapes, the investigation starts from nothing: pull the tote, sort by time, correlate to shift, guess at the die condition. That investigation takes hours or days, during which the press keeps running. Book a single-line automated RCA assessment to see how much of your defect cost is traceable to that detection lag.
of stamped parts that bypass any visual inspection under typical sampling plans on a 60 SPM progressive press
average time to isolate root cause on a machining cell defect using manual log review and operator interviews
typical cost of a single customer-returned automotive stamping lot, before sorting and freight charges
of automotive supplier PPM defects linked to process drift that sampling plans cannot detect in time
How Automated RCA Works on an Existing Stamping or Machining Line
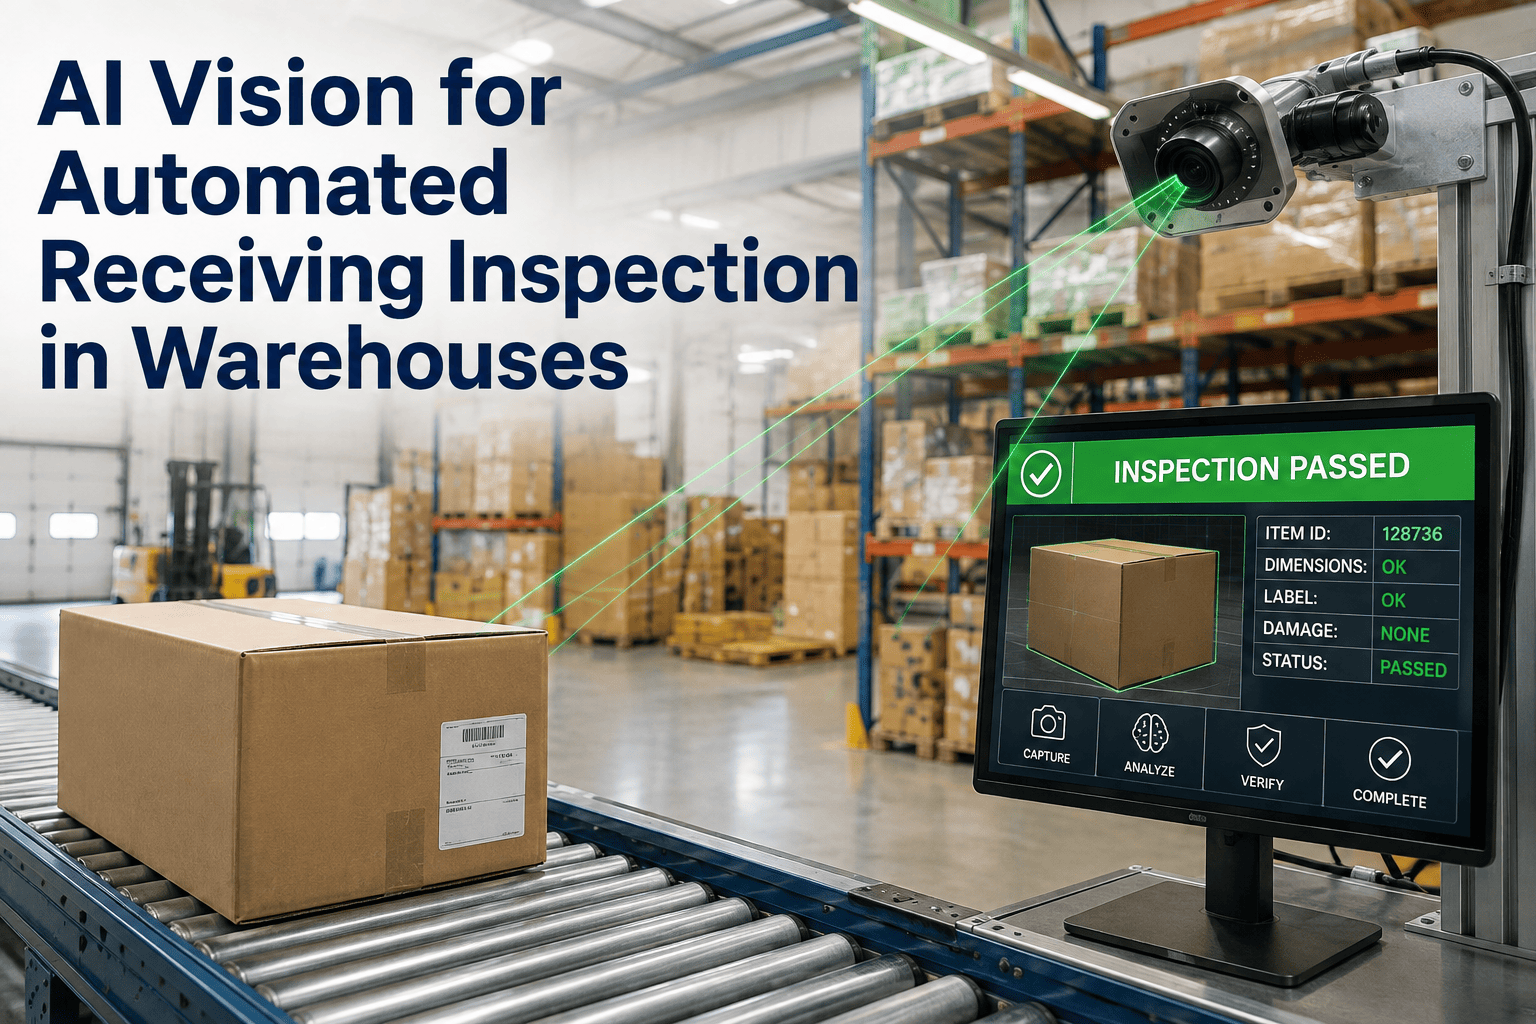
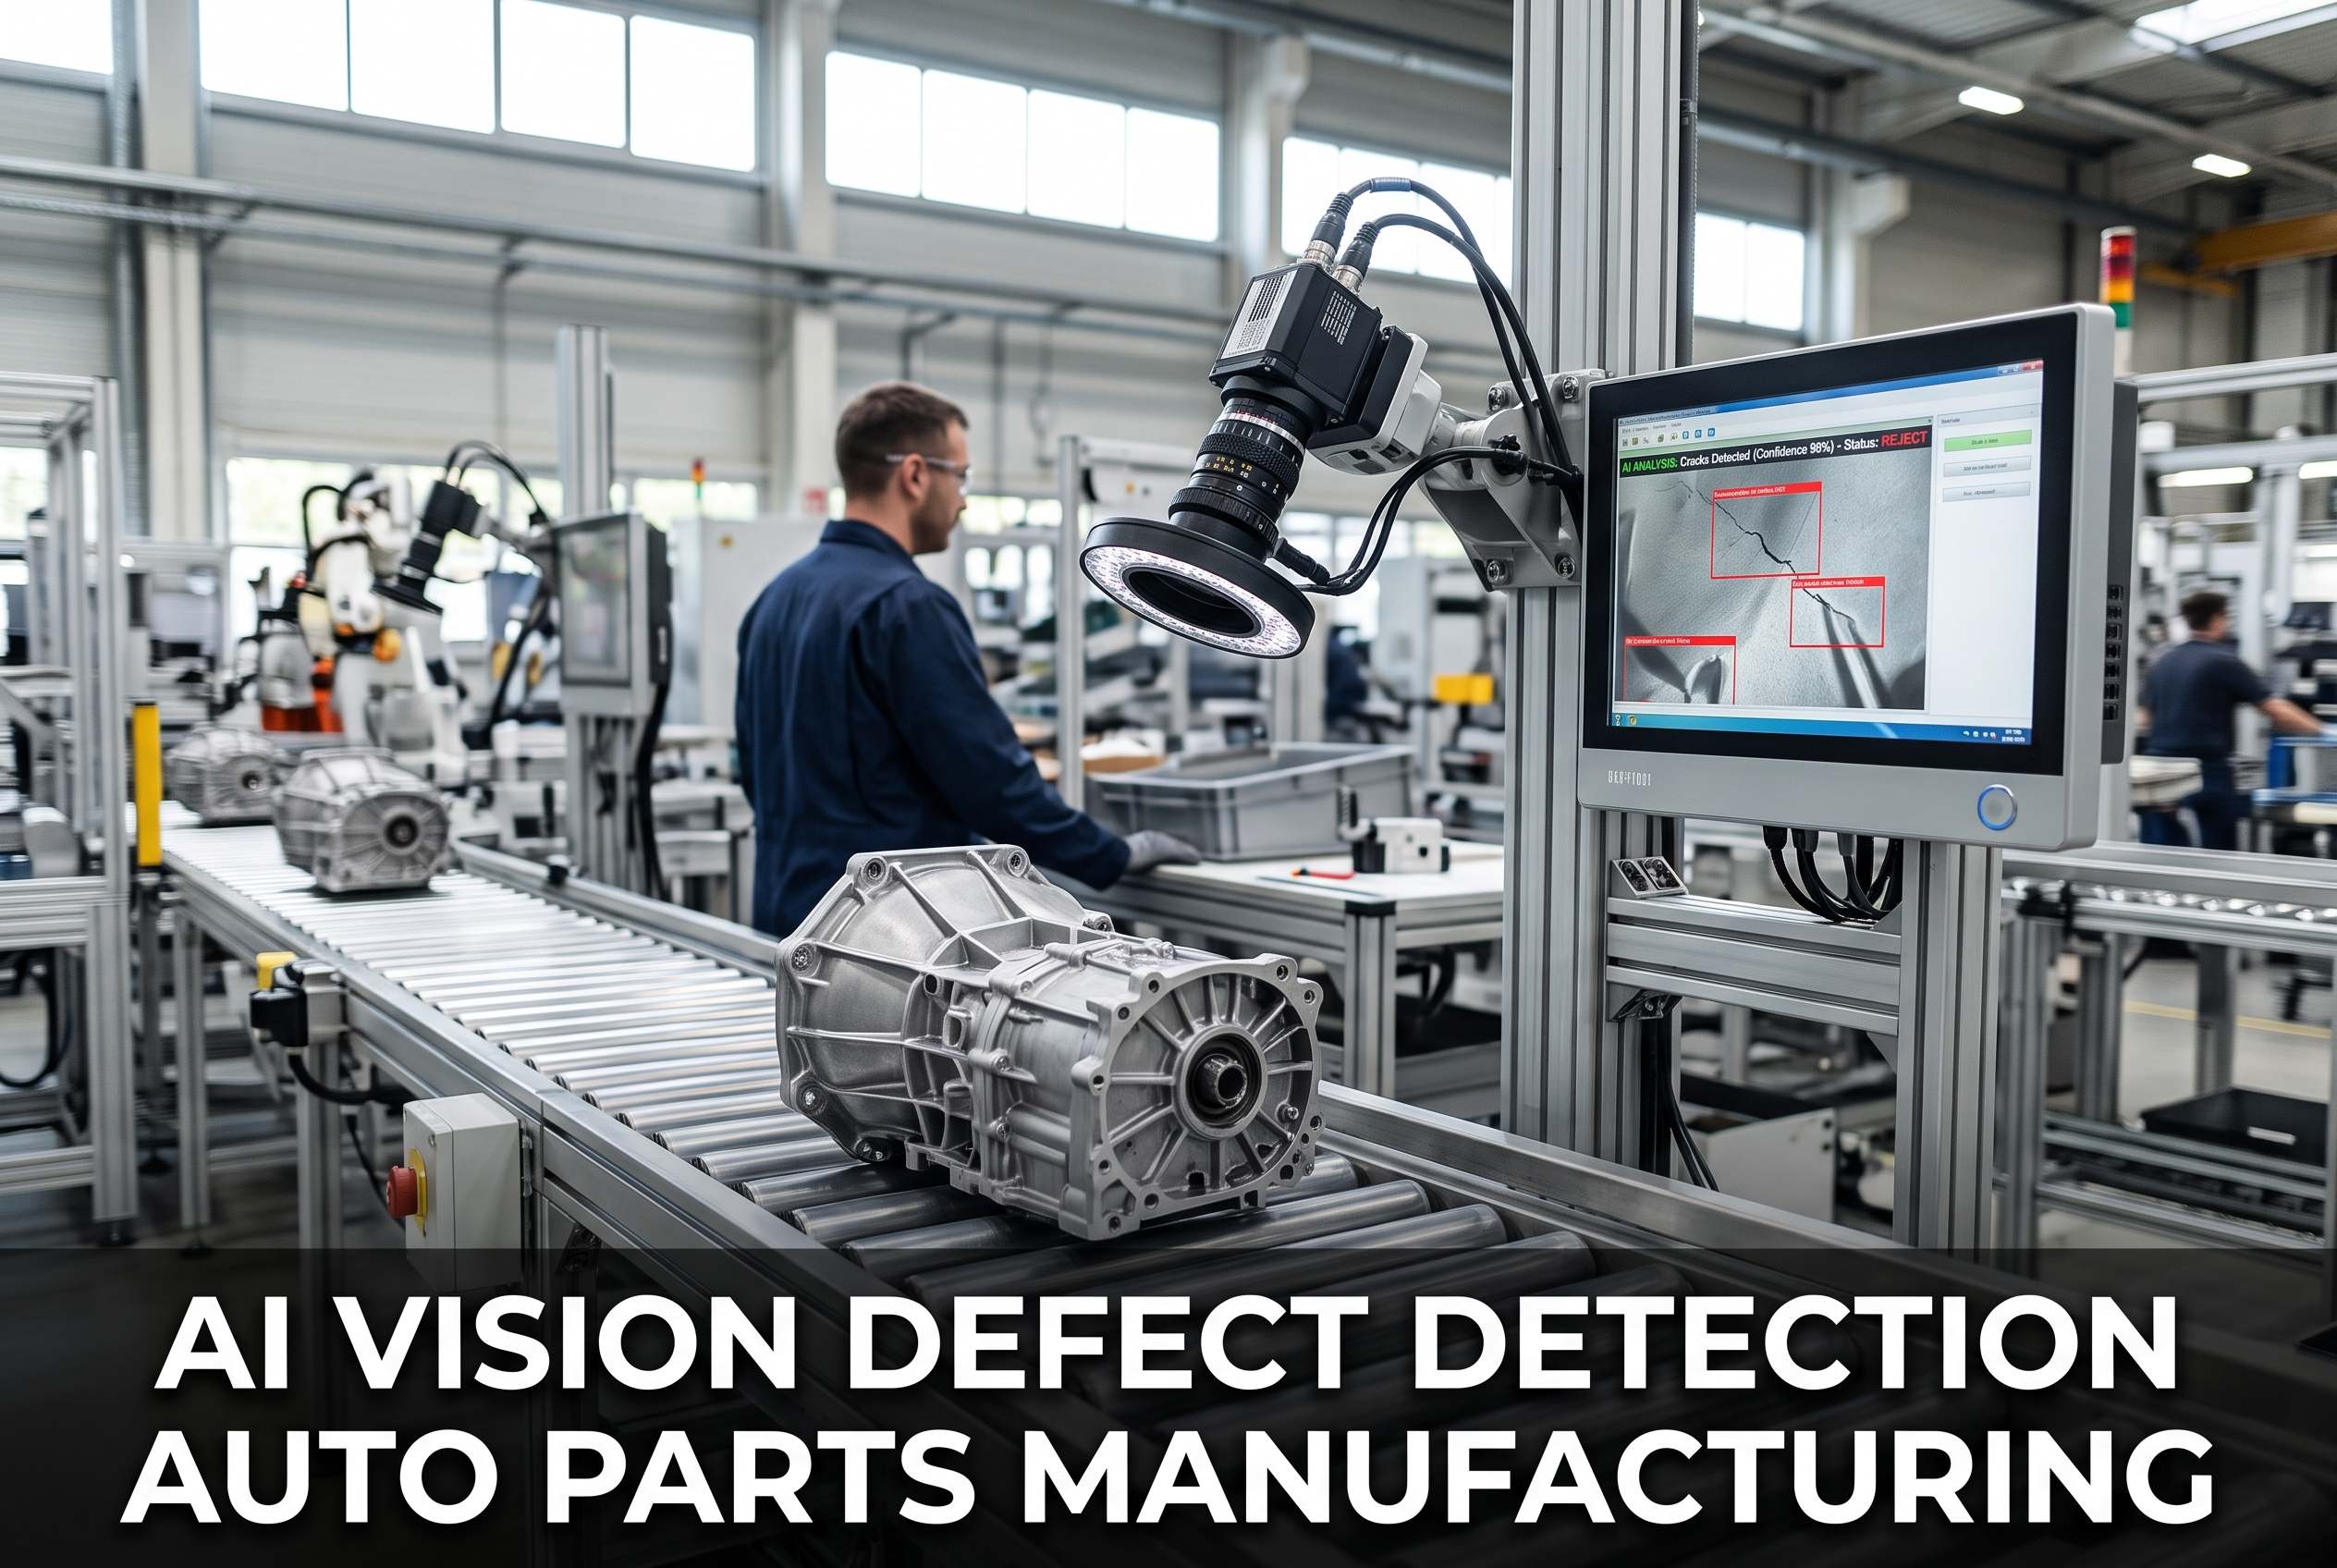
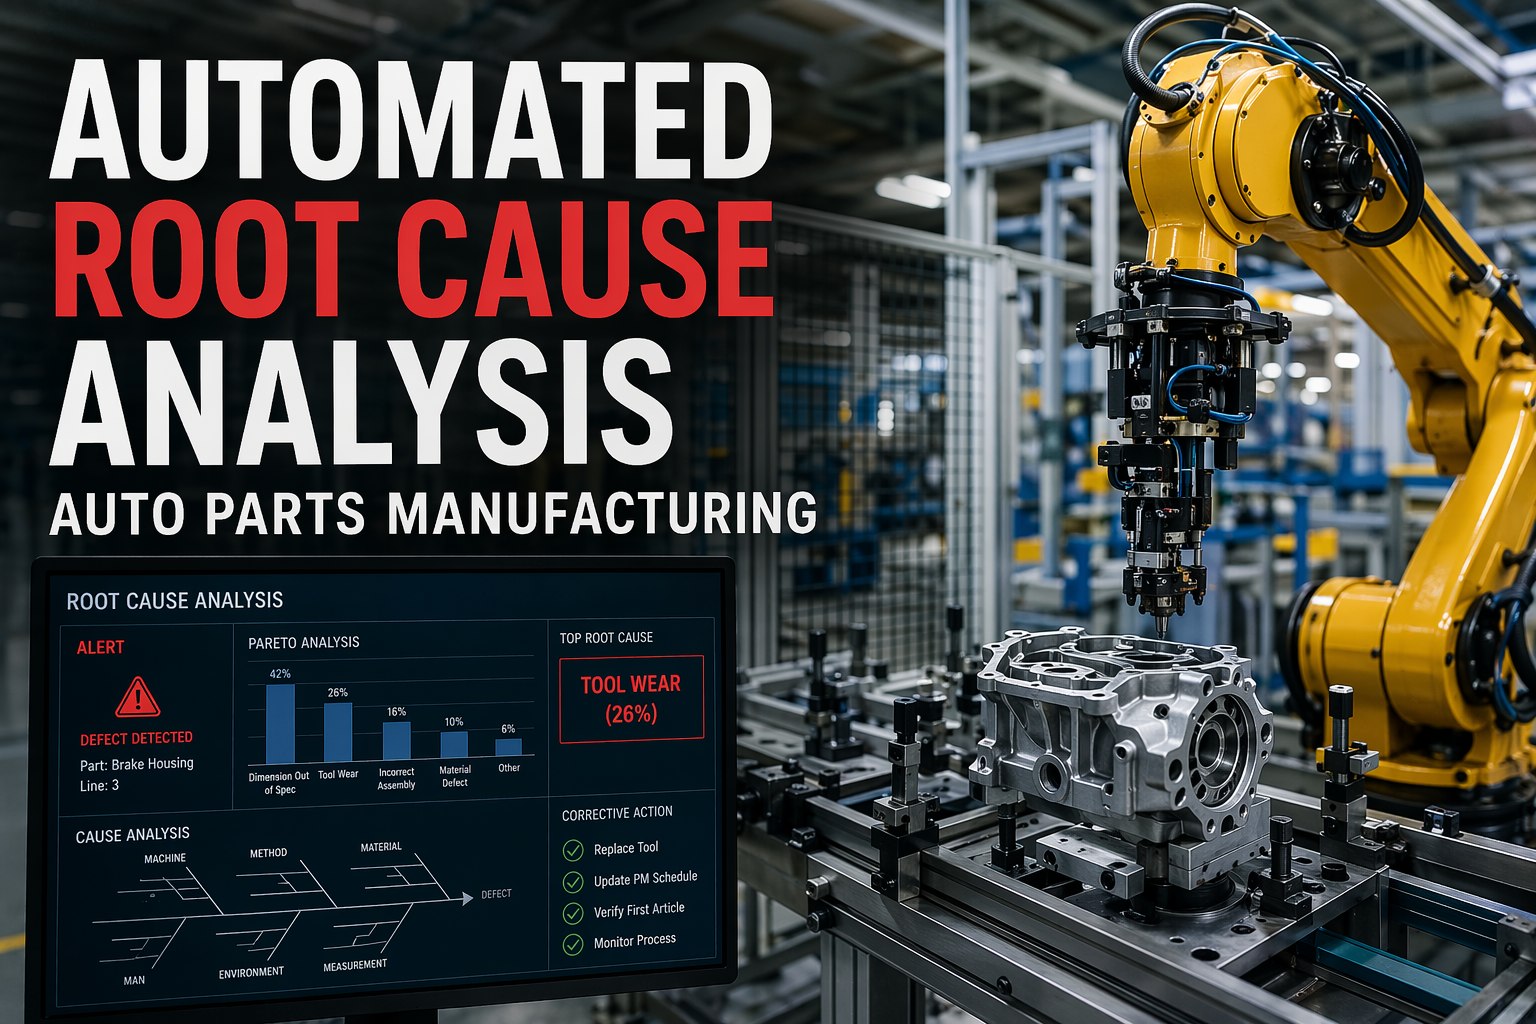
The system does not replace your press or your machining center. It layers onto the existing line exit, captures an image of every part at production speed, classifies it, and writes the result, the image, and the process context back to a database that performs the root cause analysis automatically. Here is the architecture, from camera to corrective action.
Line-Exit Capture
High-speed industrial cameras mount at the press exit or conveyor discharge. Strobe lighting freezes motion at 60+ parts per minute. No line slowdown, no manual handling.
On-Prem GPU Inference
NVIDIA GPU appliance on the plant floor runs deep-learning models trained on your defect library. Inference under 50ms per part. No cloud round-trip, no data leaving the facility.
Three-Way Routing
Classification signal writes to the Level 2 PLC or DCS. Pass parts continue to the next stage. Rework parts divert to the rework chute. Scrap parts divert to the scrap bin with a timestamp and image.
Automated Root Cause
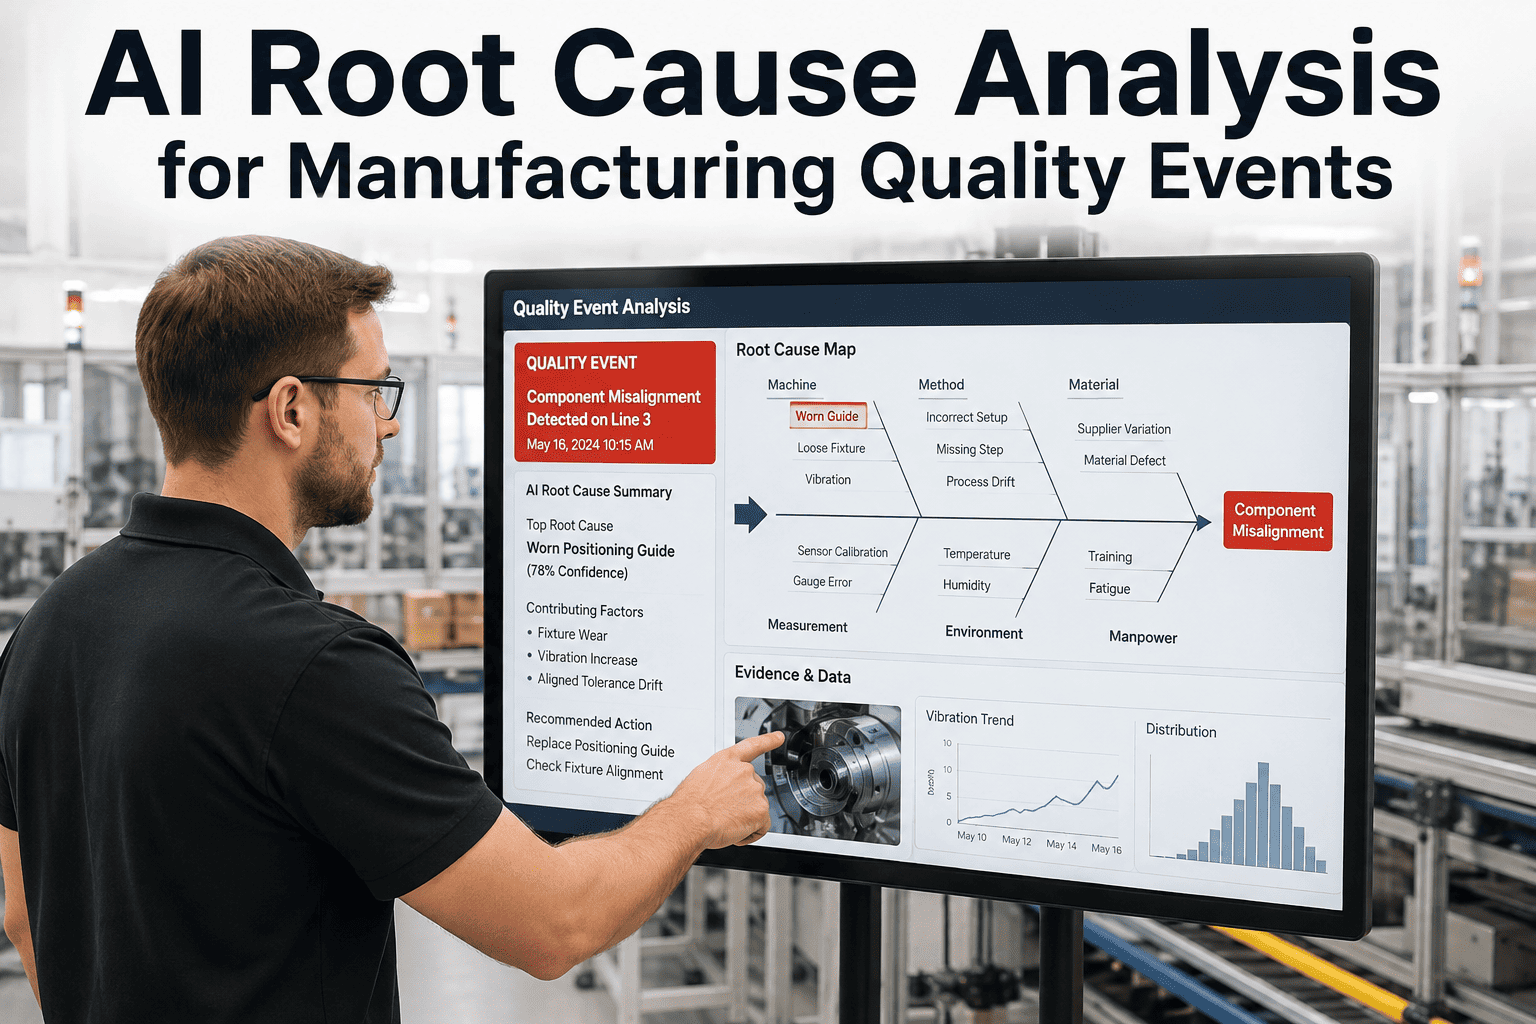
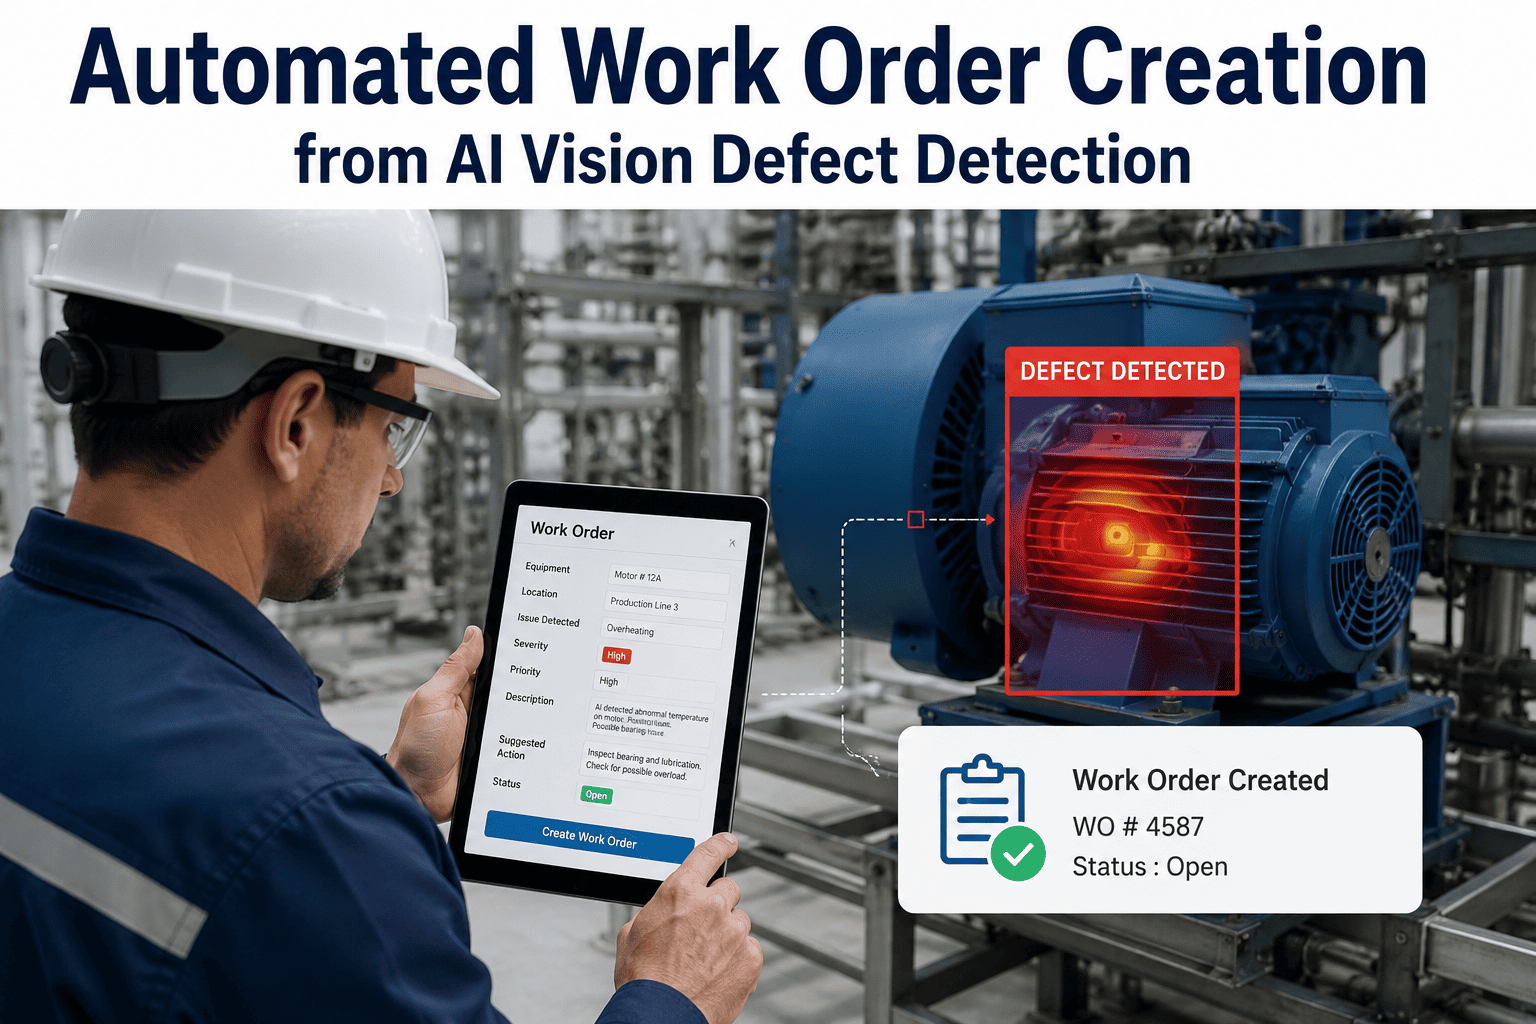
Defect images correlate with PLC tag data: die temperature, tonnage, stroke count, feed position. The system surfaces the likely cause and the exact part window affected, in minutes.
Manual RCA vs Automated RCA: What Changes on the Floor
The difference between manual and automated root cause analysis is not just speed. It is the difference between investigating an event that already ended and correcting a process that is still running. Here is what changes when the system goes live.
Curious what your RCA time-to-closure looks like compared to automated benchmark? Book a 30-minute RCA gap analysis with iFactory's automotive vision team.
Stop Sorting Totes. Start Catching Defects at the Source.
iFactory's automated RCA platform retrofits to your existing stamping presses and machining cells with on-prem NVIDIA GPU inference, PLC tag capture, and MES/ERP integration. See how a fixed-price 8-week pilot on one line changes your PPM and scrap cost.
What the Vision System Catches: Auto Parts Defect Categories
The deep-learning models are trained on your actual defect library, not a generic catalog. That matters because a burr on a progressive-die bracket looks nothing like a burr on a fineblanked gear tooth. Here are the defect categories the system catches at line speed on automotive parts, with the routing decision made per part.
Burr Formation
Die wear and punch degradation produce burrs on trimmed and pierced edges. The system tracks burr size trend over stroke count and flags the die-sharpening window before parts go out of spec.
Porosity & Casting Voids
On machined castings and sintered parts, subsurface porosity breaks through at the machine face. The system detects surface-breaking voids and correlates them to the cast lot and tool position.
Missing Operations
A hole not drilled, a tab not bent, a thread not tapped. The system verifies feature presence against the part recipe and diverts before the part reaches the next station or the customer.
Surface & Coating Defects
Scratches, dents, plating skips, and coating thickness variation on visible and functional surfaces. Critical for Tier 1 exterior and safety-critical components under PPAP scrutiny.
Dimensional Drift
Feature-of-size checks at the camera station: bend angle, hole position, flange width. Trend data feeds back to the press or machine for tooling adjustment before the dimensional tolerance is breached.
Wrong Part / Mix-Up
When a line runs multiple SKUs or left/right hand variants, the system verifies part identity against the MES schedule and prevents the wrong part from entering the tote or the next operation.
MES, ERP, and PLC Integration: The Identity Layer That Makes RCA Work
Vision without identity is just pictures. The reason automated root cause analysis works is that every image, every defect classification, and every routing decision is tied to a specific part, a specific machine, a specific die or tool, and a specific production order. That requires three integrations, and they all matter.
PLC Tag Capture
The system reads press tonnage, die temperature, stroke count, feed advance, lubrication pressure, and cycle time directly from the PLC or DCS at part-level resolution. Every image is stamped with the process conditions that produced it. When a defect appears, the system does not ask what happened, it shows you what happened.
- Tonnage profile per stroke
- Die temperature trend
- Feed position and advance error
- Lubrication and pressure status
- Cycle time and dwell deviation
MES Order Mapping
The vision system talks to the MES via API to pull the current production order, part number, revision, and routing. Every inspected part inherits the MES identity, so a reject is not just an image, it is a part with a lineage. Rework and scrap counts write back to the MES in real time, closing the loop on OEE and first-pass yield.
- Production order and part number
- Revision and engineering level
- Routing step and operation ID
- Operator and shift context
- Real-time scrap and rewrite-back
ERP & QMS Traceability
Defect data rolls up to the ERP and QMS for supplier chargeback, customer 8D response, and long-term trend analysis. When a customer reports a field issue, you can pull every image and every process tag for that specific lot in minutes, not days. Talk to a specialist about your MES and ERP integration architecture before scoping a vision project.
- Lot and batch traceability
- 8D evidence package export
- Supplier chargeback documentation
- PPM and COPQ reporting feeds
- Long-term defect trend analytics
Measured Impact: PPM, Scrap Cost, and First-Pass Yield
Automated RCA is not a quality project, it is a margin project. The plants that deploy it on stamping and machining lines see the impact in three places: PPM defect rate drops because defects are caught and corrected in-process, scrap cost drops because the affected window is scoped precisely instead of sorting the whole tote, and first-pass yield rises because process drift is corrected before it produces reject parts. Here is what the before-and-after looks like on a typical Tier 2 stamping line.
Want an ROI worksheet built around your line's volume, scrap rate, and labor cost? Book a pilot scoping session and iFactory will build the numbers with you.
The Fixed-Price 8-Week Pilot: What Happens and When
You do not rip out lines or bet the plant on a multi-year program. The pilot is a single line, a fixed price, and an 8-week timeline from kickoff to live automated RCA. Here is the week-by-week breakdown of what happens, so you know exactly what you are signing up for before you book a pilot kickoff.
Line Assessment & Defect Library
iFactory engineers walk the line, map the PLC tags, review the last 12 months of defect logs, and collect sample images of every defect category from your scrap bins and customer returns.
Model Training & Integration Build
Deep-learning models train on your defect library. API integrations to MES and ERP are built and tested. PLC tag capture is configured against your specific controller and tag database.
Camera & GPU Appliance Install
Cameras, lighting, and enclosures mount at the line exit. NVIDIA GPU appliance installs on the plant floor. No production downtime required, installation happens during scheduled changeover or weekend windows.
Live Shadow Run & Tuning
System runs in shadow mode: inspecting, classifying, and logging but not routing. Engineers tune thresholds against your quality team's verdicts until agreement rate exceeds 99%.
Go Live with Automated Routing
Three-way pass/rework/scrap routing goes live to the PLC. RCA dashboard opens to quality and process engineers. First defect event triggers the automated root cause report. You see the system pay for itself.
Ready to See Automated RCA on Your Line?
Book a 30-minute scoping call. We will review your line, your defect categories, your PLC and MES environment, and build a fixed-price 8-week pilot proposal with an ROI worksheet tailored to your scrap rate and production volume.
Expert Perspective
We used to spend the first two hours of every Monday figuring out what went wrong on the Friday night shift. Pull the tote, look at the parts, try to remember which die station was acting up, argue about whether it was the material or the tooling. With automated RCA, the answer is on the dashboard before I get my coffee. The system tells me which stroke the burr started on, what the tonnage was doing at that exact moment, and how many parts are in the affected window. I stopped sorting totes and started preventing the next one.
— Dan Ressler, Plant Manager, Tier 2 Automotive Stamping Facility (Ohio)
reduction in customer-detected PPM on pilot stamping lines within first 90 days of go-live
agreement rate between AI vision classification and human quality auditor verdicts after tuning
fixed-price pilot timeline from line assessment to live automated routing on a single production line
Frequently Asked Questions
Can the vision system retrofit to an existing stamping press without replacing the press or the PLC?
Yes. The cameras, lighting, and GPU appliance mount at the press exit or conveyor discharge and do not require any modification to the press itself. The system reads existing PLC tags via OPC-UA or Ethernet/IP, so there is no need to replace or reprogram the controller. The three-way routing signal writes back to the existing divert mechanism or a new one can be installed as part of the pilot.
How does automated root cause analysis actually identify the cause of a defect?
Every inspected part is time-stamped and correlated with PLC tag data captured at the exact stroke or cycle that produced it. When a defect is detected, the system compares the process conditions at that moment, tonnage, die temperature, feed position, lubrication, to the baseline for good parts. It ranks the deviations and surfaces the most probable cause, along with the exact part window affected. The quality engineer reviews the ranked list instead of starting from a blank sheet.
What happens if the system is not sure whether a part is pass, rework, or scrap?
The classification model outputs a confidence score for each category. Parts below a configurable confidence threshold are routed to a hold or review station for human inspection rather than being automatically passed or scrapped. This prevents false accepts and false scraps during the early tuning period and on edge-case defects the model has not seen before. The reviewed parts are fed back into the training set to improve the model over time.
Does the on-prem GPU inference require an internet connection or cloud subscription?
No. The NVIDIA GPU appliance runs on the plant floor and performs all inference locally. No part images or process data leave the facility. An internet connection is only needed for remote support during the pilot and for model updates, which are pushed on a schedule you control. There is no per-inference cloud fee and no dependency on network uptime for the system to function.
How long does it take to see a return on investment on a single-line pilot?
Most auto parts plants see measurable ROI within 90 days of go-live, driven by scrap cost reduction, reduced sort and containment labor, and lower customer-detected PPM. The exact timeline depends on your line volume, current scrap rate, and defect mix. iFactory builds a line-specific ROI worksheet as part of the pilot scoping process, so you see the projected payback period before committing. Book a pilot scoping call to get a worksheet built for your line.
The Bottom Line on Automated RCA for Auto Parts
Sample-based inspection was built for an era when you could not see every part. Now you can. Automated root cause analysis does not just catch defects earlier, it tells you why they happened and stops them from recurring. Every stamping press and machining cell in your plant produces process data every cycle. The question is whether that data is sitting in a PLC log nobody reads, or whether it is being used to prevent the next bad part. The plants that close that loop are the ones hitting single-digit PPM and keeping their scrap cost under control. The ones that do not are still sorting totes on Monday morning. Book a pilot scoping call with iFactory, or talk to a vision integration engineer to map it against your hardest defect problem.