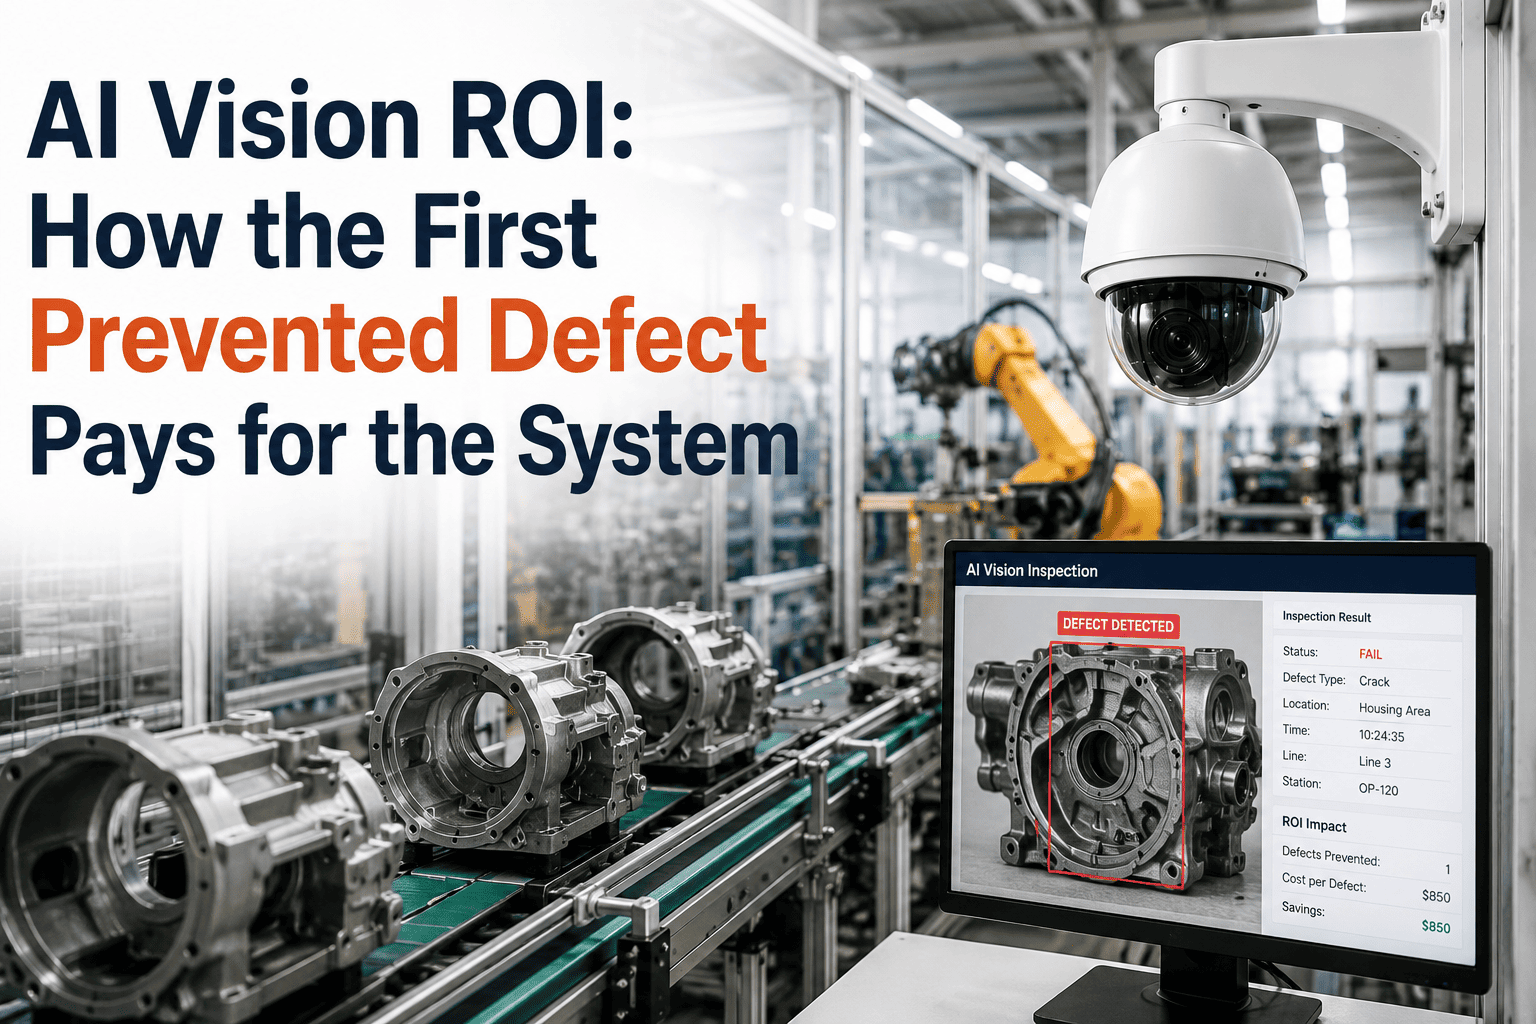
Most plants approve an AI vision system after building a spreadsheet full of assumptions — expected accuracy, projected labor savings, hypothetical scrap reduction. Then the system goes live, and inside the first quarter something else happens: it catches one defect that would have shipped, one recall that would have hit, one bearing failure that would have taken a line down for a day. That single event, on its own, often recovers the entire capital outlay. The rest of the year is compound return. To see the payback math run against your actual defect and downtime numbers, Book a Demo with iFactory AI.
The First Prevented Defect Often Pays for the Entire AI Vision System.
iFactory AI builds the payback case from your real defect rate, scrap volume, warranty exposure, and inspection labor — not industry averages. See exactly what one prevented recall, one avoided warranty spike, or one caught bearing failure would recover on your plant floor.
The 15 to 20 Percent of Revenue Most Plants Never Track Properly
The cost of poor quality (COPQ) sits between 15 and 20 percent of total revenue at a typical manufacturer — and most of that number never appears in a monthly finance report because it is scattered across five different budget lines. AI vision does not reduce COPQ by squeezing a single number. It reduces every category simultaneously by moving detection upstream of every escape point. Here is where the money actually lives before an AI vision system arrives.
Defective parts that get caught in-house — materials, labor, and machine time wasted, plus the disposal or rework cycle to recover what can still be saved.
External failure costs that surface weeks after shipment — return logistics, replacement production, service calls, and the account team hours spent managing the customer relationship.
Manual visual QC teams across three shifts — $38,000 to $52,000 per head fully loaded — catching 70 to 80 percent of defects on a good day and missing the rest.
Provisioned exposure for the single event that has not happened yet — average direct recall cost sits at $10 million, with total business disruption typically 3x to 5x that number.
Long-tail revenue erosion from customer trust damage that never appears in a P&L line — the reason external failures cost 10x to 100x more than internal ones.
Four Real Scenarios Where One Prevented Event Recovered the Full Investment
The clearest way to understand AI vision ROI is not through three-year averages — it is through the specific event categories where one incident recovers the whole system cost in a single afternoon. Below are four scenarios that recur across iFactory-deployed plants, with the recovered value that a single caught event typically represents.
One Prevented Product Recall
Average direct recall cost in FMCG sits at $10 million per event, with total exposure including brand damage and lost orders typically running 3x to 5x that figure. A single caught allergen mislabelling or contaminant event routinely recovers 15 to 30 vision system deployments.
Category: External FailureOne Avoided Warranty Spike
A single stamping-die burr pattern that escapes end-of-line can generate 3 to 8 months of elevated warranty claims across a vehicle model line. Catching the pattern at the stamping station itself prevents the entire tail — typically $1 to $3 million in claims and account-management cost.
Category: Warranty PreventionOne Caught Batch Contamination
A single detected fill-line contamination event, caught by AI vision before batch release, avoids the full quarantine and destruction of a validated lot — typically $500K to $2M per batch depending on formulation, plus the regulatory and validation costs of the investigation.
Category: Batch ProtectionOne Averted Equipment Failure
AI vision catching early bearing wear, belt fraying, or thermal anomaly on a critical asset routinely prevents a full unplanned downtime event. On a mid-size production line, a single 24-hour outage costs $100K to $400K in lost throughput plus emergency labour — recovered by one caught pre-failure signature.
Category: Downtime AvoidanceWhat You Spend Once vs What You Recover Every Single Year
The financial argument for AI vision is not about matching cost against cost — it is about matching a one-time capital outlay against a recurring stream of recovered value. Below is the typical investment side and the typical year-one recovery side for a full-line multi-camera deployment on a mid-size plant.
$180K – $380K Total
$700K – $2.1M+ Recovered
Month-by-Month: The Point Where Recovered Value Crosses the Investment Line
The Forrester Total Economic Impact study on computer vision documents a 374% three-year ROI with an average payback period of 7 to 8 months. iFactory-deployed plants consistently land in that band, with the recovered-value curve crossing the investment line somewhere between month 6 and month 10 depending on defect exposure. Here is how the cumulative recovery typically stacks.
Get the Payback Calculated on Your Own Defect and Downtime Numbers.
Book a 30-minute session with iFactory's manufacturing finance team — walk in with six months of scrap and reject data, walk out with a CFO-ready payback model built from your actual production baseline.
Six Recovery Streams That Show Up Every Single Month After Go-Live
The reason AI vision hits payback so consistently is that recovered value does not depend on any single stream succeeding — six independent recovery channels start producing return the moment the system goes live. Even if two of them underperform expectations, the other four still carry the payback case comfortably.
Scrap Volume Down
100 percent inspection coverage catches defects at the station where they originate. Scrap tonnage typically drops 15 to 20 percent in the first two quarters of production.
Rework Hours Down
Fewer escapes means less end-of-line rework. Rework labour typically drops 30 to 40 percent as upstream stations catch defects before they compound down the line.
Warranty Claims Down
External failure costs drop as escape rate falls. Typical reduction is 25 to 40 percent within the first year, with the full effect landing in year two as the field claim pipeline drains.
Inspection Labour Redeployed
Manual QC teams shift from repetitive visual checking to process improvement and root-cause work. Typical redeployment recovers $90K to $250K per line annually.
Throughput Up
Inspection stops shrinking from bottleneck to background process. Line speed frequently increases 10 to 25 percent as manual inspection ceases to gate throughput.
Unplanned Downtime Avoided
Early detection of thermal, wear, and misalignment signatures prevents cascading equipment failures. Typical avoidance is $110K to $250K per line per year.
Why Year Two and Year Three ROI Grow Faster Than Year One
The 374 percent three-year ROI number is not linear. Year one is largely payback plus a first recovery cycle. Year two adds the compounding effect of models sharpening, additional cameras deploying on the same central server, and the CMMS-integrated maintenance loop reducing failures across the plant. By year three, the marginal cost of every additional deployment approaches zero — but the recovered value keeps compounding.
Payback + First Return
Investment recovered in months 6 to 10. Remaining months deliver the first cycle of scrap, warranty, and labour recovery. Model accuracy climbs from 92 percent at go-live to 98 percent by year end.
Compounding Recovery
Warranty pipeline drains as year-one escapes clear. Additional cameras added to the same central server at 55 percent lower marginal cost. Cross-station correlation cuts root-cause investigation time by 80 percent.
Portfolio Return
Models trained once and reused across parallel lines. Predictive maintenance layer activates on the same edge hardware at near-zero marginal cost. Cumulative three-year ROI lands around 374 percent per Forrester benchmark.
AI Vision ROI — What CFOs and Plant Managers Ask Most
How can one prevented defect really pay for the entire system?
Because external failure costs sit orders of magnitude above internal ones. A defect caught at the inspection station costs roughly $100 to remediate. That same defect reaching a customer costs $10,000 or more once return logistics, replacement production, service calls, and account-management hours are counted. For food recalls, the average direct cost is $10 million; for pharma batch quarantines, $500K to $2M per lot. A single caught event at those scales routinely dwarfs the full deployment cost. To model a specific event category for your plant, book a payback session.
What is the realistic payback period for an iFactory deployment?
Between 6 and 12 months for mid-size plants, with 7 to 8 months as the documented industry average per Forrester's computer vision TEI study. High-volume lines with visible defect exposure and clear scrap-cost baselines often break even in under 6 months. iFactory builds the payback model from your six-month scrap and reject baseline, so the projected timeline is derived from your actual production data rather than industry averages. To walk through the model on your numbers, reach out to our finance team.
Where does the year-one recovery typically come from?
From six independent streams — scrap reduction, warranty avoidance, inspection labour redeployment, throughput gains, downtime avoidance, and rework hours. Typical mid-plant deployments recover $700K to $2.1M in year one against a $180K to $380K one-time investment. The recovery does not depend on any single stream succeeding; even if two channels underperform expectations, the other four typically carry the payback comfortably. For a stream-by-stream walkthrough on your plant, book a demo.
Why does ROI grow in year two and year three instead of tapering?
Because model accuracy sharpens with production data, additional cameras deploy on the same central server at 55 percent lower marginal cost, and the warranty pipeline drains as year-one escapes work through the field. By year two, predictive maintenance activates on the same edge hardware at near-zero marginal cost. By year three, models trained once get reused across parallel lines, driving the cumulative three-year ROI to the documented 374 percent Forrester benchmark. To review the compounding model, contact our team.
How does iFactory build the ROI model versus generic industry calculators?
iFactory pulls your actual six-month scrap tonnage, reject rate, warranty spend, and inspection labour cost as the baseline — then projects reduction against that specific baseline rather than an industry average. The output is a CFO-ready summary with scrap value, downtime avoidance, labour efficiency, throughput gain, and payback period, suitable for board presentation or capital appropriation request. Delivered inside a 30-minute demo session. To schedule the model build, book a demo.
AI Vision Is Not a Cost Line. It Is a Prevention Instrument With a Documented Return.
The strongest argument for AI vision is not the three-year ROI number, and it is not the payback period. It is the shape of the return: a one-time capital outlay against a recurring stream of recovered value that compounds every year the system runs. The plants that approve AI vision as a prevention instrument rather than a technology purchase see the cleanest numbers — because they measure the right thing, which is what did not happen. Recalls that did not fire. Warranty spikes that did not materialise. Line failures that did not take a shift down. iFactory builds the entire case from your real production baseline and delivers it in a form your CFO can defend.
Get a CFO-Ready ROI Model Built From Your Plant's Real Numbers.
Book a 30-minute session with iFactory's manufacturing finance team — scrap value, downtime avoidance, labour efficiency, throughput gain, and payback period all calculated against your six-month production baseline, delivered as a board-ready financial summary.