Every AI vision pitch lands on the same slide — 99% accuracy, six-month payback, seven-figure annual savings. Then peer-reviewed research surfaces the harder number: a January 2026 study in the journal Sensors found that 77% of AI vision pilots in automotive manufacturing never reach full deployment. The gap is almost never the model — it is a business case built on averages instead of your plant's actual scrap rate, rework cost, inspection labor, and safety incident load. This page walks through the four-input ROI framework the successful 23% use, with the industry-benchmarked defaults you can plug against — quality savings, labor reallocation, safety avoidance, and payback timing. For a modeled calculation on your own numbers, book a 30-minute ROI walkthrough.
ROI Calculator Framework
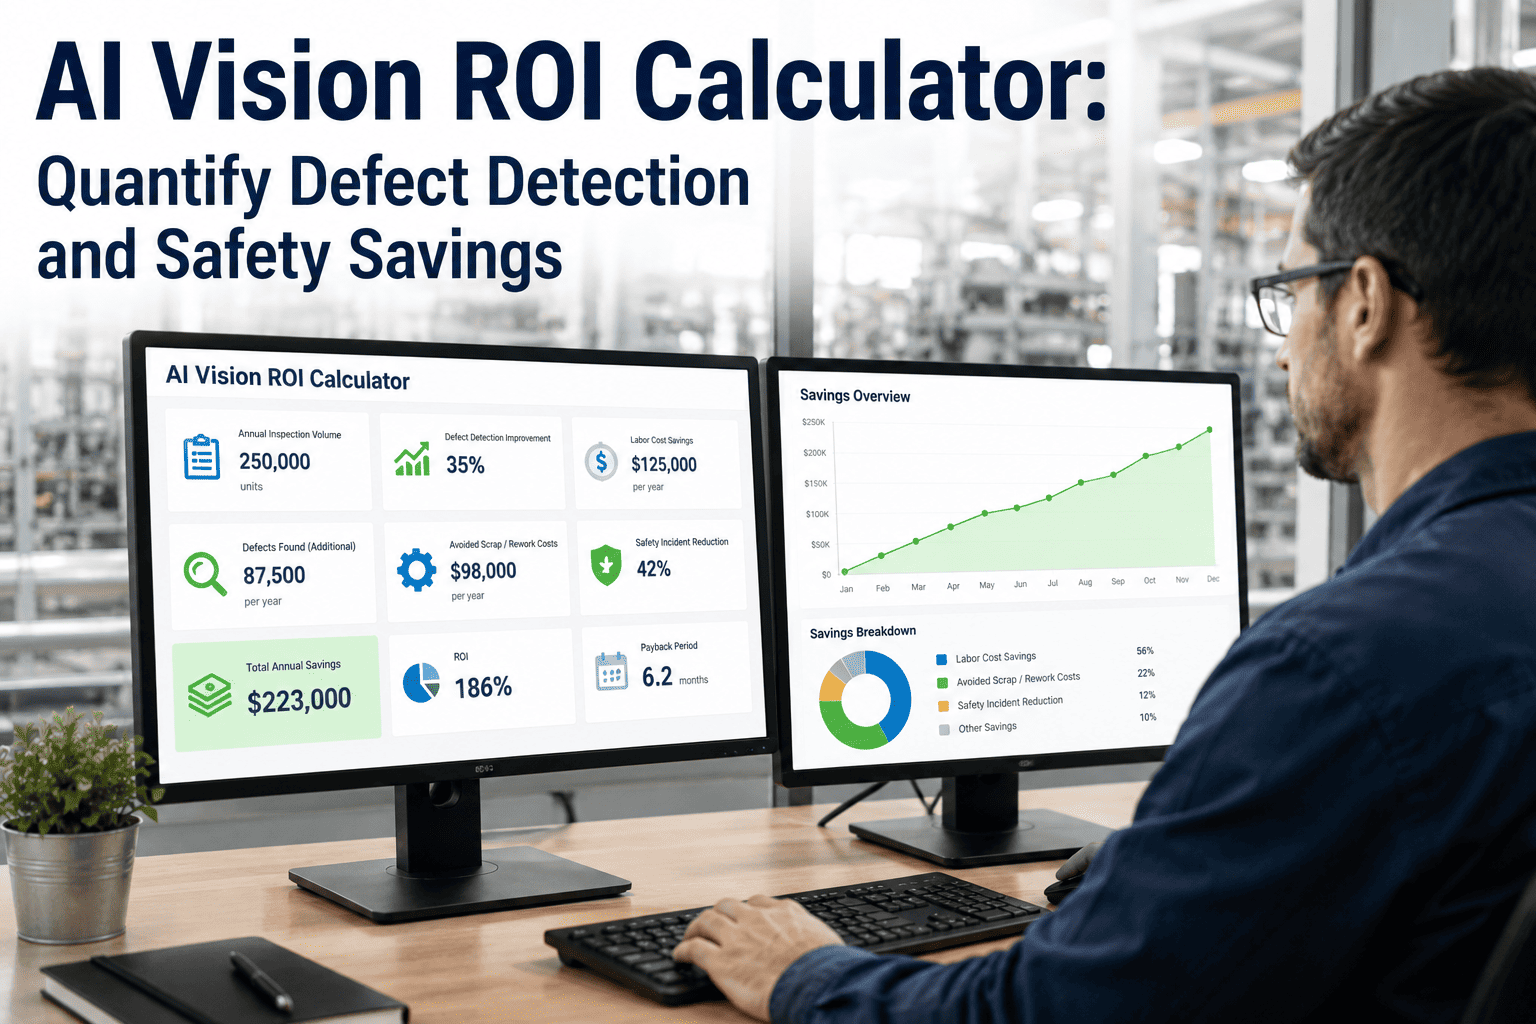
AI Vision ROI Calculator — Quantify Defect Detection, Labor, and Safety Savings
A structured framework to model the return on AI vision inspection using four inputs from your plant. Built on Forrester's 374% three-year ROI benchmark and 7-8 month payback median, calibrated with the pitfalls that stall 77% of pilots.
The Four Inputs Every Honest ROI Calculation Uses
An AI vision ROI model that skips any of these inputs is either overstating the return or hiding a real cost. The framework below is what quality and finance leaders build the business case around before capital request. Numbers are averages from published industry benchmarks — replace with your own for a real answer.
The Formula That Ties It All Together
The math is straightforward once the four inputs are on the table. Every AI vision ROI calculation reduces to the same structure — sum the annual benefit across the three savings buckets, divide by total investment, and multiply by twelve for payback in months.
Worked Example — $50M Manufacturer, Three-Shift Line
The four inputs applied to a representative $50M annual revenue manufacturer running a three-shift production line with four quality inspectors per shift. Numbers are directional — plug your own to move any lever.
Modeled Annual Benefit
Quality savings — 30% of $10M COPQ
$3.0M
Labor savings — 70% redeployment
$378K
Safety savings — 3 incidents avoided
$540K
Annual benefit$3.92M
Payback period0.8 months
Three-year ROI4,608%
Quality Savings — The Largest Bucket, Broken Down
Quality savings are almost always the biggest lever in an AI vision ROI model, and also the most under-counted line item in manual-inspection budgets. The four sub-categories below decompose the bucket so procurement can size each on your line.
$3.0M
Scrap Reduction
Defects caught at the first station instead of assembled into three-stage waste. Catches at 99% vs 80% manual accuracy prevents cascading scrap up the value chain.
Rework Elimination
Every defect escape triggers rework labor, expedited shipping, and line disruption downstream. AI catches the same defect at line speed for effectively zero marginal cost.
Warranty and Returns
A defect that reaches the customer costs 100-1,000x the station-level rework figure. Cutting escape rate from 20% to 3% directly shrinks the warranty and returns budget.
Throughput Gain
100% inline inspection removes the manual bottleneck that used to force a throughput-vs-quality trade. Deployed cases document 30-35% line-speed lifts.
Model Your Own Numbers
Bring your scrap rate, inspection labor, and incident history — we'll model payback and three-year ROI in 30 minutes.
Safety Savings — The Line Item Most Buyers Leave Off the Model
Every AI vision ROI model that ignores the safety bucket is understating return by hundreds of thousands of dollars per year. OSHA's own Safety Pays methodology multiplies direct incident cost by 4-10x for the true indirect load — the number never on the safety budget line, but always paid by the P&L.
$40K-$150K
Direct cost per recordable incident
Medical, workers' comp, immediate response
4-10x
Indirect cost multiplier
Productivity, investigation, insurance, litigation
Up to 77%
Incident reduction with AI monitoring
Documented across published safety deployments
$1.1M
Documented single-facility annual savings
Americold 500K sq ft AI safety deployment
Why 77% of Pilots Never Reach Payback — and How to Avoid Joining Them
The Sensors journal survey did not blame the models. It found that the 77% of AI vision pilots that stalled failed on the same set of business-case pitfalls. Each one is the difference between a modeled ROI and a realized one.
Pitfall 01
No Baseline Measurement
Pilots launched without a documented pre-deployment escape rate, scrap cost, and inspection labor number cannot prove savings after. The "before" measurement is not optional.
Pitfall 02
Averages Instead of Plant Numbers
A business case built on industry-average COPQ misses the plant's actual defect profile by a wide margin. Real inputs beat benchmark inputs on every dimension.
Pitfall 03
Safety Bucket Left Off the Model
Skipping the incident-avoidance line item routinely understates ROI by $200K-$600K per year on a plant with 3-5 annual recordables. Include it or lose the number.
Pitfall 04
Success Criteria Verbal, Not Written
Pilots without written go-live criteria on accuracy, false positive, and integration depth die in extended trials. Signed acceptance turns the pilot into a project.
The Payback Timeline You Should Expect
The Forrester-benchmarked 7-8 month payback is a median, not a guarantee. The timeline below traces how the numbers compound when the four inputs are honest and the pitfalls above are avoided.
M 0-1
Baseline captured, single-line pilot deployed, model tuned on plant defect samples. Investment committed; benefit hasn't started yet.
M 2-4
Escape rate drops from 20% to under 3%. Rework savings and warranty avoidance begin accruing. Inspector reallocation locked in.
M 5-8
Cumulative savings cross investment. Payback achieved on schedule. Business case validated; capital request approved for line-two rollout.
M 9-36
Safety incidents drop as PPE and hazard monitoring compound. Three-year ROI lands in the 300-400% range on the Forrester benchmark, higher with plant-specific inputs.
Frequently Asked Questions
Is a 374% three-year ROI actually realistic, or is that vendor marketing?
The 374% figure comes from a Forrester Consulting study across AI vision deployments, with 7-8 month payback as the median. It is a real number, but it is also a median — plants with high scrap rates, heavy inspection labor, and elevated incident histories routinely exceed it, while low-volume operations under 200 parts per day may not clear it at all. The point of the four-input framework is to model the honest number for your line rather than accept or dismiss a headline benchmark. To run the model on your numbers,
book a walkthrough.
How do we handle the safety savings input without overclaiming?
Use your own OSHA 300 log for the last three years — count the recordables, apply the direct cost range ($40K-$150K depending on severity), then apply OSHA's own indirect multiplier of 4-10x. The result is the annual incident cost that never appears as a line item in your budget but represents real dollars the business absorbs. Modeling a conservative 40-60% incident reduction (below the 77% documented case) keeps the number defensible in front of finance. For help sizing it credibly,
reach out to a specialist.
What deployment cost should we plug in for the investment line?
Single-line pilot deployments typically land in the $50K-$150K range for hardware, software, and integration — with complex multi-camera stations reaching $200K. Camera-agnostic platforms that run on existing IP cameras cut hardware cost substantially. If you factor in ongoing maintenance and retraining, add 15-22% of the initial license per year. A modeled quote against your specific station count and integration complexity is available if you
book a demo.
Our plant volume is under 200 parts per day — does AI vision still pay back?
Usually not on quality savings alone. Below 400-600 parts per day the AI capex struggles to recover from limited unit volume, and manual inspection often keeps the ROI edge. The exception is a plant with high safety incident cost, high per-unit value, or high customer escape penalty, where the savings buckets add up even without high volume. An honest fit assessment on your line takes about 30 minutes to walk through with a specialist —
start there rather than assume the answer.
How do we make sure we are not part of the 77% that never reach payback?
Four steps separate the 23% who ship from the 77% that stall. Document baseline scrap, escape rate, and inspection labor before pilot goes live. Model the business case on plant-specific numbers rather than benchmark averages. Include the safety-avoidance line item in every finance conversation. Write success criteria on accuracy, false-positive rate, and integration into the SOW before signing. A pilot with all four in place is a project with a payback date; one without is an experiment with a shutdown date. To structure it properly from the start,
book a demo.
Run the Full Calculation on Your Line
Turn Your Scrap, Labor, and Incident Numbers Into a Modeled ROI in 30 Minutes
Bring your last quarter's scrap rate, inspection payroll, and OSHA 300 log. A vision engineer will build the three savings buckets against your production volume, plug your camera and integration requirements into the investment line, and hand back a payback date and three-year ROI you can put in front of finance the same week.
374%
Forrester 3-year ROI
30 min
Custom walkthrough