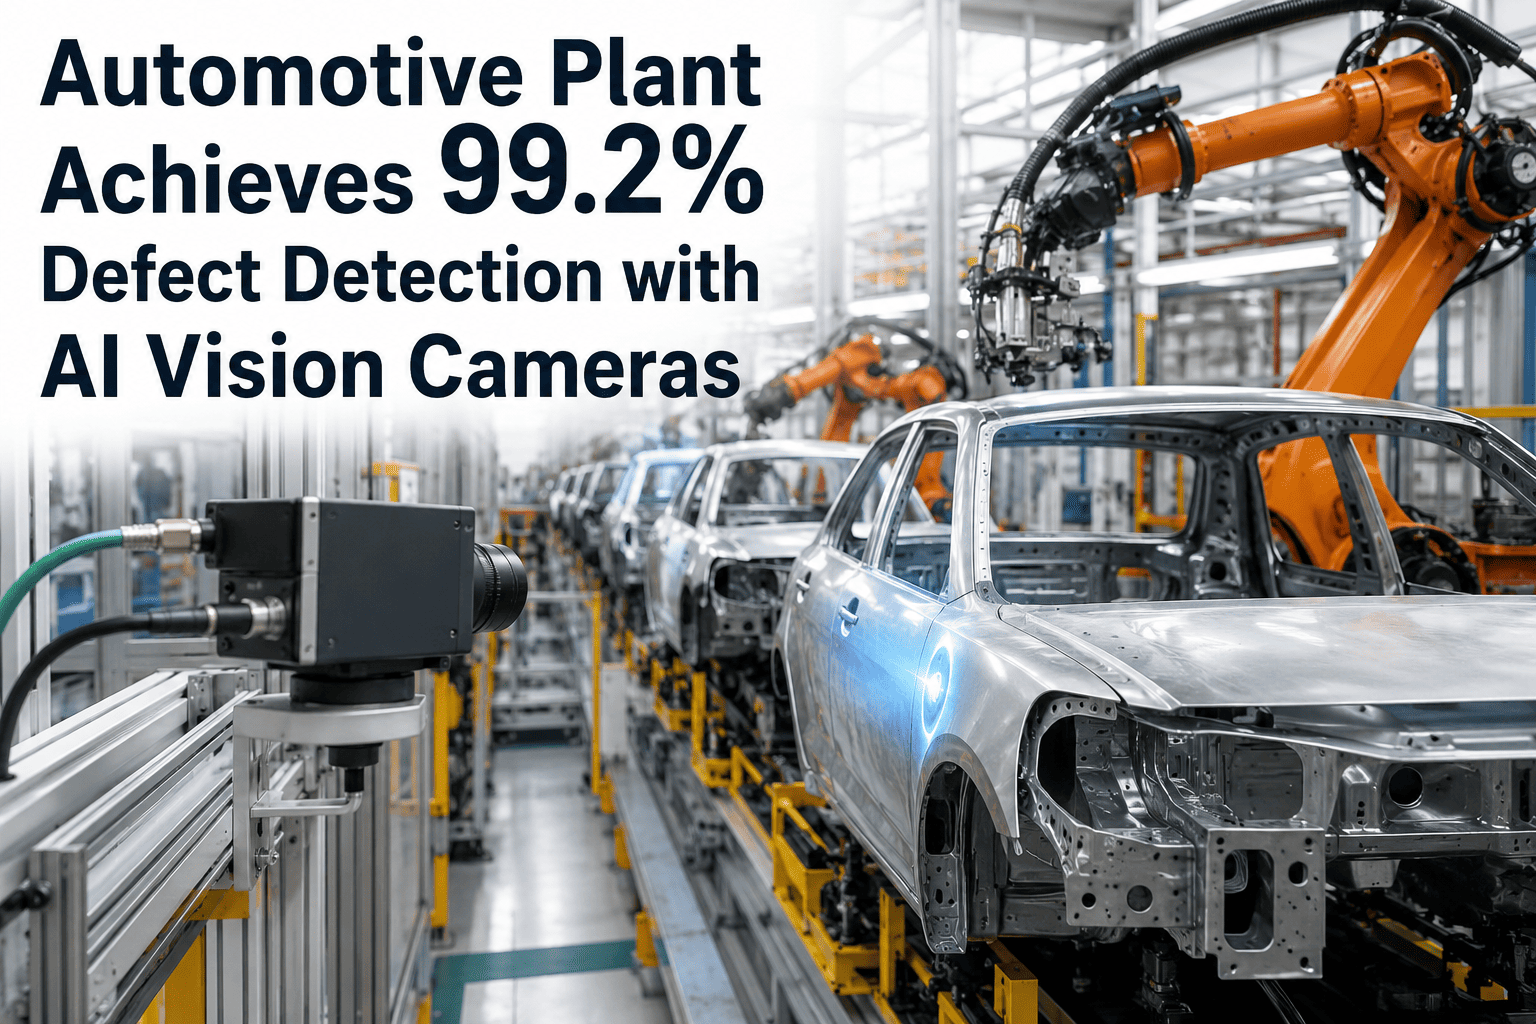
Audi's Neckarsulm plant destroys one complete A8 body per shift on a peel-test rig to prove that 3,200 aluminium spot welds meet crash-integrity specification. At $85,000 per sacrificed body across two shifts a day, that's roughly $62 million a year in destructive validation — a cost that exists purely because sample-based QC cannot inspect every weld inline. That number is the clearest lens on why automotive weld inspection is being rebuilt around AI vision: the alternative to inline verification is either destroying finished bodies to prove the process is capable, or accepting that 98% of welds ship without individual verification and hoping warranty data doesn't reveal what sampling missed. Neither posture survives modern OEM scorecard pressure or IATF 16949 surveillance audit rigour. Automotive quality teams scoping a shift from sampling to 100% inline verification typically begin with iFactory's weld vision engineering team to map their specific weld mix, defect priorities, and MES architecture against a phased deployment plan.
Weld QC · Real-Time Vision · IATF 16949
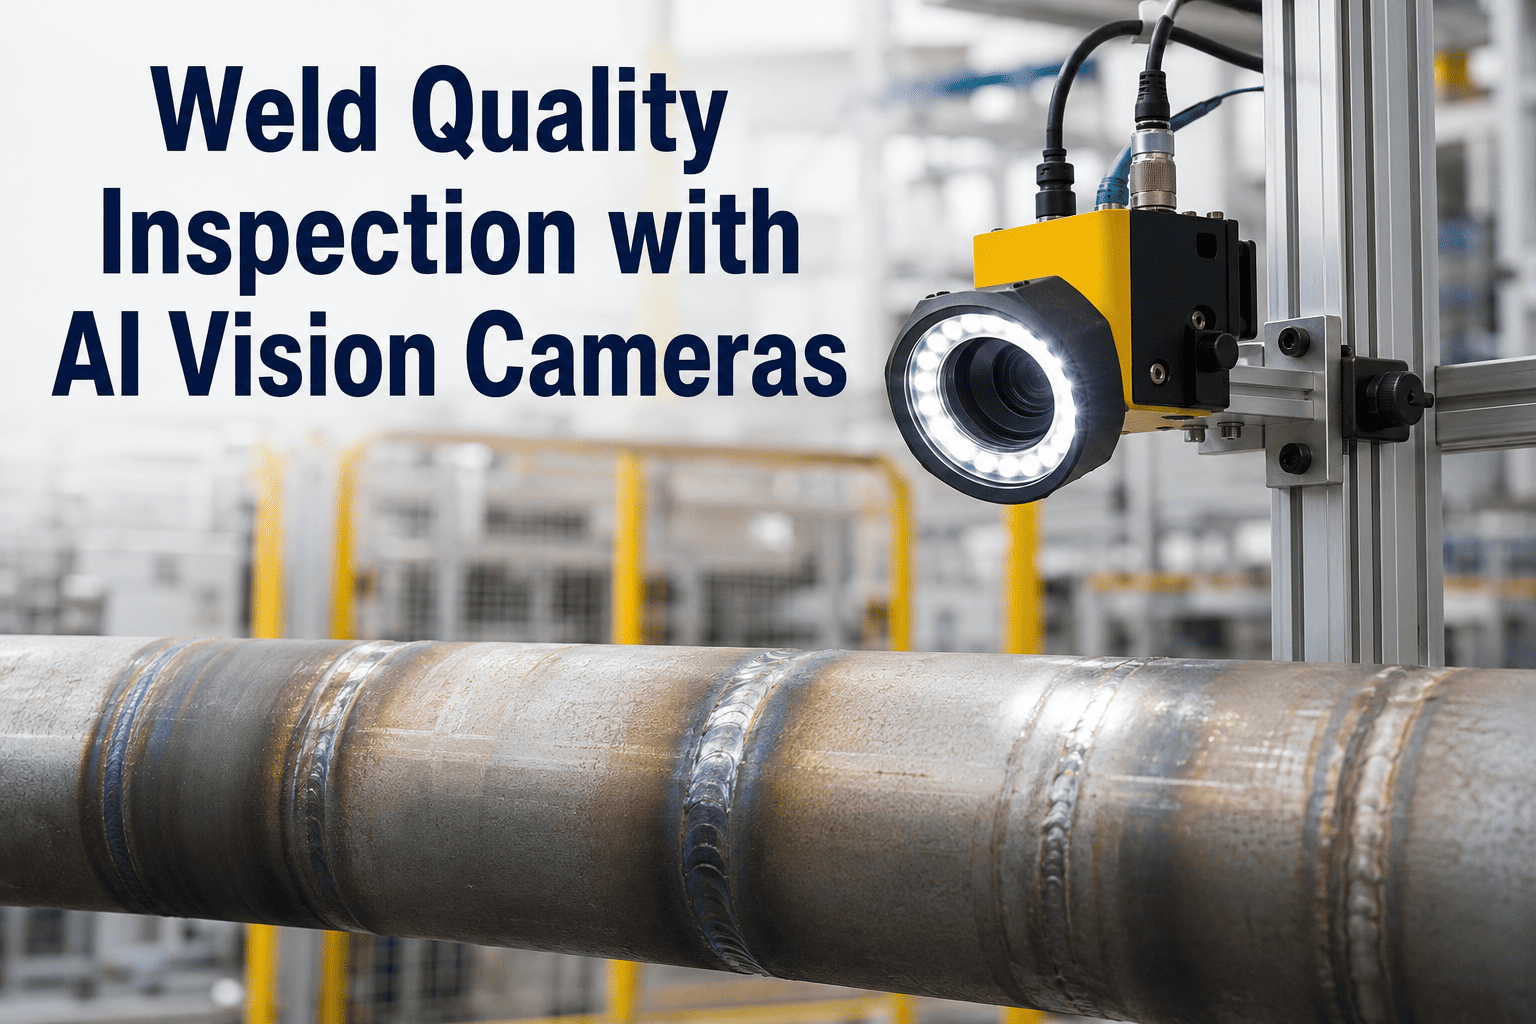
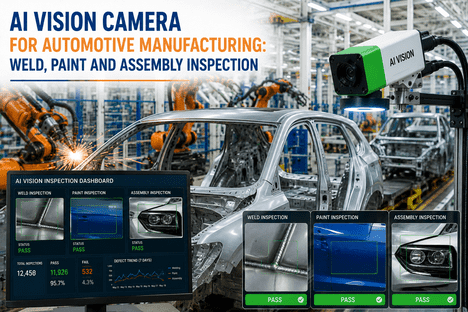
AI Vision for Weld Quality Inspection in Automotive Manufacturing
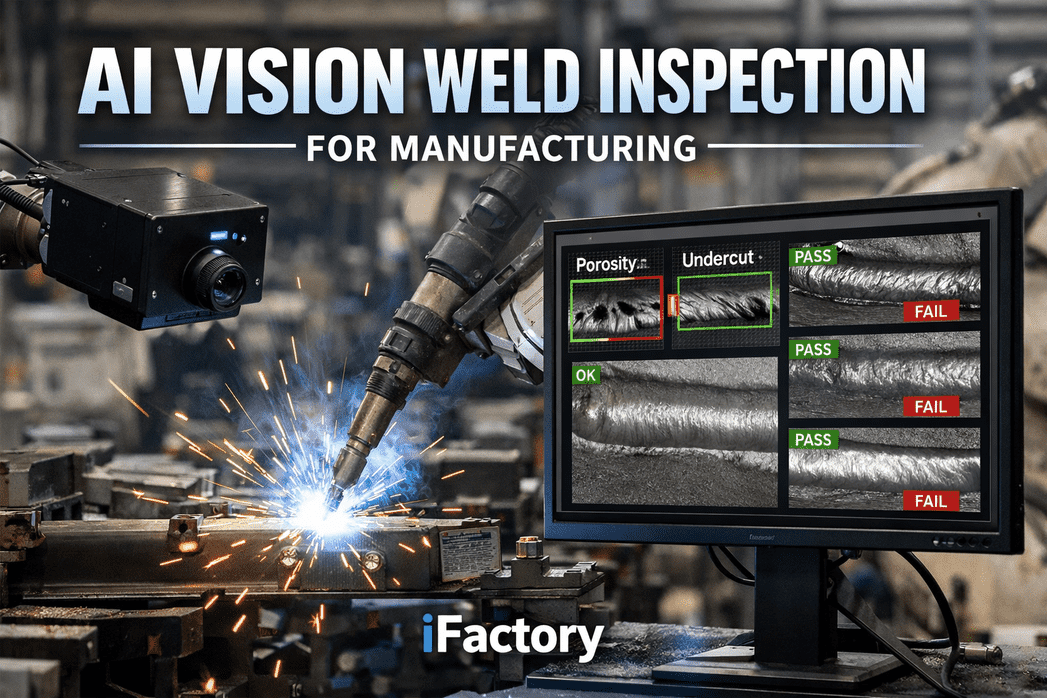
Catch porosity, cracks, undercut, spatter, and incomplete fusion at the welding station — before the body advances, before rework costs multiply by 10x, before a warranty claim writes the defect into your OEM scorecard. Purpose-tuned vision models for resistance spot, MIG, TIG, and laser welding, deployed inline on NVIDIA edge hardware with MES-linked traceability to VIN.
Defect Severity Board · Live Line View
Critical
Cracks · Missing Nugget
Auto-reject · Rework routing · Root cause flagged
Major
Incomplete Fusion · Undersized Nugget
Hold for review · Weld parameter alert
Minor
Porosity · Undercut · Heavy Spatter
Logged · Trend-tracked · SPC data updated
Pass
All acceptance criteria met
Continue · VIN-linked record archived
The Body-Shop Arithmetic
Every Modern Vehicle Body Is A 4,000-Weld Structural Assertion
A modern passenger vehicle body is held together by between three and five thousand welds — resistance spot on the floor pan, roof, side frame, and closures; MIG seam on subframes and reinforcements; laser stitch on tailored blanks; TIG on precision joints. IATF 16949 requires every one of them to meet structural integrity criteria before the shell advances to paint. The failure mode that makes weld QC so hard isn't that defects are rare — it's that they occur regularly as electrode tips wear, gas pressure drifts, sheet-metal supplier lots vary, and fixturing tolerances stack across a shift. The visualisation below is the coverage arithmetic that any automotive quality leader can recognise from their own line.
Weld Population Per Vehicle · Where Coverage Concentrates
MIG Seam Length (m)
40–90
Destructive Peel Samples
2%
AI Vision Inline Coverage
100%
The gap between 2% destructive sampling and the actual weld population is where warranty exposure lives. Every weld in that gap ships without individual verification unless the process shifts to inline inspection.
The Cost Trajectory Nobody Wants To Present To Finance
$13.4 Billion In US Passenger Vehicle Warranty Claims — And Climbing
Warranty payouts aren't a static cost line. They're a rising one. US passenger vehicle manufacturers paid $13.4 billion in warranty claims in 2025, up 8% year-over-year — the third consecutive annual increase. Industry data indicates 15–20% of automotive structural warranty claims originate from weld quality defects that escaped production inspection. The timeline below is the trajectory quality VPs are asked to bend.
With Inline AI
Weld defects caught at source
Every weld caught at the station is a warranty claim that never gets filed, a customer interaction that never happens, and an OEM scorecard entry that stays clean.
Defect Fingerprint Library
What Every Defect Looks Like, Why It Happens, How Vision Catches It
Each weld defect carries a distinct visual signature, a distinct root cause in the process, and a distinct downstream consequence if it escapes. The fingerprint library below is the atlas iFactory's vision models are trained against on every automotive deployment — the three-part triad (Signature / Cause / AI Detection) is how the model separates a real defect from harmless cosmetic variation on a healthy bead.
Signature
Round voids scattered along the bead surface or embedded below, cluster patterns visible under oblique lighting
Cause
Shielding gas drift, wire moisture, base metal surface contamination, insufficient purge on TIG
AI Detection
Bead segmentation isolates the weld pool; texture classifier counts void density and flags clusters above ISO 5817 quality-level threshold
Signature
Linear discontinuity along or across the bead, hair-thin, often only visible under angled light and high magnification
Cause
Rapid cooling, high joint restraint, hydrogen embrittlement, incompatible base metal chemistry
AI Detection
Edge-detection kernels trace linear anomalies against the healthy bead grain; classifier separates a true crack from mill-scale artefact or cosmetic scratch
Signature
Groove or channel along the weld toe where base metal has melted away without being backfilled by the weld pool
Cause
Excessive current, incorrect travel angle, arc length too long, torch technique drift on manual stations
AI Detection
Profile depth measurement along the toe line; classifier flags any undercut depth exceeding AWS D1.1 Table 6.1 acceptance limits
Signature
Molten droplets fused to the base metal adjacent to the weld bead, ranging from fine speckle to heavy accretions
Cause
Current setting too high, wire feed instability, gas coverage issues, contaminated or oily base metal surface
AI Detection
Object detection identifies spatter accretions in the exclusion zone around the weld; density heat-map flags stations trending high
Signature
Lack of bonding between weld metal and base metal, or between passes — the joint looks welded but carries little load capacity
Cause
Insufficient heat input, poor joint access, wrong electrode angle, contamination between passes
AI Detection
Fusion-line detection combined with thermal imaging where available; classifier flags cold-lap patterns and boundary discontinuities
Signature
Spot weld with no visible nugget indentation or nugget diameter below the IATF acceptance threshold for the joint class
Cause
Electrode tip wear, tip misalignment, weld current drop, force setting drift, sheet gap during weld cycle
AI Detection
Nugget diameter and indentation depth measured on every spot; missing-nugget classifier flags the joint before the shell advances
One Shift, Two Realities
What Happens Across Ten Hours When The Inspection Method Changes
Every quality manager who has run a night shift knows the fatigue curve. Detection accuracy on manual visual inspection starts around 78–80% at the shift open and drops to 68% by hour ten as inspector attention degrades. AI vision doesn't have a fatigue curve. The comparison below is the same production window, viewed through both inspection methods, on a typical body-in-white line running 60 units per hour.
Manual Visual + Sample Peel Test
Hour 1
Accuracy 80% · Fresh inspector · Sample cadence hits target
Hour 4
Accuracy 75% · Attention drift · Between-sample gaps growing
Hour 7
Accuracy 71% · Fatigue visible · Peel test lag rising
Hour 10
Accuracy 68% · Night shift low point · Escape risk peak
Outcome: Variable coverage · Sample gaps · Escapes concentrated in low-attention windows
AI Vision Inline Verification
Hour 1
Accuracy 99.3% · Every weld inspected · VIN-linked log opens
Hour 4
Accuracy 99.3% · Electrode wear trend emerging · Alert queued
Hour 7
Accuracy 99.3% · Predictive tip change recommended · Line uninterrupted
Hour 10
Accuracy 99.3% · Shift-end SPC report auto-generated
Outcome: Constant coverage · Zero between-sample gaps · Escapes eliminated across the shift
See Real Body-Shop Footage · Live Classification
Watch A Missing Nugget Get Caught At Robot Cell 12 And Divert The Body In 280ms
Book a live walkthrough with iFactory's automotive weld engineering team. See porosity, undercut, and missing-nugget detection running on real body-shop footage — with MES linkage to VIN, per-station defect Pareto, and closed-loop feedback to welding parameters. 30 minutes, your specific weld mix, real deployment architecture.
Cell Architecture
Inside A Weld Station: What Sits Where, And Why It Matters
The value of inline weld vision depends on what physically sits at the cell — camera placement, lighting geometry, edge inference hardware, and the network path to the PLC and MES. Below is the anatomy of a typical AI-instrumented weld cell on an automotive body line, and what each component is doing when the arc strikes.
A
High-Resolution Cameras
Mounted around the weld cell at process-specific angles. Spot needs oblique-angle nugget contrast; laser needs high magnification for micro-defects; MIG needs full-seam field of view. Trigger on arc-off signal, capture bead under controlled lighting.
B
Controlled Lighting Rig
Structured lighting eliminates the shadow variance that would otherwise degrade classifier accuracy. Wavelength and geometry tuned to the specific weld process — cool white for surface defects, oblique bright for nugget indentation.
C
NVIDIA Edge Inference
On-premise GPU server pre-configured to the plant's weld volume. Runs bead segmentation, defect classification, and severity scoring in under 280 milliseconds per weld — inside the transfer window before the shell reaches the next station.
D
PLC Handshake
Pass/fail decision sent to the transfer PLC via OPC-UA, EtherNet/IP, or Profinet. Fail signal triggers reject gate, diverting the body to rework with defect location, type, and severity pre-loaded on the rework operator terminal.
E
MES + Traceability Layer
Every inspection event linked to VIN, robot ID, electrode tip cycle, current/time/force parameters, and material lot. Feeds IATF 16949 traceability records, defect Pareto dashboards, and root-cause analytics.
KPI Impact Meter
Where The Numbers Move In The First 90 Days Of Inline Verification
Weld vision moves multiple quality and cost metrics simultaneously, and the impact shows up on the dashboard well inside the first quarter of operation. The meter panel below is the impact pattern iFactory's engineering team consistently observes across automotive deployments — sorted by how quickly the metric moves after go-live.
37%
Weld defect reduction
Within 12 months
The BMW benchmark — sustained across European lines after full inline verification rollout across body shops.
94%
Downstream weld failure drop
Within 6 months
Defects caught at the station don't propagate. Downstream detection rates fall as inline coverage matures.
99.3%
Inline detection accuracy
Post model tuning
Across porosity, spatter, fusion, and nugget defects on spot, MIG, TIG, and laser welds under production lighting.
100%
Weld coverage per vehicle
Day one
Every nugget, seam, and stitch inspected — replacing the 2% destructive sampling that shipped 98% of welds unverified.
280ms
Decision latency to PLC
Real time
Well inside the transfer window between stations — the reject gate fires before the shell reaches the next weld cell.
4 mo
Payback period
Typical automotive line
ROI achieved through defect reduction, destructive test elimination, and warranty exposure compression combined.
Where Vision Concentrates On A Body Line
Four Automotive Weld Scenarios Where Inline Verification Pays Back First
Not every weld station on an automotive line carries the same defect exposure. Some produce hundreds of critical structural welds per shell; others produce cosmetic welds where escape consequence is lower. Vision deployments concentrate first where the failure math is most punishing — the four scenarios below are where iFactory typically starts on a body-in-white rollout.
S1
Floor Pan & Underbody Structural Spots
Highest structural stakes on the vehicle. Underbody spots carry crash load and IATF supplemental criteria are aggressive. Missing or undersized nuggets here are directly linked to crash performance and recall exposure — inline nugget diameter measurement pays back first here.
S2
Side Frame & B-Pillar Reinforcement Welds
Side-impact protection depends on these joints. Mixed material combinations (steel, high-strength steel, aluminium in some models) mean electrode wear accelerates and current-force windows tighten. Vision catches the wear signature before it produces escaped defects.
S3
Roof-To-Body-Side Laser Stitch Joints
Increasingly common on modern platforms. Micro-cracks and keyhole porosity occur at scales invisible to standard cameras and always invisible to naked-eye inspection. High-magnification vision on the laser weld is the only inspection method that scales with production speed.
S4
Subframe & Chassis MIG Seam Welds
Long-duration continuous welds where wire feed instability, gas drift, and travel-angle variation compound over the seam length. Bead ripple pattern classification catches drift in the first few centimetres — often before the operator or the wire feed diagnostics register anything.
Standards Alignment
Every Weld Record Structured For The Audit Before The Auditor Asks
Automotive weld vision isn't just about catching defects — it's about producing the audit-ready record that IATF 16949 surveillance, OEM supplier reviews, and warranty investigations depend on. The comparison table below maps the standards iFactory's platform is engineered to satisfy out of the box.
| Standard |
Scope |
What The Vision System Produces |
| IATF 16949 |
Automotive quality management |
Per-weld inspection records linked to VIN, robot ID, and process parameters. SPC data auto-generated per shift, MSA records structured for surveillance audit. |
| AWS D1.1 |
Structural welding code (steel) |
Table 6.1 acceptance criteria programmed into classification thresholds — undercut depth, porosity size and distribution, crack tolerance, profile requirements. |
| ISO 5817 |
Quality levels for fusion welds |
Configurable per joint at level B, C, or D. Severity thresholds mapped to the ISO 5817 language customers audit against, exportable in reviewer-ready format. |
| ISO 3834 |
Quality requirements for fusion welding |
Process monitoring and inspection record requirements satisfied automatically via the vision system's per-weld log — no operator data entry burden. |
| ASME IX |
Welding procedure qualification |
Welder and procedure performance data — actual defect rates per welder, per procedure, per material combination, with supporting imagery for qualification review. |
| OEM Supplements |
Customer-specific criteria |
Configurable per customer, per joint class. A Tier 1 supplying multiple OEMs runs one platform against multiple criteria sets simultaneously. |
Turnkey Deployment
Racked, Cabled, And Live In 6–12 Weeks — Not 18 Months Of Pilot
Weld vision projects stall when the buying centre has to procure cameras, GPU servers, integration engineers, and defect libraries separately. iFactory delivers the whole stack as a bundle — pre-configured NVIDIA AI server that ships racked and ready, camera hardware selected for the specific weld process, engineering scope covering cabling, network, PLC and MES integration, and operator training. Rack it, plug in power and Ethernet, and the AI is live. 24×7 remote monitoring after go-live maintains model accuracy as production conditions evolve.
Weeks 1–4
Site Survey & Baseline
Weld station audit, camera placement engineering, defect library seeded with reference imagery from your specific weld mix. NVIDIA AI server pre-configured to production volume.
Weeks 5–8
Install & Integrate
Cameras mounted, edge server racked and cabled, PLC handshake commissioned, MES linkage tested. Vision models calibrated against your first weeks of production data.
Weeks 9–12
Go-Live & Tune
Full inline verification active, operator training complete, first defect Pareto and process capability reports live. 24×7 remote monitoring maintains accuracy as production evolves.
1000+ manufacturing clients
99.9% uptime SLA
On-prem NVIDIA GPU
IATF 16949 audit-ready
SAP & MES integrated
Field Perspective
"
The way I frame weld vision with automotive quality VPs is that the physics of resistance spot welding haven't changed, but the arithmetic of verifying them has become impossible without inline vision. When body shops ran at forty units per hour with 2,000 spot welds per vehicle, sample-based peel testing was defensible statistics — you were verifying enough of the joint population to draw meaningful inference about the rest. At sixty-plus units per hour with 3,500 welds per vehicle and mixed material joints that push electrode wear windows in unpredictable ways, that same statistical logic collapses. You're extrapolating from single-digit-percent coverage to structural claims about the whole population, and the warranty data eventually surfaces what the sample missed. The other conversation I find myself having with quality leaders is that vision changes the character of the discussion with your OEM customer. Instead of walking into a supplier review with sampling records and process capability estimates, you walk in with per-weld imagery, VIN-linked classification records, and defect Pareto data broken down by robot, shift, and material lot. The audit conversation becomes evidence-based instead of assurance-based. And the internal conversation with your welding engineers becomes data-driven instead of intuition-driven — you can actually see which robot cell is drifting, which electrode change interval is optimal, and which material lot combinations produce the highest defect rates. That's the transformation that makes weld vision an operational programme instead of just another inspection tool.
Rajesh Villanueva-Okonkwo
Automotive Weld Systems Director · 21 years across body-in-white QC engineering, Tier 1 supplier qualification, IATF 16949 lead auditor certification, and AI vision programme deployment at three continental OEMs
Frequently Asked Questions
What Automotive Quality Engineers Ask Before They Deploy
Does AI vision fully replace destructive peel testing on structural spot welds?
On most body-in-white deployments, AI vision replaces the sampling logic that required peel testing in the first place — because destructive testing exists specifically to infer population quality from a sample, and 100% inline verification removes the need for that inference. Some OEM supplemental criteria still require periodic peel test correlation to validate the vision system's classification against destructive results, which is fully supported. The typical trajectory is peel test frequency drops significantly in the first six months as correlation is established, and further as model confidence matures across shifts.
Talk to weld vision engineering about your specific OEM supplement criteria and current peel test cadence.
How accurate is the classification on real body-shop footage versus lab conditions?
Well-trained weld vision models operate in the 97–99% detection accuracy band on real body-shop footage once tuned against site-specific imagery — the specific weld process, base metal, lighting geometry, and background clutter of your line. Early false-positive rates typically resolve within the first weeks of deployment as edge cases get labelled back into the training set. Accuracy continues improving through continuous learning from production data, with mature deployments approaching 99.7% classification accuracy after twelve months of accumulated site-specific training. The system is tuned to err toward flagging ambiguous cases for review rather than passing them silently, so any drift in performance surfaces as extra review flags rather than escaped defects.
Can the platform integrate with our existing MES, PLC, and quality management infrastructure?
Yes, and this integration is where the operational value concentrates. Standard REST APIs and industrial protocols (OPC-UA, EtherNet/IP, Profinet) handle the PLC handshake for reject-gate control and the MES linkage for VIN-level traceability. Every inspection event is transmitted with defect classification, severity score, annotated image, timestamp, robot ID, welding current/time/force parameters, and material lot — structured for direct ingestion into the plant's quality management system. Integration is completed during deployment engineering and doesn't require modifications to the existing MES or PLC infrastructure.
Book a demo to walk through the integration architecture for your specific line configuration and system landscape.
Will the vision system slow down our line speed or become a production bottleneck?
Inference runs on on-premise NVIDIA GPU hardware at the edge of the line, keeping the entire capture-classify-decide loop under 300 milliseconds per weld. Decision latency to the PLC reject gate is well inside the transfer window between stations, so the vision system never becomes the constraint on line speed. On multi-station body shops, each cell runs its own edge inference — parallelism scales with the number of weld cells rather than concentrating on a single central server. Throughput of 150 weld seams inspected in 40 seconds is typical, with headroom for line speed increases without hardware changes. The system was engineered from the start for takt-time compatibility on high-volume automotive lines.
What does the deployment look like from purchase order to full inline verification?
Standard deployment runs 6–12 weeks from PO to full inline verification. Weeks 1–4 cover site survey, camera placement engineering, and NVIDIA AI server pre-configuration to your production volume. Weeks 5–8 cover physical installation, PLC and MES integration commissioning, and model calibration against your first weeks of production imagery. Weeks 9–12 cover go-live, operator training, and initial tuning cycles. After go-live, 24×7 remote monitoring maintains model accuracy as production conditions evolve — new part introductions, base metal supplier changes, electrode wear pattern shifts — without requiring you to manage the model lifecycle in-house.
Talk to the engineering team about a 6-week pilot on a single high-value weld station to prove the case before scaling to the full body shop.
Turn Every Weld Into A Logged Structural Record
Replace Sampling With 100% Inline Verification Across Every Weld On Your Automotive Line
iFactory's AI weld vision platform is engineered for the specific realities of automotive body-in-white production — thousands of welds per vehicle across four processes, IATF 16949 traceability obligations, OEM scorecard pressure, and warranty exposure that scales with production volume. Inline defect classification, 280ms PLC decision latency, VIN-linked MES logging, and turnkey NVIDIA-edge deployment come together into a single weld intelligence layer that turns quality from a paper assertion into a live per-weld record.