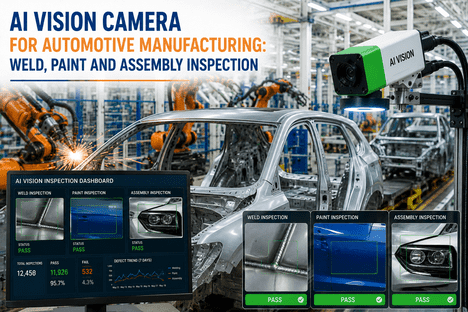
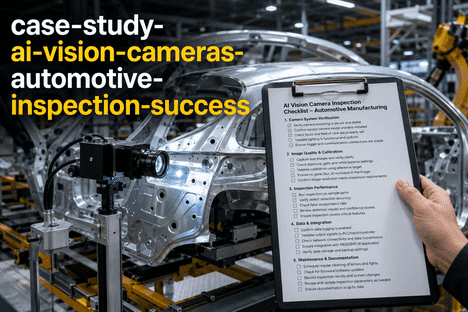
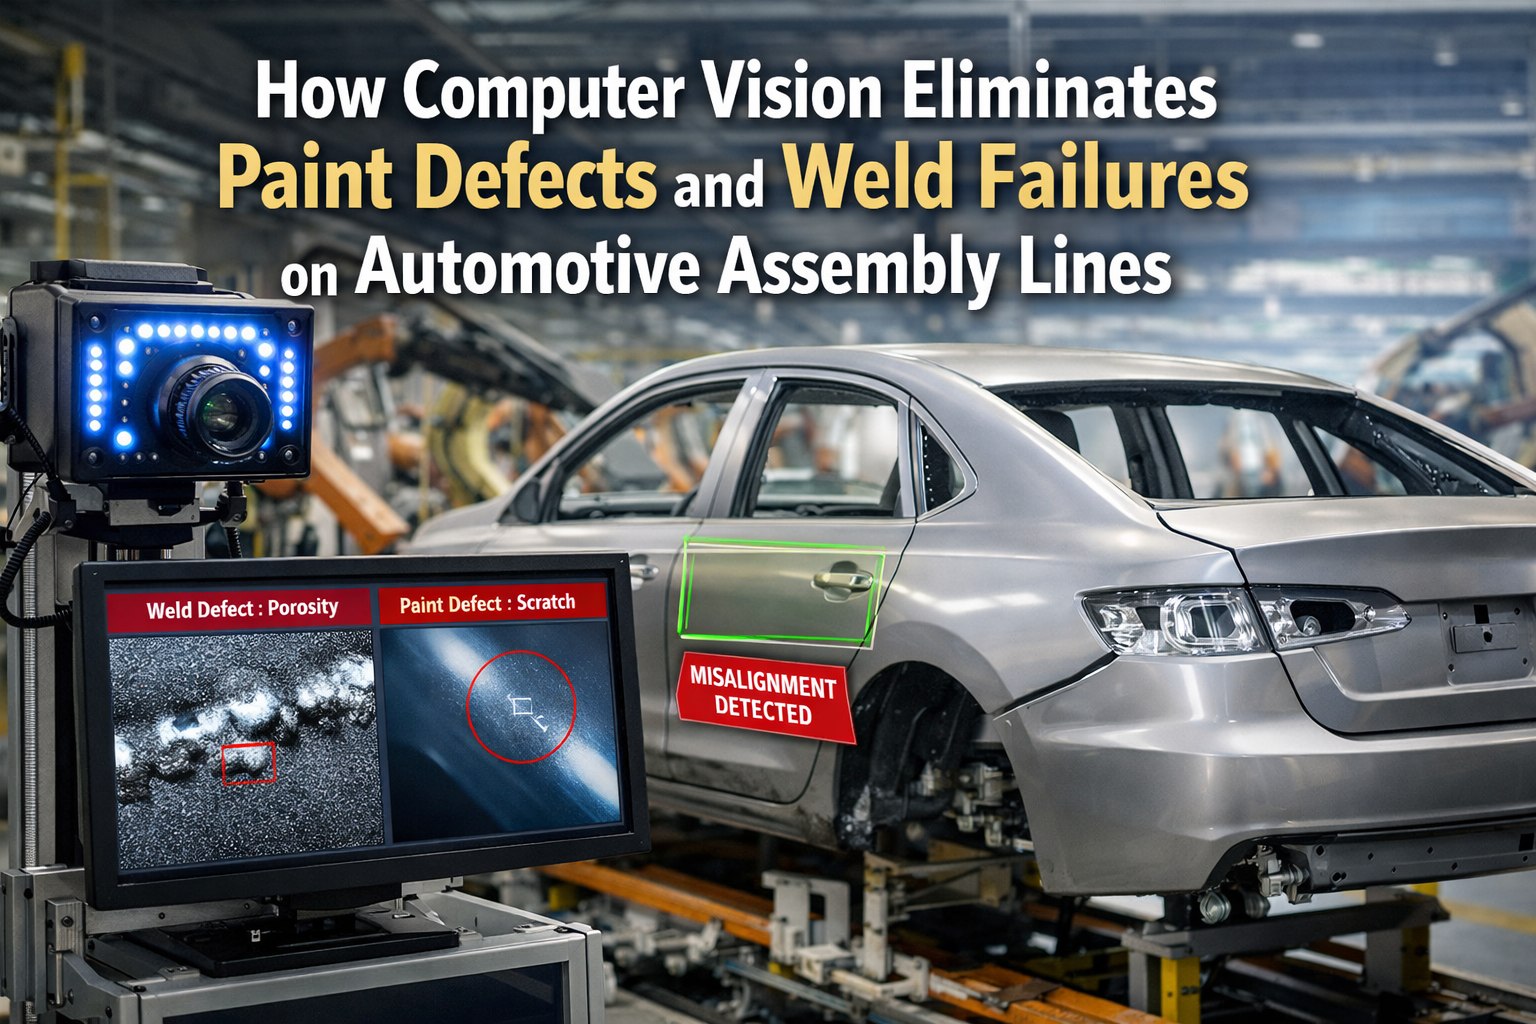
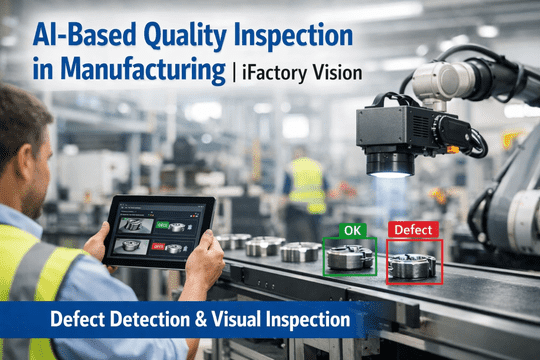
A high-volume automotive assembly plant running two body shops, one paint line, and a final trim operation was losing ground on quality. Defect escapes were tracking at 15%, warranty exposure had climbed past $9.4M annually, and OEM scorecard penalties were threatening two Tier-1 supply contracts. Manual sampling caught what it could — but the plant was running 76 vehicles per hour and human inspectors were checking 1 in 8. Within 14 months of deploying iFactory AI vision cameras across weld, paint, and assembly stations, defect detection climbed from 85% to 99.2% and warranty claims dropped 30% in the first full year of operation. This is how it happened, station by station — book a demo to see the same architecture on your line.
CASE STUDY · AUTOMOTIVE ASSEMBLY
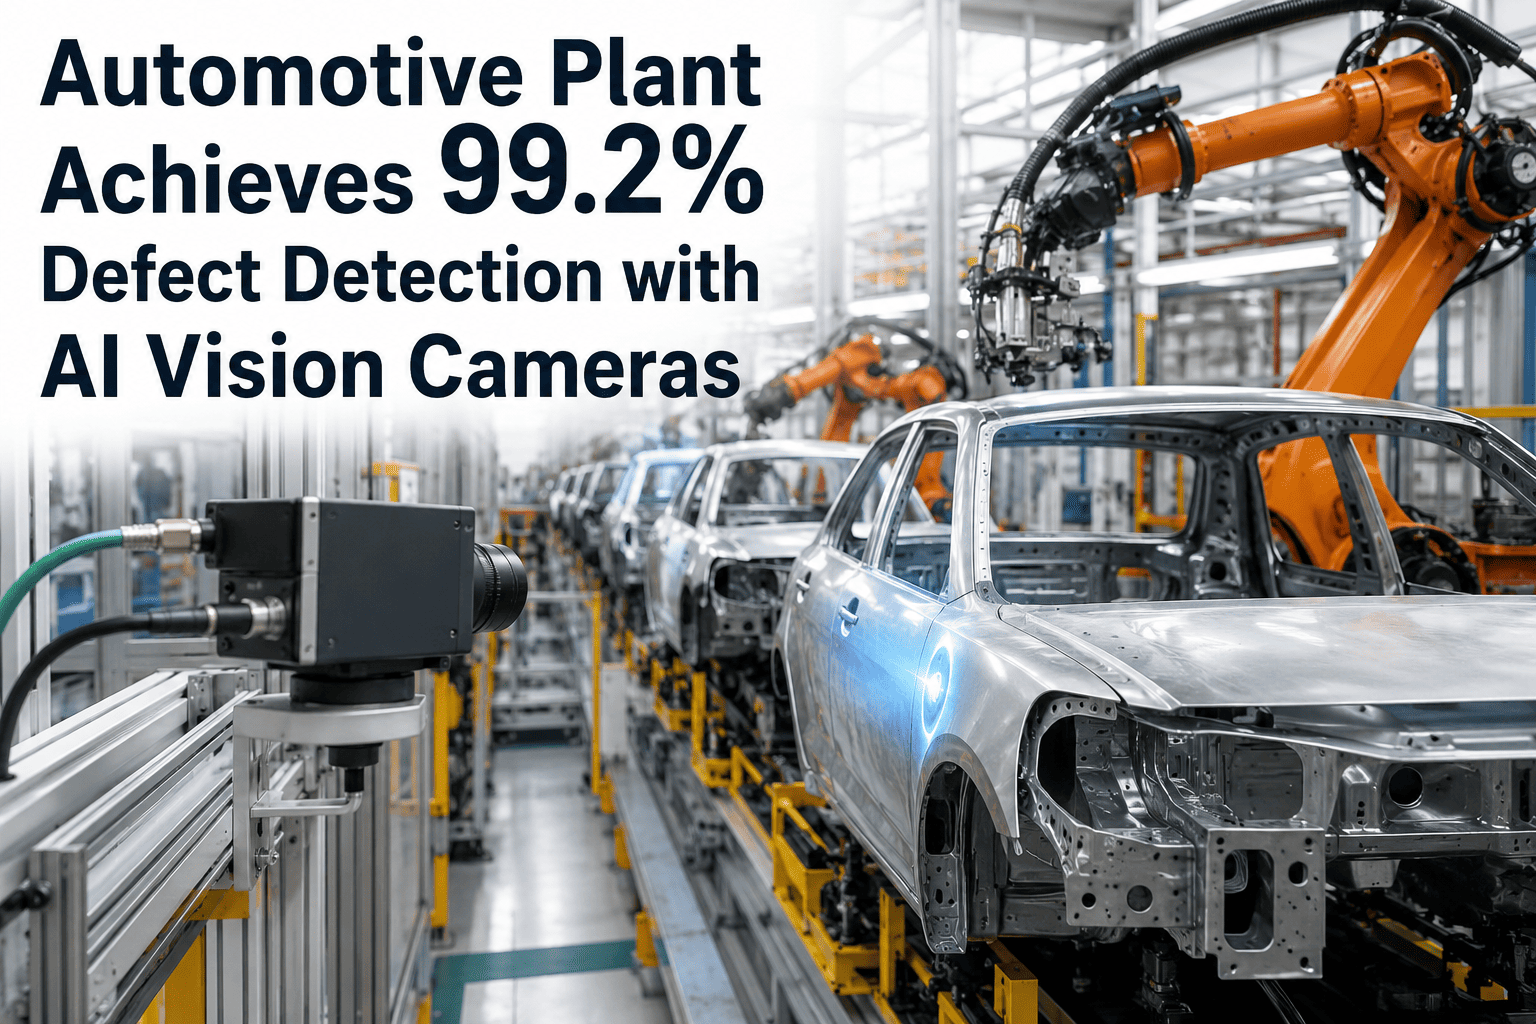
Automotive Plant Achieves 99.2% Defect Detection with AI Vision Cameras
Weld porosity missed at line speed. Paint runs discovered at final audit. Missing fasteners escaping to the customer. This plant fixed all three by wiring AI vision cameras into every quality gate — and cut warranty claims by 30% in year one.
99.2%
Defect detection rate
across weld, paint, assembly
85% → 99.2%
Detection gain vs
manual baseline
30%
Warranty claims reduction
year 1 of operation
14 weeks
Pilot to full 3-zone
production deployment
The Plant Before AI Vision
Every automotive quality problem eventually gets described the same way: defects that were technically visible but practically invisible — because the inspector was on hour nine, the paint booth lighting had drifted, and 76 vehicles an hour left no time to look twice. This plant had all three problems, and the OEM was starting to notice.
Production Profile
Vehicles per hour76
Assembly stations428
Shifts per day3 rotating
Body variants4 platforms
Annual output~245,000 units
Quality Baseline (Pre-AI)
Detection rate85%
Sampling coverage12% of units
Defect escape rate2.8%
Warranty spend / year$9.4M
Late-stage rework / shift187 units
01
Weld Porosity Escaping
Resistance spot welds on B-pillar reinforcements were passing visual inspection but failing pull tests at Tier-1 audits. Micro-porosity below 0.3mm was invisible to inspectors under standard body shop lighting.
02
Paint Defects Found Late
Orange peel, runs, and craters were caught at final audit — three stations downstream of the paint booth exit. Every catch meant strip-and-repaint at 12x the cost of catching it at booth exit.
03
Missing Fasteners
Trim clips and torque-marker verification depended on operator memory across 200+ checkpoints per vehicle. Missing hardware became warranty claims months after the vehicle left the plant.
04
Shift-Over-Shift Drift
Detection rate dropped from 89% at hour one to 71% by hour nine. Night shift consistently produced 40% more escaped defects than day shift — a variance the OEM scorecard did not forgive.
Solution Architecture: Three Zones, One Vision Platform
iFactory deployed AI vision cameras at the three highest-leverage inspection zones — body shop weld stations, paint booth exit, and final trim assembly. Each zone got imaging tuned to its specific defect physics: 3D laser profiling for welds, 24-camera 360-degree capture for paint, and multi-angle RGB for assembly. All three fed a single on-prem NVIDIA GPU inference server that made pass/fail/rework decisions in under 100 milliseconds.
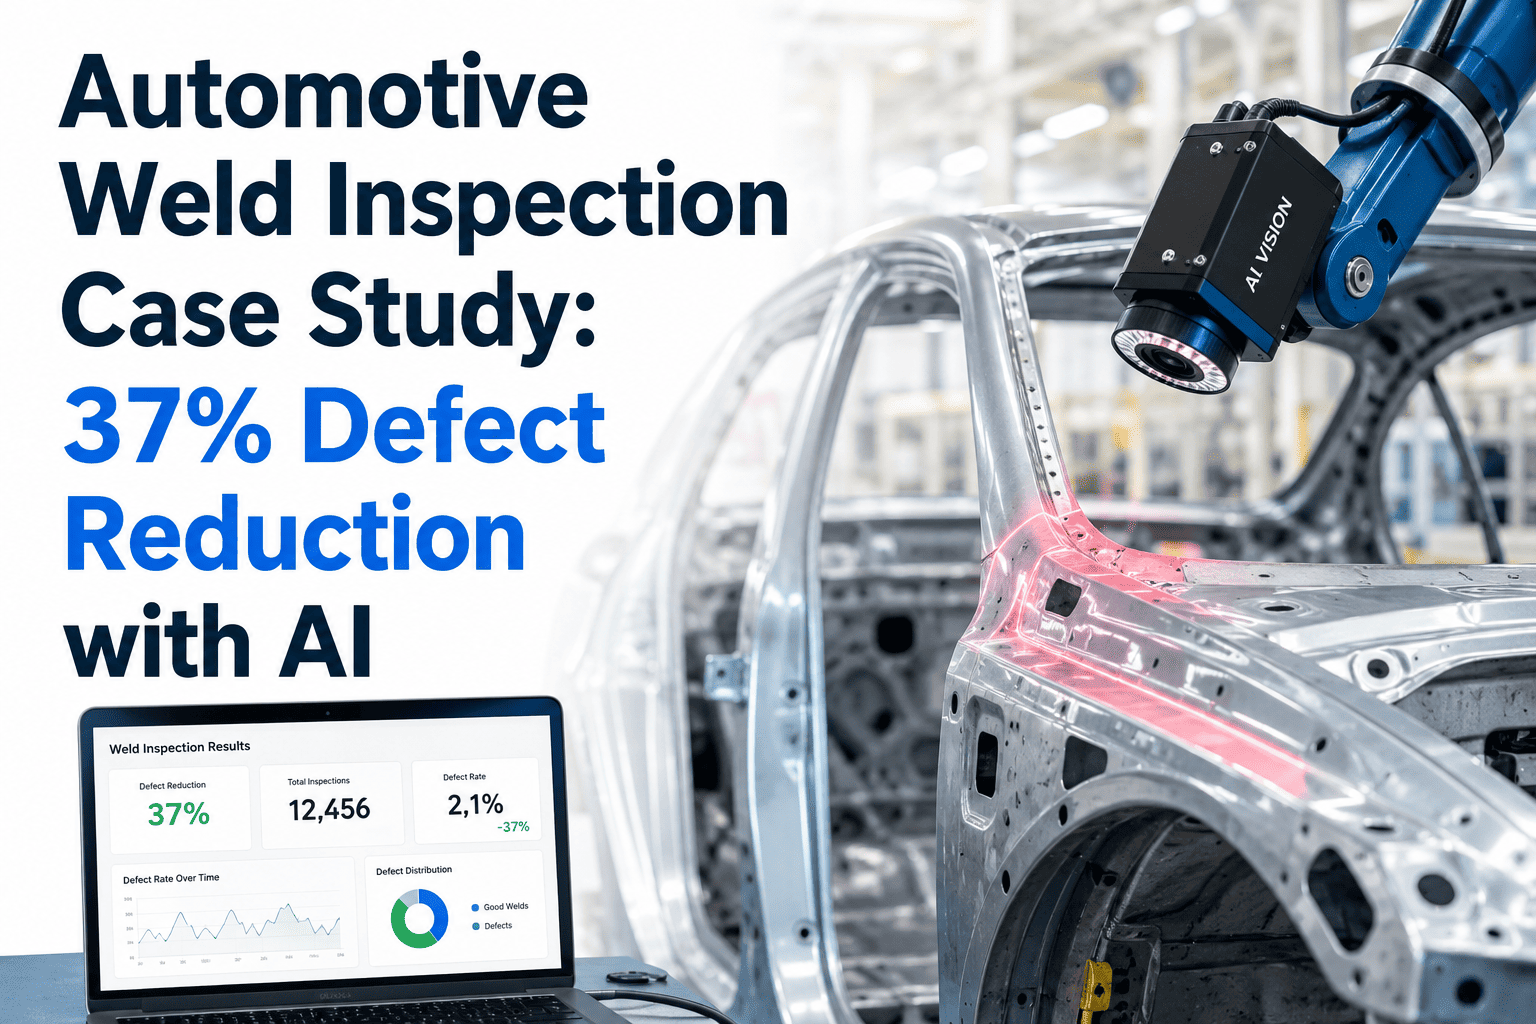
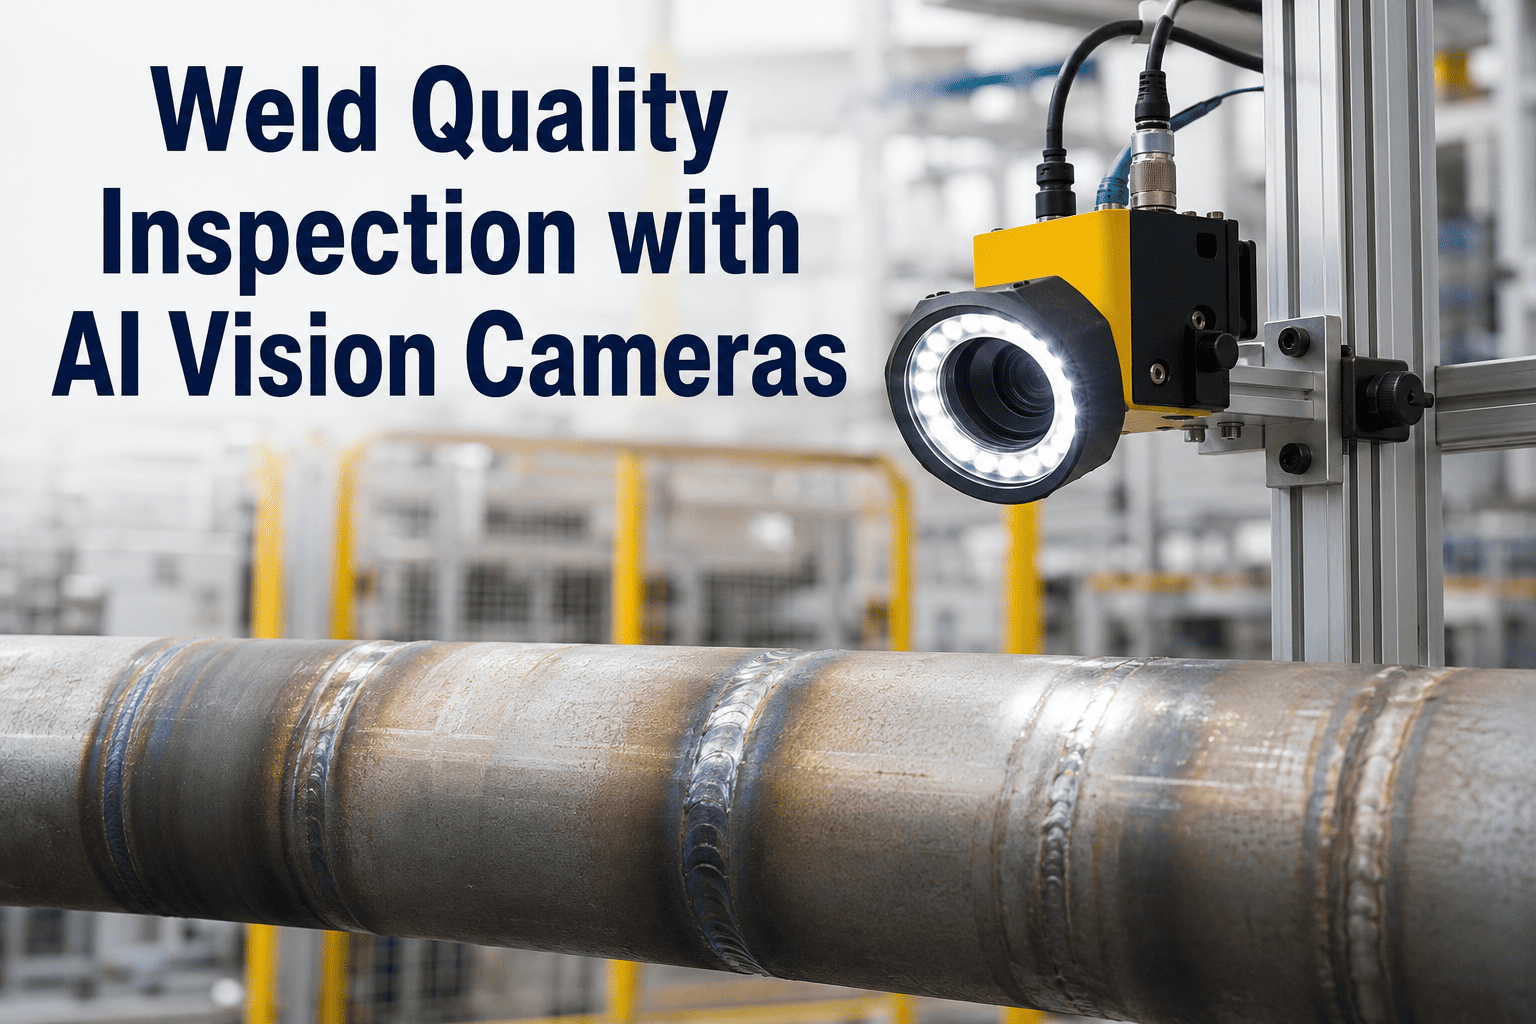
3D laser profilometry mounted on 14 weld stations across two body shops. AI models trained on 2.1 million weld images identify porosity, undercut, spatter, missing welds, and undersized nuggets at 240 welds per minute per station. Sub-surface defects surface via structured light triangulation, not visible-light cameras alone.
Porosity <0.3mm
Undercut
Spatter
Missing weld
Undersized nugget
Crack propagation
98.9%Weld defect detection
100%Coverage vs 2% sampling
85msInference per weld
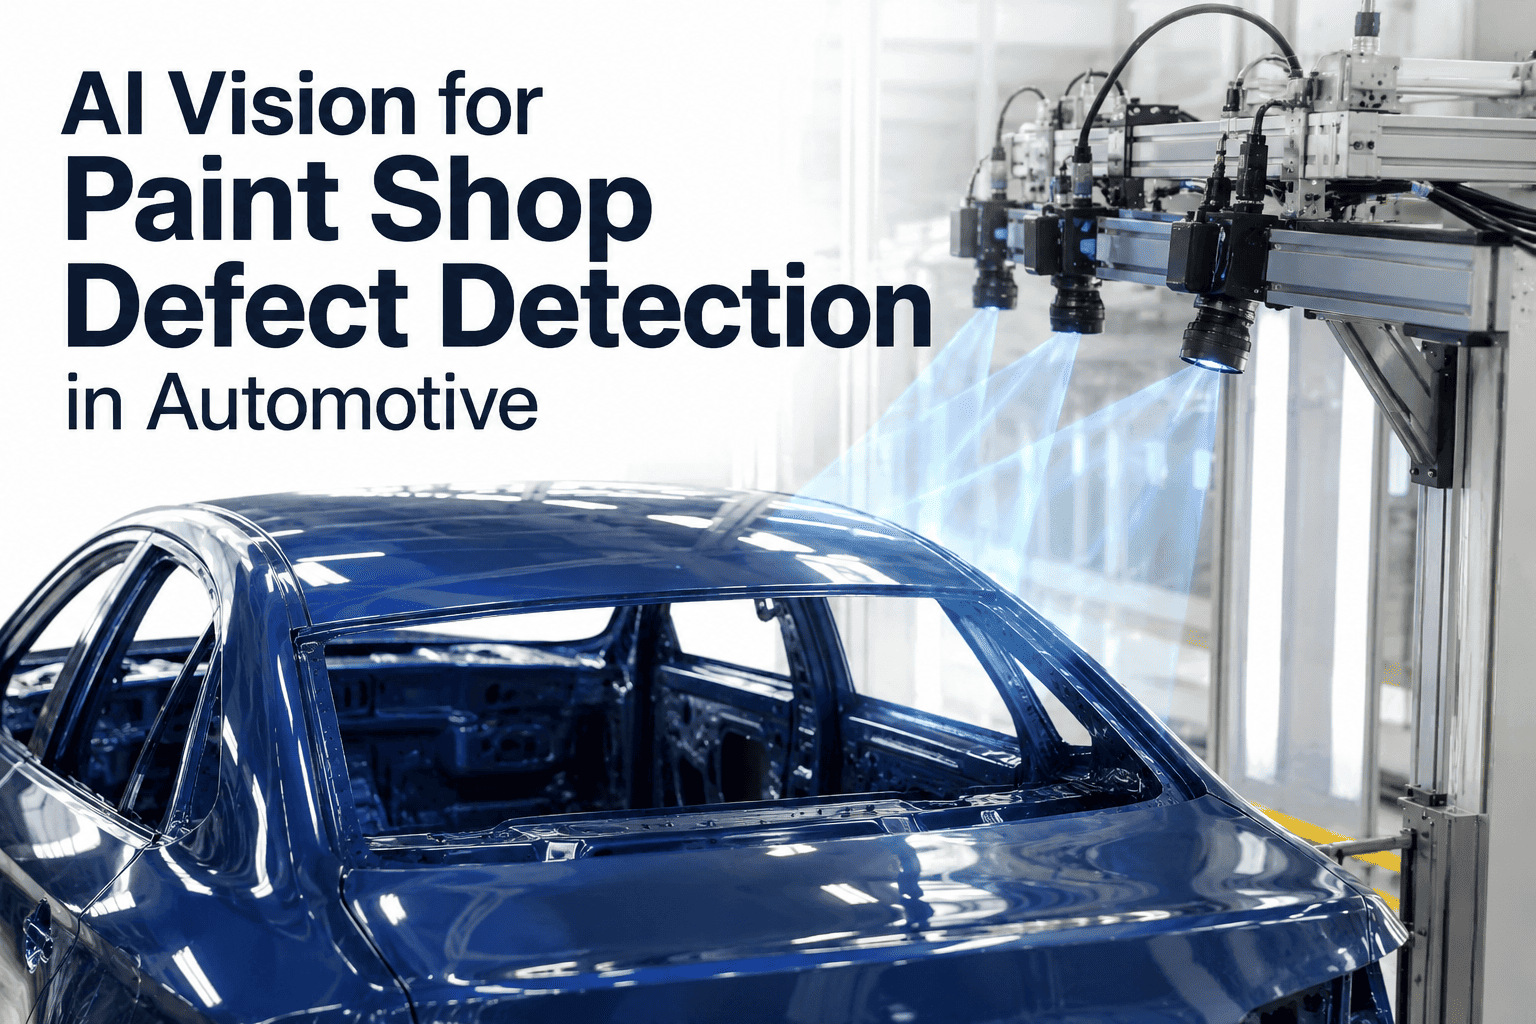
24-camera 360-degree AI vision tunnel at paint booth exit. Deflectometry cameras capture surface reflectance to reveal orange peel, craters, runs, sags, and micro-scratches under 50 microns — defects that stay invisible until clear coat application and cost 10x more to fix at final audit.
Orange peel
Runs & sags
Craters
Micro-scratches
Color mismatch
Inclusions
99.4%Paint defect detection
50µmMinimum defect size
12/shiftLate rework, down from 187
Multi-angle RGB cameras at 22 trim and final assembly stations verify part presence, orientation, torque-marker position, and label accuracy. AI segmentation confirms every fastener, clip, and component against the build order for that specific VIN — not a generic template.
Missing fasteners
Wrong-orientation parts
Torque marker miss
Label errors
Gap & flush
Panel alignment
99.1%Assembly verification
200+Checkpoints per VIN
62msInference per station
Before and After: The 14-Month Transformation
Detection rate is the headline number, but the operational change ran deeper. Sampling coverage moved from 12% to 100%. Late-stage rework fell from 187 units per shift to 12. Escape rates that had held stubbornly at 2.8% collapsed to 0.19%. The comparison below is the plant’s own dashboard, month 0 vs month 14.
The 30% warranty reduction understates the operational win. The plant retained both at-risk OEM contracts, exited quarterly quality escalation review after month 8, and reallocated 11 full-time inspection roles to root-cause engineering — where they now investigate the process drift that AI vision surfaces, rather than spot-check finished vehicles.
Ship Your Defect Samples. Get a Feasibility Read in 5 Days.
Send physical panels or 500+ images from your AOI archive. iFactory engineers return expected detection rates on your specific defect classes — before you commit to a pilot.
14-Week Deployment Roadmap
The plant went from signed statement of work to full 3-zone production containment in 14 weeks. No line shutdown. No parallel pilot line. Shadow-mode operation validated detection rates against the plant’s existing manual audit for the final 3 weeks before AI decisions started routing rework.
Wk 1–3
Imaging & Data Assessment
Vision engineers audited existing camera hardware, validated image legibility on real defect samples across all three zones, and pulled 18 months of historical defect images from the plant’s AOI archive for training-set construction.
Wk 3–6
Model Training & Threshold Tuning
Deep-learning models fine-tuned on plant-specific defect distribution: 800 weld samples, 1,400 paint samples, 1,100 assembly samples. Severity thresholds tuned per body variant — a 0.4mm porosity call on B-pillar is not the same as on a floor pan.
Wk 6–9
Hardware Install & Integration
NVIDIA GPU inference server racked in plant data hall. Camera hardware installed at 14 weld, 24 paint, and 22 assembly stations during scheduled maintenance windows. OPC-UA bridge wired to Level 2 PLC and SAP QM integration validated end-to-end.
Wk 9–11
Shadow Mode Validation
AI ran in read-only shadow alongside manual inspection for 3 weeks. Every AI call was compared against expert re-annotation. False accept and false reject rates measured against IATF 16949 acceptance criteria before any containment action went live.
Wk 11–14
Containment Go-Live
AI decisions began routing physical rework diverters and creating SAP QM inspection lots automatically. Zone-by-zone cutover: weld first, paint second, assembly third. Full 3-zone production containment reached by end of week 14.
Financial Impact: The Warranty Ladder
Warranty claims dropped 30% in year one — $2.8M in direct cost avoidance. But the financial case ran wider than that. The 1-10-100 rule applies with brutal clarity in automotive: catch a paint defect at booth exit and it costs a spot repair. Catch it at final audit and it costs a full strip and repaint. Catch it in the field and it costs a warranty campaign.
CAUGHT AT SOURCE
In-zone AI detection
$18 avg per defect
Spot repair at station. No downstream rework. No line hold.
CAUGHT LATE
Final audit catch
$220 avg per defect
Strip and repaint or teardown reassembly. 12x source cost.
$1,050 avg per claim
Dealer labor, parts, customer goodwill, OEM scorecard penalty.
FIELD ACTION
Recall campaign
$15M–$95M per campaign
Notification, remediation, logistics, brand damage, regulatory exposure.
$2.8M
Warranty cost avoidance, year 1
$1.4M
Rework and scrap reduction, year 1
7 months
Payback on total deployment cost
2 contracts
Tier-1 supply contracts retained
Technical Architecture Behind the Numbers
The plant runs iFactory entirely on-premise. No images leave the facility — a requirement for the OEM’s IP protection agreements. All inference runs on a single NVIDIA GPU server racked in the plant data hall, feeding results to the existing Level 2 PLC network and SAP quality module through standard industrial protocols.
A
Inference Layer
NVIDIA GPU server, on-prem in plant data hall. Deep-learning models per defect class, containerized for zero-downtime updates. Sub-100ms inference per frame, 60 concurrent camera streams.
B
Integration Layer
OPC-UA bridge to Level 2 PLC for rework diverter and line-hold control. REST API to SAP QM for inspection lot creation with image evidence, defect class, and VIN linkage.
C
Imaging Layer
60 cameras across 3 zones: 3D laser profilometry for welds, deflectometry array for paint, multi-angle RGB for assembly. Programmable strobe synced to encoder position to freeze motion.
D
Analytics Layer
Real-time defect dashboards embedded in existing plant portal via iframe. PLC tag correlation matrix links every defect timestamp to reflow, paint booth, and press process variables for root cause.
Integration principle
iFactory does not replace the plant’s MES, PLC, or quality management system. It sits alongside them, feeding decisions in through standard protocols the plant already uses. This is why deployment took 14 weeks, not 18 months — no rip and replace, no shadow architecture, no parallel data flows to maintain.
Frequently Asked Questions
The questions this plant’s quality director asked during evaluation — the same ones most automotive plants ask before committing to AI vision deployment.
How did the plant handle the 4 different body variants without training 4 separate models?
The models share a common backbone trained on general automotive defect physics — weld porosity looks like weld porosity regardless of which platform the panel belongs to. Variant-specific fine-tuning added a lightweight head per body platform with 50–200 samples each. Adding a fifth platform in month 11 took 4 days from data pull to production deployment, and did not require retraining the base model. To scope this for your own platform mix,
book a demo with an iFactory vision engineer.
What happened when the AI called a defect that the manual inspector would have passed?
During shadow mode, every disagreement was adjudicated by an expert panel and the label was fed back into the training set. The false reject rate settled at 1.1% after 3 weeks of tuning — below the plant’s existing manual false reject rate of 8.4%. Borderline cases route to rework rather than scrap, so a false reject costs rework labor, not a scrapped body. The economics work in every case where escape cost exceeds rework cost, which is every case in automotive assembly.
Did the plant have to slow line speed to accommodate AI inspection?
No. Inference runs at 62–85ms per frame depending on defect class, well inside the station cycle time at 76 vehicles per hour. Cameras trigger on encoder position, so there is no synchronization gap. The one exception was paint booth exit, where the 24-camera capture tunnel required a 1.2-second dwell — matching the existing manual audit dwell exactly, so no throughput was lost. Speak with
iFactory support to review your specific line cycle constraints.
How does the plant handle model drift as body variants and paint chemistry change?
iFactory monitors detection distribution monthly against the original validation baseline. When drift crosses a threshold — typically triggered by a new paint lot or a new body platform — the platform surfaces a fine-tuning request to the plant quality team with the specific samples that flagged the drift. Fine-tuning runs on the same on-prem hardware without cloud dependency. The plant has run this cycle 6 times in 14 months without any production impact or accuracy regression.
What data left the plant during deployment and normal operation?
No image data leaves the plant. Ever. The NVIDIA GPU server runs inside the plant network, the training data stays on-prem, and inference happens locally. The only external connection is optional telemetry for model health monitoring — aggregate accuracy metrics with no images attached — which the plant can disable entirely. This is the default deployment mode for automotive customers with OEM IP agreements. Contact
iFactory support for the full data residency specification.
READY TO SEE THE SAME OUTCOME ON YOUR LINE
99.2% Detection Is Not Aspirational. It Is Deployed.
Ship 10–20 physical defect samples or 500+ images from your AOI archive. iFactory vision engineers return expected detection rates on your specific defect distribution, a zone-by-zone deployment plan, and a 14-week timeline — before you commit to a pilot.
5 days
Feasibility report turnaround
14 wks
Pilot to full production
On-prem
Your data never leaves the plant
7 mo
Typical payback timeline