Every manufacturing plant carries a cost of poor quality averaging 20% of total revenue — for a facility generating $10 million annually, nearly $2 million disappears into scrap, rework, warranty claims, and inspection overhead that most operations teams accept as a fixed cost of doing business. AI vision inspection systems now achieve 95 to 99% detection accuracy at production speed, catching defects that human inspectors miss 20 to 30% of the time under real floor conditions. The financial case for deployment is not theoretical — Forrester research documents 374% average three-year ROI with 7 to 8 month payback across validated implementations. But generic vendor ROI projections are not a business case — calculating the return for your specific plant requires documenting your actual scrap costs, inspection labor, warranty exposure, and safety incident rates, then projecting the measurable improvements AI detection delivers against those baselines. Plant managers ready to model their specific ROI can Book a Demo to run the calculation with iFactory's vision specialists using real production numbers.
The Four Cost Categories That Build Your ROI Baseline
Before projecting savings, you need an honest baseline of what poor quality and manual inspection are costing your plant today. Most manufacturers significantly undercount these costs because they are distributed across multiple budget lines — quality, maintenance, warranty, labor, and production overhead — rather than consolidated into a single cost-of-quality figure. The ROI calculation starts by documenting four cost categories that AI vision inspection directly addresses.
Scrap and Rework Costs
Document every unit scrapped or reworked due to defects that escaped detection or were caught too late to correct inline. Include raw material waste, machine time consumed on defective parts, rework labor hours, and the throughput lost while rework occupies production capacity. Typical mid-size manufacturers carry $500K or more in annual scrap costs — and a 30 to 40% defect reduction through AI vision directly compresses this figure.
Inspection Labor Costs
Calculate the fully loaded cost of manual inspection labor across all shifts — base salary, benefits, overtime, training, and turnover costs for quality inspectors. A three-shift inspection operation with two inspectors per shift at $45K to $55K fully loaded per head costs $270K to $330K annually — before accounting for the 15 to 25% accuracy degradation that occurs after two hours of continuous visual inspection and the 55 to 70% inter-inspector agreement that creates classification inconsistency between shifts.
Warranty and Recall Exposure
Quantify the annual cost of warranty claims, customer returns, field failures, and recall events attributable to defects that escaped your inspection process. Include direct claim costs, shipping, replacement parts, field service labor, and the harder-to-quantify costs of customer relationship damage and scorecard penalties from major OEM customers. An electronics manufacturer documented $1.8 million in annual warranty savings after cutting defect escape rate from 2.3% to 0.1% with AI vision — a single metric that justified the entire deployment investment.
Safety and Compliance Costs
Account for the cost of safety incidents related to undetected equipment defects — injury claims, OSHA citations, production stoppages for investigation, and the insurance premium increases that follow recordable incidents. For regulated industries, include the cost of compliance documentation — manual inspection logs, audit preparation labor, and the risk exposure from gaps in paper-based inspection records that AI vision's automated, timestamped documentation eliminates entirely.
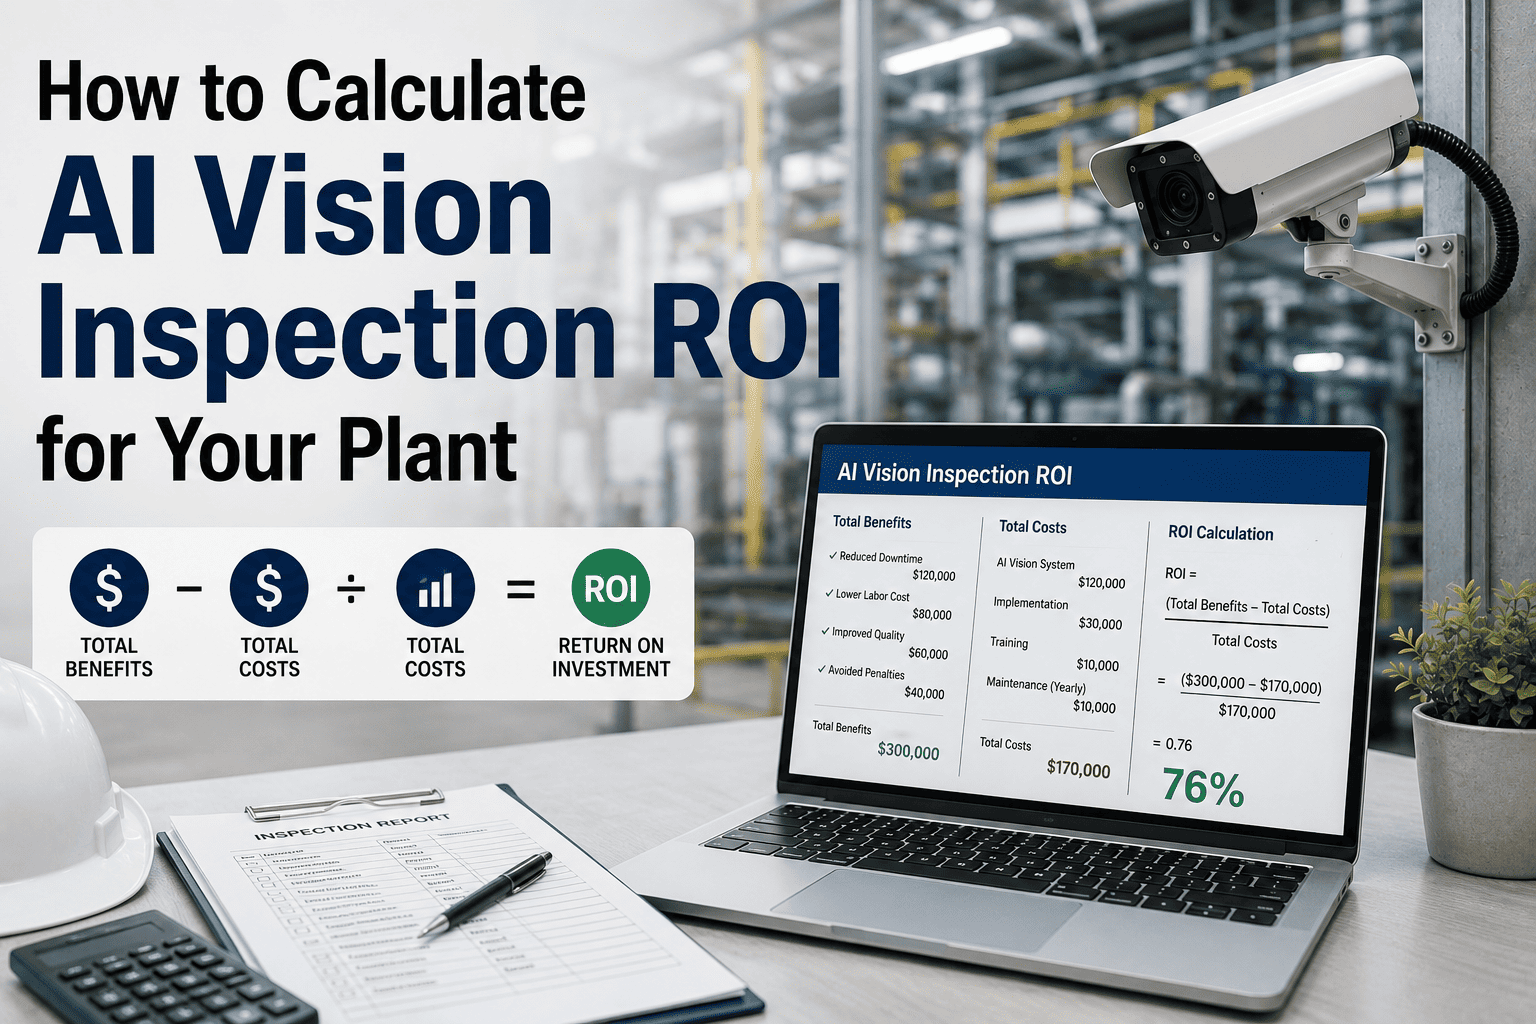
The ROI Formula: How to Calculate Payback and Three-Year Return
The calculation is straightforward once your baseline costs are documented. Four inputs drive the entire model — and the defect reduction percentage is the single input that moves the result most dramatically. Operations teams ready to plug in their real numbers can Book a Demo with iFactory to run a custom ROI calculation in 30 minutes.
How much of your high-defect lines you cover. More stations capture more cost, but add capital expenditure. Start with the one to three stations generating the highest scrap or escape cost — marginal stations share edge hardware and add low incremental cost later.
The biggest lever in the entire calculation. A conservative 30 to 40% is typical once a model is tuned to your specific parts. High-volume lines with clear defect types often achieve 50% or more. This single input determines whether payback lands at 6 months or 18 months.
Your total annual cost of poor quality — scrap, rework, warranty claims, and inspection overhead — for the lines being covered. Most manufacturers carry 20% of revenue as COPQ. For a $10M plant, that is $2M in addressable cost before any AI intervention.
The number of manual inspection headcount reduced or redeployed to higher-value work once AI handles the bulk of inline inspection. At $38K to $52K fully loaded per head across three shifts, even replacing two inspectors per station generates $230K or more in annual labor savings.
Sample ROI Calculation: High-Volume Production Line
The following calculation reflects a high-volume production line with clear defect types — the scenario where AI vision ROI is strongest and payback is fastest. Your specific numbers will differ based on production volume, defect complexity, and current inspection maturity, but the structure of the calculation applies universally.
| ROI Component | Your Baseline | AI Vision Impact | Annual Value |
|---|---|---|---|
| Addressable quality cost | $2,000,000 (20% of $10M revenue) | 35% defect reduction | $700,000 saved |
| Inspection labor (3 shifts, 2 inspectors) | $330,000 annually | 1.5 FTE redeployed | $247,500 saved |
| Warranty claim reduction | $400,000 annually | 60% escape reduction | $240,000 saved |
| Total annual savings | $1,187,500 | ||
| System investment (2 stations) | Hardware + software + integration | $180,000 | |
| Payback period | 1.8 months | ||
| Three-year ROI | 1,879% |
Payback Timeline by Application Type
Payback speed depends on defect visibility, production volume, and the gap between current manual detection rates and AI accuracy. High-volume lines with clear surface defects pay back fastest — 4 to 8 months. Complex, high-mix environments with subtle defect types typically land in the 12 to 24 month range but deliver higher absolute savings due to the premium value of the parts involved.
Hidden ROI Factors Most Calculations Miss
The direct savings from scrap reduction and labor displacement capture most of the ROI — but several additional value streams compound over time and are frequently omitted from initial business cases because they are harder to quantify upfront. Including them strengthens the capital approval case and more accurately reflects the total economic impact of AI vision deployment.
Throughput Recovery
Manual inspection creates a throughput ceiling — lines run only as fast as inspectors can keep up. AI vision inspects at line speed with sub-100ms inference, eliminating the inspection bottleneck. A 10 to 15% throughput increase on a high-value line can exceed the direct quality savings in annual revenue impact.
Third-Shift Coverage
Facilities that cannot staff third-shift inspection due to labor shortages lose 33% of potential production capacity. AI vision provides 24/7 inspection coverage without additional headcount — recovering production capacity that labor constraints had previously eliminated.
Continuous Improvement Data
AI vision generates defect classification data — type, frequency, location, shift correlation — that manual inspection cannot systematically produce. This data feeds root cause analysis, process parameter optimization, and supplier quality programs that compound quality improvements over quarters rather than delivering a one-time step change.
Customer Scorecard Protection
For automotive and aerospace suppliers, a quality escape that triggers a customer-issued corrective action can result in scorecard downgrades, reduced order allocation, and in severe cases, loss of qualified supplier status. AI vision's escape prevention capability protects the revenue stream that depends on maintaining top-tier supplier ratings.
Turnkey Deployment: From ROI Model to Production in 6–12 Weeks
iFactory delivers AI vision inspection as a turnkey hardware-and-software bundle on NVIDIA GPU edge servers — not as a software license that leaves your team to source cameras, compute hardware, and integration independently. The turnkey package covers industrial cameras with optimized lighting, NVIDIA Jetson or L4 edge compute, pre-trained AI models, and CMMS integration connectors — deployed in three phases across 6 to 12 weeks, validated across 1,000+ client installations with 99.9% system uptime.
Assessment and ROI Baseline
Camera placement assessment, lighting design, defect type catalog, and ROI baseline documentation using your actual scrap, labor, and warranty data. Feasibility report confirms projected savings before hardware procurement.
Model Training and Shadow Run
AI model trained on 500 to 2,000 labeled images from your production. Shadow-run alongside manual inspection for one week — outputs compared in real time to validate accuracy before full handover. Target: 99%+ recall.
Production Go-Live and ROI Tracking
Full production activation with measured ROI tracking from day one. Defect reduction, labor redeployment, and warranty impact documented against baseline — building the verified ROI case that funds expansion to additional lines.
Frequently Asked Questions: AI Vision Inspection ROI
What is the average payback period for AI vision inspection?
Across validated implementations, Forrester research documents an average payback period of 7 to 8 months with 374% three-year ROI. High-volume applications with clear defect types often break even in under 6 months, while complex high-mix environments typically land in the 12 to 18 month range. The key variable is defect reduction percentage — a conservative 30 to 40% reduction on a line with $2M in addressable quality costs generates $600K to $800K in annual savings against a typical system investment of $60K to $200K per station. Teams ready to calculate their specific payback can Book a Demo for a 30-minute ROI modeling session.
How do I quantify the cost of poor quality if we do not track it today?
Start with three numbers your quality and finance teams already have: annual scrap cost from your ERP system, rework labor hours from production reports, and warranty claim expense from customer service records. Add the fully loaded cost of your manual inspection team — headcount multiplied by salary, benefits, and overtime. Most manufacturers discover that their total cost of poor quality runs between 15% and 25% of revenue once these categories are consolidated, even when individual line items appeared manageable in isolation. iFactory's assessment phase helps document these costs systematically during Week 1 to 2 of the deployment process.
What does the AI vision system cost to deploy?
Deployment cost ranges from $30K to $200K per inspection station depending on camera resolution requirements, lighting complexity, edge compute specifications, and CMMS integration scope. Multi-station deployments benefit from shared edge hardware — the marginal cost of adding stations decreases significantly after the first installation. iFactory's turnkey package includes cameras, lighting, NVIDIA edge compute, model training, and CMMS integration in a single investment rather than separating hardware, software, and services into multiple vendor contracts that obscure total cost of ownership. Contact iFactory Support for station-specific pricing.
Can we start with one station and expand based on proven ROI?
Yes — and this is the recommended approach. Start with the single highest-impact inspection station — the one generating the most scrap, the highest warranty exposure, or the worst escape rate. Prove the defect reduction and labor savings on that station over 4 to 8 weeks of production operation, then use the documented results to build the capital approval case for expansion to additional stations. iFactory's edge architecture allows additional cameras to share the existing GPU compute hardware, so expansion carries lower marginal cost per station after the initial deployment is validated.
How do we track ROI after the system is deployed?
iFactory provides a production performance dashboard that tracks defect detection rate, false positive rate, escape rate reduction, inspection labor hours saved, and cycle time impact from the first day of production operation. These metrics are compared against the pre-deployment baseline documented during Phase 1 assessment to produce a verified ROI report. CMMS-integrated deployments additionally track work order generation rates, mean time from detection to corrective action, and the quality cost trend over time — providing CFO-grade evidence that the investment is delivering the projected return and building the case for programme expansion.