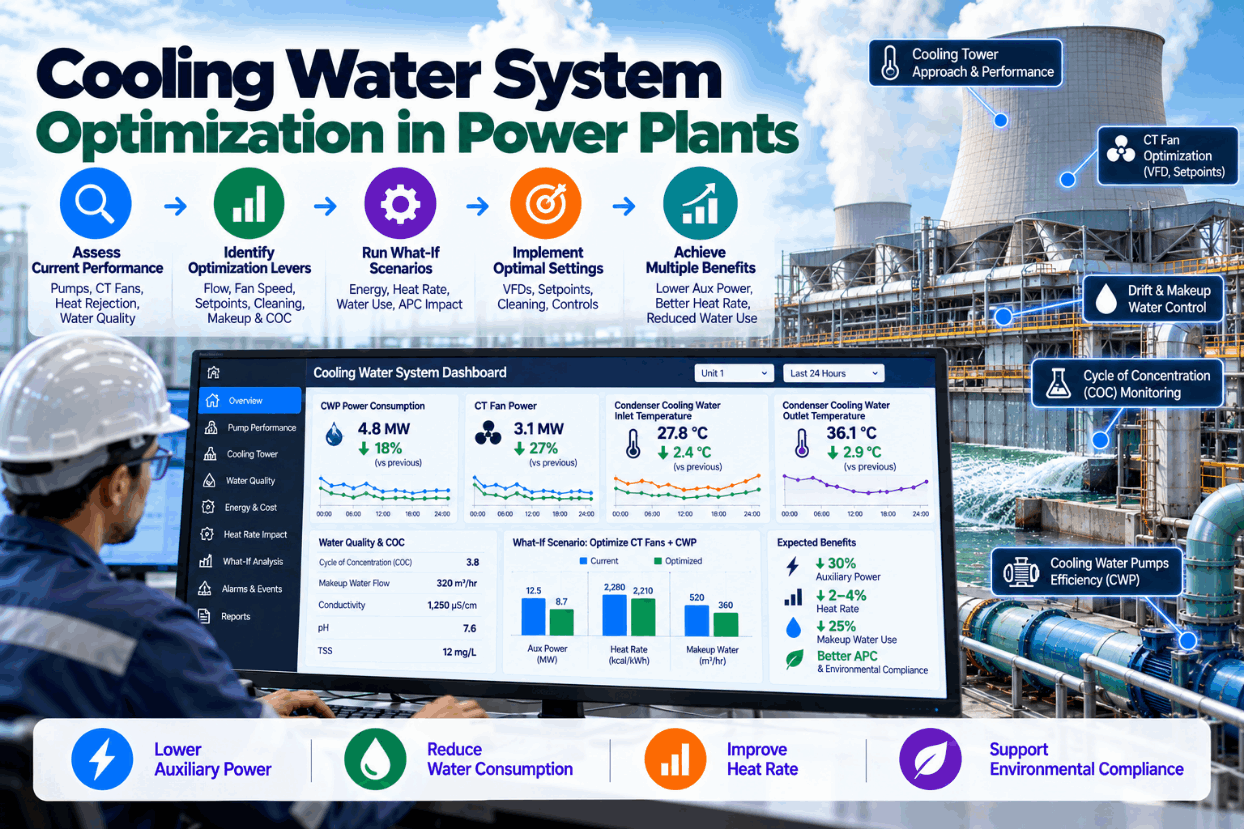
The board operator in a 1,200-ton-per-day ammonia plant sees the cooling tower approach creeping up — 9°F, then 10°F, now 11°F. The TDS controller on the make-up line is hunting, the blowdown valve has been cycling 300 times in the last 8 hours, and the shift engineer just flagged a conductivity spike on the west cell. Nobody knows if the fill is fouling, if the drift eliminators are saturating, or if the conductivity sensor itself needs recalibration. Meanwhile, the plant's water treatment chemical contract costs $1.2M a year, and no one can prove the dosage is right for the actual cycles of concentration. This is the real cost of running a cooling tower blind — and it's the problem iFactory's Cooling Tower AI was built to solve.
Stop Guessing on Blowdown, Chemistry, and Fill Health — AI That Monitors Every Cell, Every Minute
iFactory's on-premise Cooling Tower AI ingests TDS, conductivity, fan vibration, and temperature data from your existing sensors and delivers real-time blowdown optimization, Legionella risk alerts, and fill fouling prognostics — without sending a single data point to the cloud.
Why Cooling Towers Are the Most Expensive Unmonitored Asset in Your Plant
Your cooling tower sits at the intersection of water chemistry, mechanical reliability, and energy efficiency — yet most chemical plants monitor it with one conductivity probe and a weekly grab sample. That gap costs real money, real risk, and real downtime.
Blowdown Running Blind
Without real-time TDS and conductivity trend analysis, blowdown valves over-cycle, wasting 50–200 gallons per minute of treated water. For a 50,000-gpm tower loop, that's $80,000–$150,000/year in lost water and sewer fees alone.
Legionella Risk You Can't See
When cycles of concentration drift below 3 or above 8, biofilm formation accelerates. A single Legionella outbreak can shut down a plant for weeks, cost $5M+ in remediation, and trigger OSHA citations. Most plants only find out after a positive culture — too late.
Fan Vibration Escalates to Unplanned Outage
Cooling tower fan bearing failures account for 40% of all cooling tower downtime. A vibration spike that goes unnoticed for 24 hours can turn a $2,000 bearing into a $120,000 gearbox rebuild and 3 days of lost production.
Fill Fouling Steals Approach and Capacity
When fill fouls with scale, silt, or biological growth, approach temperature rises 2–5°F. Every 1°F loss in approach increases condenser pressure by 0.5 psi, reducing turbine efficiency by 1.5% — a $250,000/year hit for a 100-MW chemical plant.
Chemical Dosing Is a Black Box
Your water treatment chemical contract is probably priced on a fixed dosage rate, but actual demand varies with make-up water quality, cycles of concentration, and seasonal temperature swings. Overdosing costs $50,000–$200,000/year; underdosing risks corrosion and fouling.
You don't need more sensors — you need AI that makes sense of the data you already have. Book a 30-min walkthrough and we'll show you live on your data.
From Raw Tower Data to Actionable Control in Four Steps
iFactory's Cooling Tower AI connects to your existing PLCs, DCS, and sensor networks — no new hardware, no cloud dependency. The on-premise appliance ingests data, trains models on your plant's specific tower dynamics, and delivers real-time recommendations within weeks.
Ingest Every Signal
Connect to your Allen-Bradley, Siemens, or Yokogawa controller for conductivity, TDS, pH, temperature, fan vibration, and flow — typically 30–80 tags per tower cell.
Train a Tower-Specific Digital Twin
iFactory's AI learns the thermal and chemical behavior of your specific tower — approach, range, drift loss, and cycles of concentration — using 6–12 months of historical data to build a baseline.
Real-Time Blowdown & Chemistry Optimization
The model calculates optimal blowdown rate every 60 seconds, balancing TDS, conductivity, and chemical concentration against make-up water variability and seasonal ambient conditions.
Prognostics for Fans, Fill, and Legionella Risk
Fan vibration trends predict bearing failure 72+ hours in advance; fill fouling is detected through approach drift; Legionella risk is scored daily based on temperature, TDS, and stagnation patterns.
What the Cooling Tower AI Delivers on Day One
Blowdown Optimization Engine
Automatically adjusts blowdown valve position to maintain target cycles of concentration within ±0.2 CoC. Reduces blowdown volume by 15–25% while keeping TDS below 2,500 ppm. Saves 10–30 million gallons of water per year on a typical 50,000-gpm tower.
Legionella Risk Scoring
Continuous risk score from 0–100 based on real-time temperature, TDS, pH, and stagnation detection. Alerts at score >70 with recommended blowdown or biocide actions. Audit-ready reports for OSHA and ASHRAE Standard 188 compliance.
Fan Vibration Prognostics
Monitors velocity and acceleration on each fan deck. Detects imbalance, misalignment, and bearing degradation 72+ hours before failure. Integrates with your CMMS for automated work order generation.
Fill Fouling Detection
Tracks approach temperature drift relative to ambient wet-bulb and heat load. Flags fill fouling when approach exceeds baseline by 1.5°F for 48 hours. Quantifies the impact on condenser backpressure and turbine efficiency.
Chemical Dose Optimization
Recommends real-time adjustments to corrosion inhibitor, scale inhibitor, and biocide dosing based on actual cycles of concentration and make-up water quality. Tracks chemical consumption against target curves and flags overdosing.
Automated Reporting & Alarms
Generates daily, weekly, and monthly cooling tower performance reports with all key parameters — TDS, CoC, blowdown volume, fan runtime, Legionella risk score. Configurable alarms for any threshold via email, SMS, or OPC-UA.
What Chemical Plants Are Saving with Cooling Tower AI
Measured results from iFactory deployments across ammonia, methanol, and chlor-alkali plants. Your tower will vary, but the pattern is consistent.
Everything You Need to Go Live in 6–12 Weeks — No Cloud, No New Sensors
End-to-End Turnkey Deployment
We connect to your existing data sources — DCS, PLC, historians — and deliver a working pilot in 6–12 weeks. No new hardware, no IT projects, no data egress.
On-Premise NVIDIA Appliance
All AI models run on a hardened NVIDIA appliance inside your plant network. Zero data leaves your facility. No cloud dependency, no cybersecurity exposure.
Pilot-to-ROI in One Quarter
We deploy, train, and validate the model in 6–12 weeks. You start seeing water and chemical savings in the first 30 days of operation. Full ROI by month 6.
24×7 Managed Service
iFactory's operations team monitors your cooling tower AI 24/7. We handle model retraining, alarm tuning, and data quality — you focus on running the plant.
Absorbs SAP MII / ME / PCo Workloads
If you're migrating off SAP MII, ME, or PCo, iFactory absorbs those operational workloads — including cooling tower monitoring — with no data loss and no custom integration.
Compliance-Ready Audit Trail
All model decisions, alarm events, and operator actions are logged in an immutable audit trail. Ready for OSHA, EPA, and ASHRAE inspections.
Your cooling tower is already generating the data — iFactory turns it into savings, safety, and reliability. Book a 30-min walkthrough and we'll show you live on your data.
Questions Chemical Plant Operators Actually Ask
Stop Managing Your Cooling Tower by Grab Sample. Start Optimizing Every Cell, Every Minute.
iFactory's Cooling Tower AI is live in chemical plants today — cutting water use, reducing chemical spend, and preventing Legionella risk. The pilot takes 6–12 weeks. The payback starts in month one.