Vibration Analysis for Cement Plant Rotating Equipment
By Larry Eilson on May 30, 2026
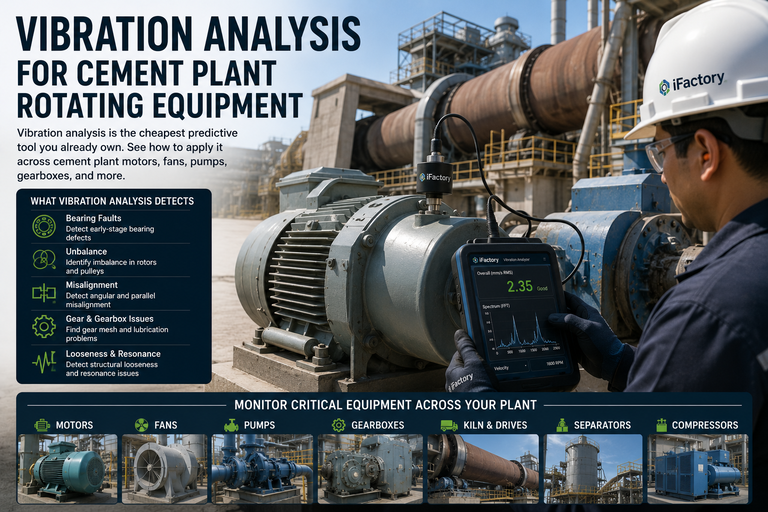
A bearing six weeks from catastrophic failure is already screaming — you just cannot hear it without the right tools. That is the quiet truth behind vibration analysis: every motor, fan, pump, and gearbox in a cement plant broadcasts its mechanical health continuously, encoded in the way it shakes. Imbalance, misalignment, bearing wear, looseness, gear faults, cavitation — each leaves a distinct fingerprint in the vibration spectrum, often weeks or months before any damage is visible or audible. And the best part is that vibration analysis is the cheapest predictive tool most plants already own; the data collectors are on the shelf and the measurement points are already on the machines. The gap is rarely the hardware. It is having a structured way to read the spectrum and act on it. A vibration monitoring program turns that shake into a diagnosis and a work order.
iFactory Reliability Intelligence
Vibration Analysis for Cement Plant Rotating Equipment
The cheapest predictive tool you already own, applied across motors, fans, pumps, and gearboxes — read the fault signatures, classify the severity, and act before the failure.
Severity Tells You How Bad — Frequency Tells You Why
The single most important principle in vibration analysis is this: the overall level tells you the severity, but the frequency spectrum tells you the cause. An RMS reading of 5 mm/s says a machine has a problem; it cannot say whether that problem is imbalance, misalignment, a bearing, or looseness. For that you need the FFT — the Fast Fourier Transform that decomposes the raw vibration waveform into its individual frequency components, so each fault shows up as a peak at its own telltale frequency.
Overall RMS
How Severe
A single velocity number in mm/s, compared against ISO 10816 zones. It triages the machine — fine, watch, or shut down — but says nothing about what's wrong.
FFT Spectrum
Why It's Happening
The frequency breakdown that isolates the fault. A peak's location in the spectrum names the defect; its amplitude and trend tell you how far it has progressed.
The Fault Fingerprint in the Spectrum
Each mechanical fault produces a unique pattern in the frequency spectrum, anchored to the machine's running speed. Once you know what to look for, a spectrum plot tells you exactly what is wrong before any physical damage is visible. This is the dictionary every analyst reads from.
Reading Faults by Frequency — Anchored to Running Speed (1x)
Severity classification gives you a common language across every machine in the plant. ISO 10816 sorts overall velocity into four zones by machine class and mounting — and those zones translate directly into action. Set your alarm at the B/C boundary and your trip at the C/D boundary, and the spectrum work begins the moment a reading crosses into C.
A
New condition
Baseline for a freshly commissioned or reconditioned machine. This is the reference you trend against.
B
Acceptable
Suitable for long-term operation without restriction. Continue routine monitoring and trending.
C
Investigate
Short-term acceptable only. Run spectrum analysis, find the cause, and schedule corrective work.
D
Damage occurring
Vibration severe enough to cause damage. Immediate action — shut down and inspect.
Want your cement rotating equipment classified against ISO 10816 with the spectrum read for cause? Book a 30-minute reliability walkthrough and we'll analyze a live signature from your plant.
Where to Point It Across the Plant
Vibration analysis is general-purpose — the same FFT method covers the whole rotating fleet, but each asset class has its own dominant failure modes and a signature to match. Here is where the technique earns its keep across a cement plant.
Motors
Beyond mechanical imbalance and bearing wear, electrical faults show as a peak at 2x line frequency (100 or 120 Hz) — stator eccentricity or broken rotor bars that no other check catches.
Fans (ID / Cooler)
High-speed, dust-laden duty causes buildup and imbalance at 1x. Blade-passing frequency (blades x RPM) flags aerodynamic problems before bearings are overloaded by the unbalance.
Pumps
Cavitation appears as broadband high-frequency noise; vane-passing frequency flags hydraulic issues. Misalignment to the driver shows the classic 1x plus 2x axial signature.
Gearboxes
Gear mesh frequency with sidebands reveals tooth wear and misalignment in kiln drives and mill gearboxes — multi-stage units where a missed fault means a multi-week reline.
Velocity for Severity, Envelope for Early Warning
One nuance separates a screening program from a real predictive one: what you measure. Velocity RMS is the right general-purpose severity metric, but it misses early-stage bearing faults that live at high frequency. Acceleration envelope detection captures the impacting at bearing defect frequencies before overall levels ever rise — which is how you get weeks of warning instead of days.
Velocity RMS
The ISO 10816 severity metric (10-1000 Hz) — best for general health on motors, fans, pumps, and gearboxes. Tells you how bad, plant-wide and comparable.
Acceleration Envelope
High-frequency, most sensitive to bearing-defect impacts and gear-tooth events. Detects sub-surface faults early, before they show in velocity.
The Trend, Not the Point
A rising amplitude at a defect frequency across three consecutive readings is a far stronger signal than any single elevated reading in isolation.
The difference between screening and predicting is method and consistency. Want a structured route and threshold scheme built for your assets? Talk to our reliability engineers.
From Reading to Closed Work Order
A spectrum that nobody acts on is just a chart. The value of vibration analysis is realized only when severity, diagnosis, and action are connected — and when data outside the CMMS adds weeks of delay, that loop has to be closed in one system.
The Vibration Diagnostic Loop
1
Measure
Capture
Velocity RMS plus envelope and full FFT at every point, consistent setup each cycle
2
Classify
ISO Zone
Overall level sorted into A-B-C-D against the machine's class and mounting
3
Diagnose
Read Spectrum
FFT peaks name the fault; the trend across readings confirms progression
4
Act
Work Order
Threshold breach auto-generates a prioritized CMMS work order with the finding
What a Structured Program Delivers
The payoff from vibration analysis comes not from owning a collector but from running it consistently and acting on it. These figures come from structured vibration-program field data across cement and heavy manufacturing.
50%
Less unplanned downtime
for teams running structured vibration programs
30%
Longer equipment life
from catching faults before damage propagates
Weeks
Of warning lead
envelope detection flags bearing faults well before failure
Owned
Tools, no new capital
most plants already have collectors and measurement points
The instrument is cheap; the discipline is the differentiator. Want the vibration program scoped and wired to your CMMS? Talk to our reliability engineers.
Frequently Asked Questions
Why is vibration analysis called the cheapest predictive tool?
Because most plants already own the hardware — data collectors on the shelf and measurement points on the machines — and it covers the entire rotating fleet with one method. There's usually no new capital required to start; the gap is having a structured route, consistent measurement, and ISO thresholds that turn readings into action. The instrument is cheap relative to a single prevented failure.
What's the difference between the overall level and the spectrum?
The overall RMS velocity is one number that tells you severity — compared against ISO 10816 zones, it triages a machine as healthy, watch, or shut down. The FFT spectrum decomposes the signal into frequencies, and the location of each peak names the cause: 1x for imbalance, 1x and 2x for misalignment, gear mesh for tooth wear, bearing defect frequencies for rolling-element wear. Severity says how bad; frequency says why.
Why does my reading look fine but the bearing still failed?
Almost certainly because you measured velocity alone. Velocity RMS misses early-stage bearing degradation, which lives at high frequency — by the time it shows in velocity, the fault is well advanced. Acceleration envelope detection captures the bearing-defect impacting early, which is why a predictive program pairs velocity for severity with envelope for early warning.
Can vibration analysis find electrical faults in motors?
Yes — that's one of its underused strengths. Electrical faults like stator eccentricity and broken rotor bars produce a characteristic peak at 2x line frequency (100 or 120 Hz, depending on your supply). It's a signature no mechanical check would catch, and it sits right alongside the mechanical fault frequencies in the same spectrum you're already collecting.
How many readings before a fault diagnosis is trustworthy?
Trend over time — a single spectrum is useful, but the trend across readings is far more powerful. Rising amplitude at a specific defect frequency across three consecutive readings is a much stronger signal than one elevated reading in isolation, which could be noise or a transient. Consistent measurement setup each cycle is what makes the trend reliable.
The Machine Is Already Telling You. Read It.
See Vibration Analysis Read Your Rotating Equipment — in 30 Minutes
Bring a motor, fan, pump, or gearbox you suspect. We'll classify it against ISO 10816, read the FFT spectrum for the fault signature, show the velocity-versus-envelope difference, and turn the finding into a prioritized work order — on your own equipment.