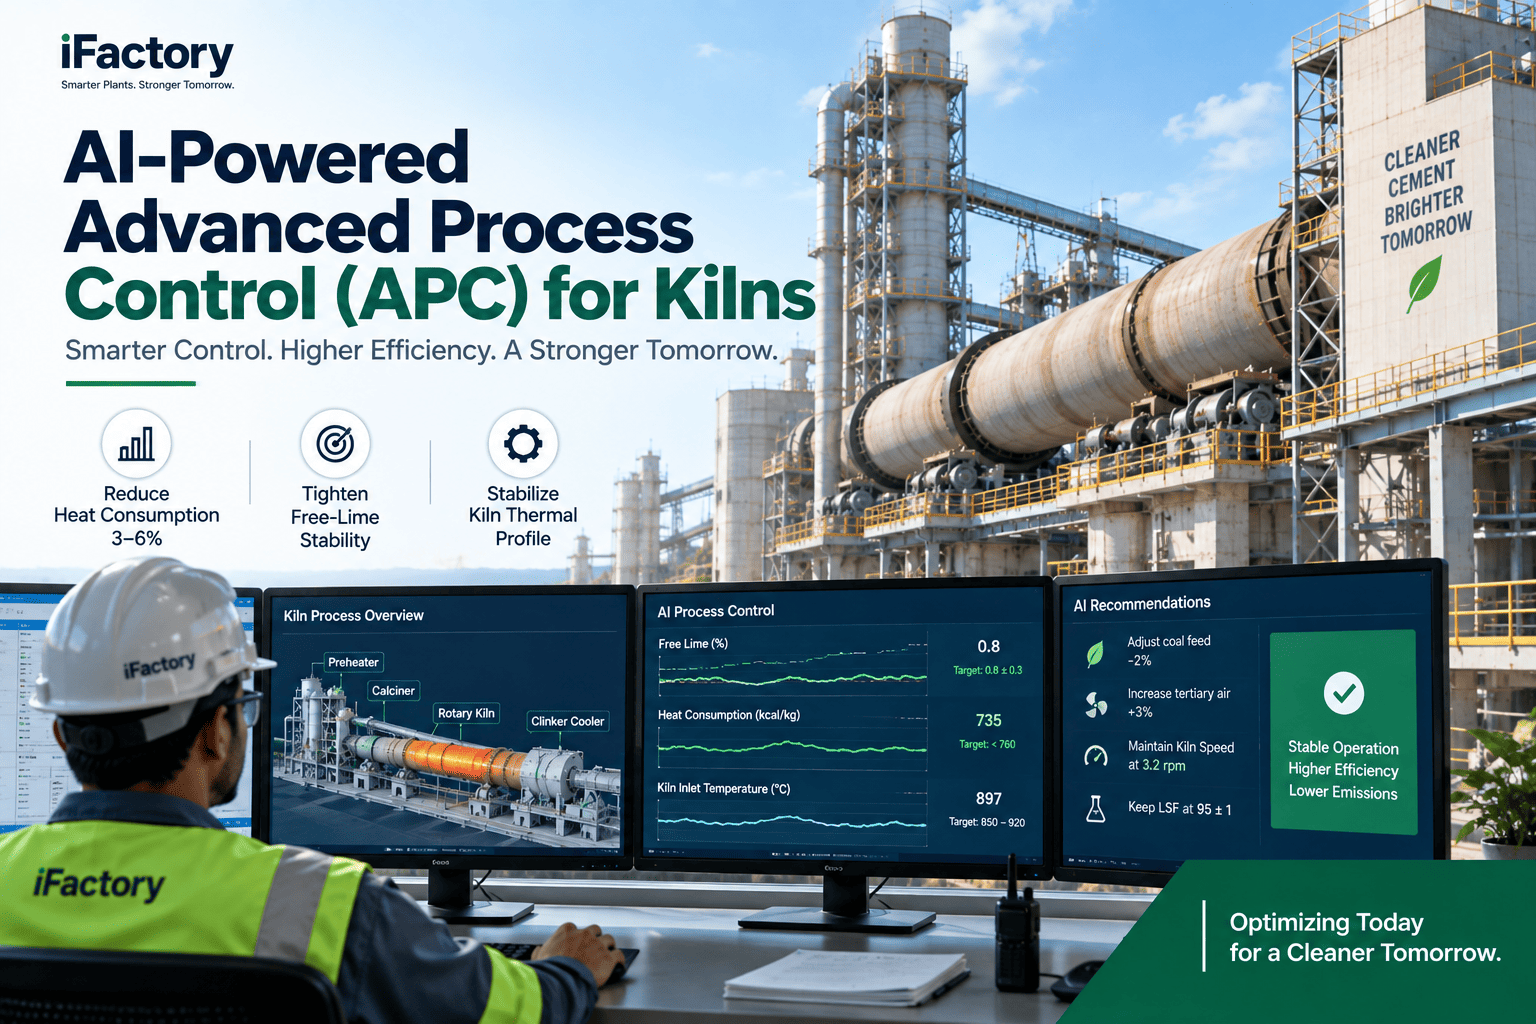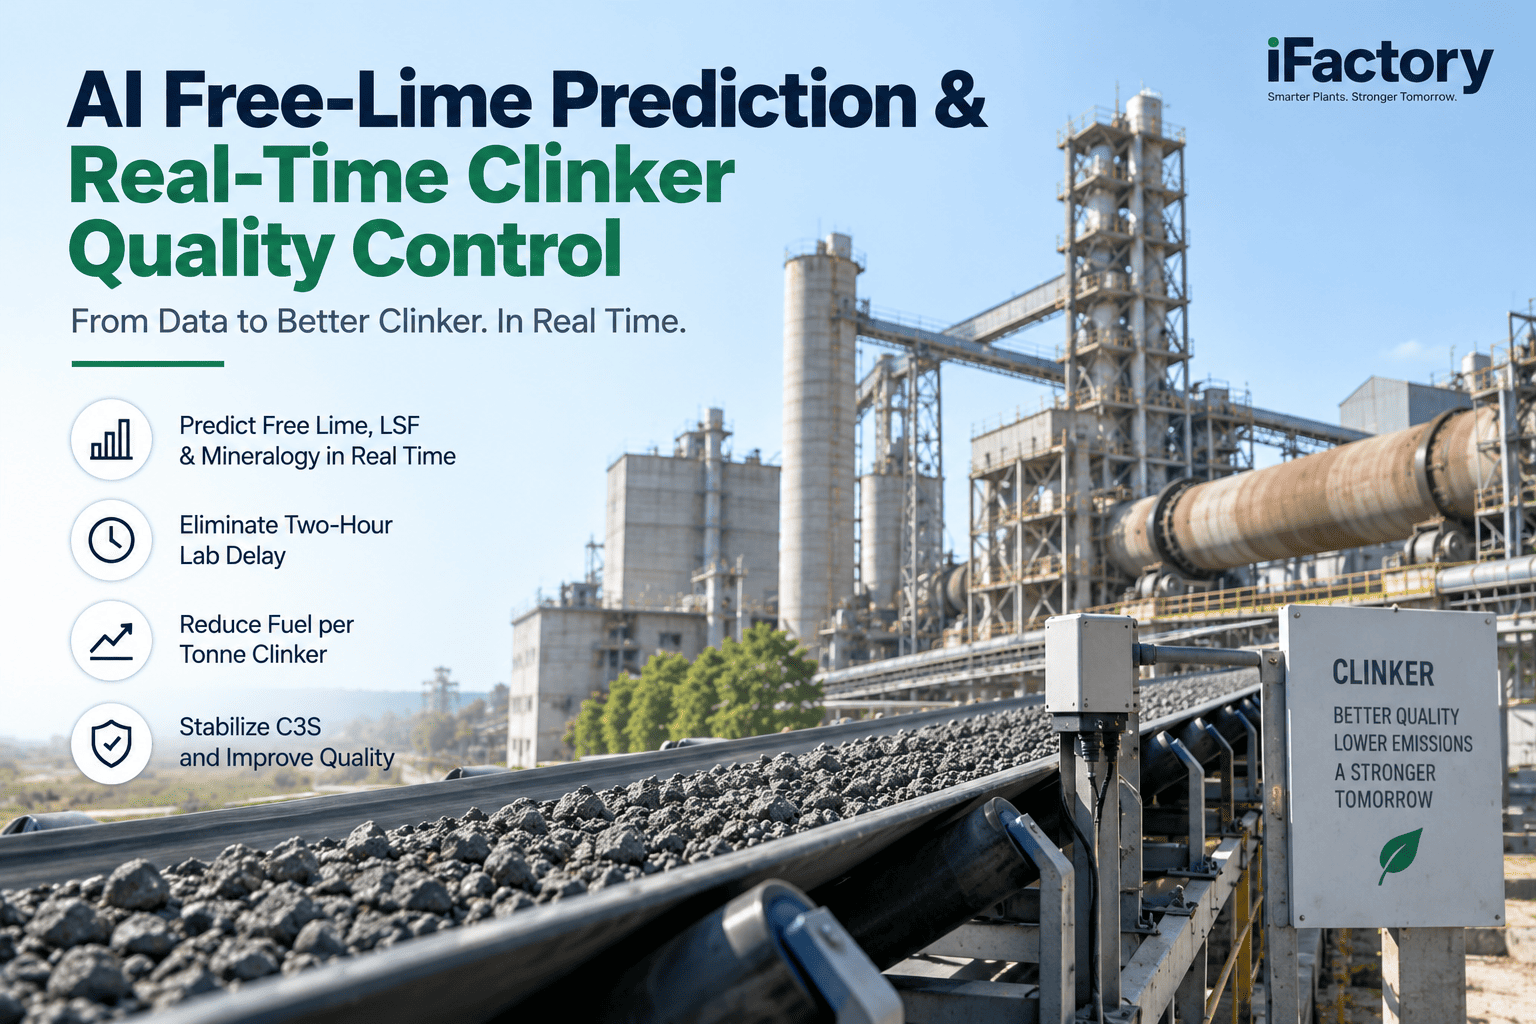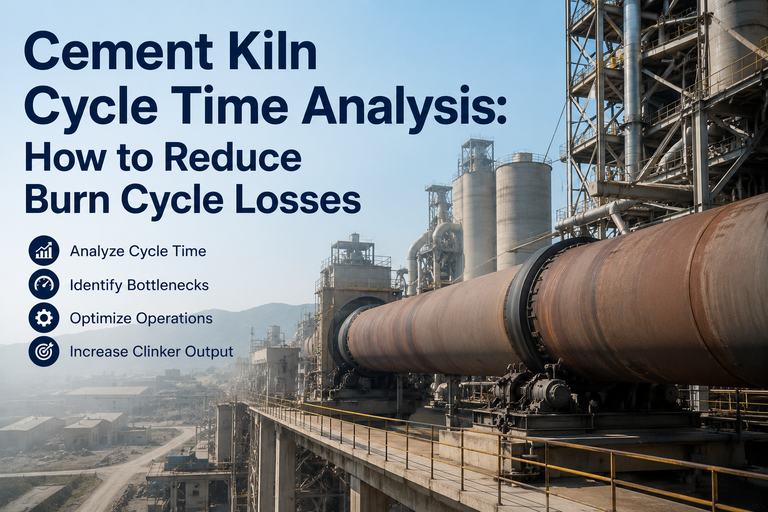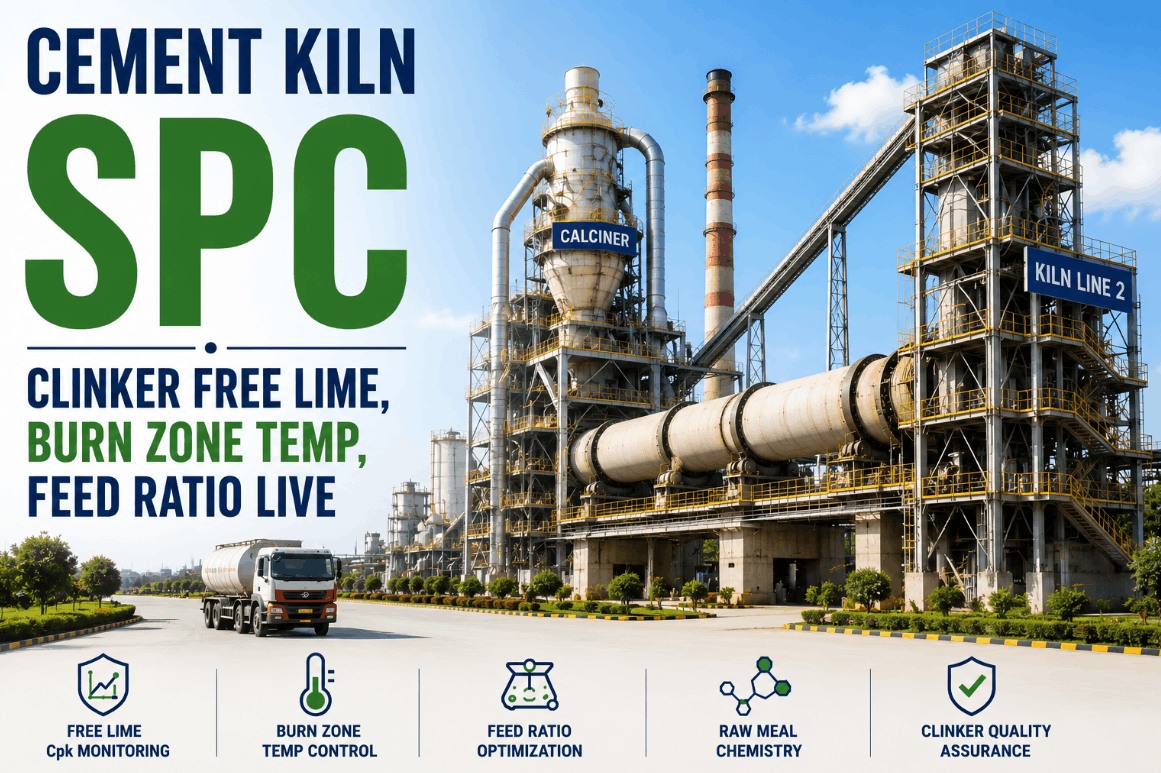
For cement plant process leads, clinker quality is never a downstream problem — it is decided in real time, inside the burning zone. The burn-zone temperature window of 1,400–1,450 °C, the calciner's fuel split, and the raw feed ratio are the three variables that collectively determine free lime (f-CaO), C₃S content, and ultimately every strength and durability specification downstream. Yet most plants still rely on lab samples collected every two to four hours — a window during which thousands of tonnes of off-spec clinker can leave the kiln undetected. Book a Demo to see how iFactory's live SPC engine closes that gap entirely.
Cement Kiln SPC — Free Lime Cpk, Burn-Zone Temp & Feed Ratio, Live
iFactory streams kiln, calciner, and raw feed data into a single live Statistical Process Control engine — delivering real-time free lime Cpk, burn-zone stability scores, and feed ratio drift alerts before off-spec clinker leaves the burning zone.
Close the 2–4 Hour Lab Delay — Today
iFactory deploys over your existing DCS instrumentation in under 75 days, delivering live SPC for free lime, burn-zone temperature, and calciner feed ratio from day one.
Why Kiln SPC Cannot Wait for the Lab
Free lime forms at temperatures that make direct measurement physically impossible. The industry standard — periodic lab sampling — introduces an information delay that forces operators into two equally costly choices: over-burn as an insurance policy (wasting 30–50 kcal/kg of fuel) or risk producing under-burned clinker with f-CaO above the 1.5% ceiling that degrades cement strength and generates customer claims. A live SPC engine that monitors kiln sensor data continuously removes that trade-off. Book a Demo to see the platform in action on a live kiln dataset.
Free Lime Excursion
f-CaO above 2.0% signals under-burning. Without real-time SPC, an excursion runs unchecked for hours — affecting concrete durability, triggering quality claims, and forcing costly rework of finished cement grades.
Burn-Zone Instability
A 20 °C drop below the 1,400 °C floor slows C₂S-to-C₃S conversion, raising f-CaO. A 30 °C overshoot damages refractory and creates dense, over-burned nodules that spike grinding energy downstream by up to 15%.
Calciner Feed Drift
Calcination degree entering the kiln directly sets the thermal load on the burning zone. Undetected feed ratio drift — caused by raw meal moisture or weight feeder wear — cascades into free lime variance within 20–40 minutes.
LSF & Raw Mill Chemistry Shift
Lime Saturation Factor drift from the raw mill propagates through the entire thermal chain. Without a live SPC link between raw mill chemistry and kiln setpoints, operators discover the excursion only when free lime deviates in the lab — hours too late.
Fuel Split Inefficiency
The calciner consumes 20–30% of total plant fuel. Manual fuel split decisions based on shift intuition routinely leave 5–10% overconsumption on the table — a direct margin loss that AI-driven SPC eliminates through continuous setpoint optimization.
Refractory & Ring Formation
Persistent thermal gradients in the burning zone accelerate refractory wear and promote coating ring formation — both of which trigger unplanned kiln stops. iFactory's shell temperature trending and zone stability scoring flag these events 48–72 hours in advance.
iFactory Kiln SPC: How the Data Flows
From raw mill to cooler, every control variable feeds a single live SPC engine. No data silos. No manual transfers. No lab-delay blind spots.
Key SPC Parameters: Control Limits & Targets
The iFactory kiln connector maps every critical variable to its SPC control lane — Xbar-R charts, CUSUM trending, and real-time Cpk scores run simultaneously across all parameters below. Book a Demo to review your current process capability against these benchmarks.
| SPC Parameter | Target Range | Failure Mode if OOC | iFactory SPC Response |
|---|---|---|---|
| Free Lime (f-CaO) | 0.5 – 1.5% | Under-burning → cement expansion failures; over-burning → hard clinker, excess grinding energy | Real-time Cpk + soft-sensor prediction 15–30 min ahead; automated alert to control room |
| Burn-Zone Temperature | 1,400 – 1,450 °C | Low → high f-CaO, low C₃S; High → refractory damage, ring formation | Zone stability score; pyrometer trend + shell scanner correlation in one view |
| Calciner Temperature | 860 – 920 °C | Incomplete calcination → excess thermal load on kiln; over-temperature → refractory and NOₓ penalty | Fuel-split SPC chart with automatic calciner setpoint recommendation |
| Raw Feed Ratio (LSF) | 95 – 98 | LSF drift → mineralogy instability, C₃S variance, inconsistent 28-day strength | Raw mill chemistry SPC linked to kiln burn model; drift detected before impact |
| Clinker Cpk (f-CaO) | ≥ 1.33 | Cpk below 1.0 → batch rejections, quality claims, downstream rework | Live Cpk dashboard per shift, per kiln; OOC rule-set (Western Electric + Nelson) with alarm routing |
Reactive vs. Real-Time SPC: Performance Benchmarks
Measured outcomes across cement plants that transitioned from manual lab-based quality control to iFactory's live SPC platform.
Deployment Tiers: Scaling from Kiln SPC to Full Pyroprocess Intelligence
iFactory's cement kiln connector is designed as a phased platform — process leads can activate Tier 1 monitoring in weeks and scale to closed-loop AI control as the model matures.
Live SPC Foundation
DCS connector activation and live SPC charting for burn-zone temperature, calciner temp, and f-CaO soft-sensor. Establishes real-time Cpk baseline and OOC alerting within 30 days.
Feed Ratio & Raw Mill Integration
Raw mill LSF, silica modulus, and feed rate linked into the kiln SPC engine. Drift in raw chemistry triggers preemptive kiln setpoint recommendations before it reaches the burning zone.
Fuel Split Optimization
AI-driven calciner fuel split recommendations based on live calcination degree and kiln thermal demand. Reduces fuel intensity while maintaining Cpk targets across shift changes and fuel grade variation.
Closed-Loop Clinker Quality Control
Full integration with cooler, finish mill, and LIMS. The SPC engine auto-correlates lab results with real-time process signatures, continuously recalibrating soft-sensor models for maximum long-term accuracy.
"Before iFactory, our process leads were essentially flying blind between two-hour lab cycles. Burn-zone adjustments were reactive — we corrected quality problems we already had, not ones we were about to create. With live SPC on f-CaO and burn-zone temperature, our Cpk went from 0.9 to 1.6 within the first quarter. We cut over-burning safety margins, saved measurable fuel per tonne of clinker, and our premium grade rejection rate dropped to near zero. This is what real process control looks like."
Regulatory & ESG Compliance: What Kiln SPC Data Enables
Real-time process data from iFactory's kiln SPC engine directly supports the audit trails required by ISO 50001, EU CBAM, EPA emission reporting, and ESG clinker factor disclosures.
| Framework | Data Requirement | iFactory SPC Contribution |
|---|---|---|
| ISO 50001 | Specific energy consumption (kcal/kg clinker) | Per-batch fuel intensity tracked in real time; SPC trend charts exportable for energy audits |
| EU CBAM | Verified clinker factor & production origin data | Immutable process logs correlate clinker chemistry with production timestamps — audit-ready |
| EPA / OSHA | NOₓ, SO₂ emission correlation with process conditions | Calciner temperature SPC logs directly correlate with CEMS emission records for compliance reporting |
| ESG Reporting | Clinker-to-cement ratio & decarbonization progress | Clinker quality Cpk data supports SCM substitution decisions; digital passport per batch for customer ESG claims |
Cement Kiln SPC: Frequently Asked Questions
Q: How does iFactory predict free lime without direct measurement in the burning zone?
iFactory uses a soft-sensor model trained on your historical DCS data — correlating burn-zone temperature, kiln torque, feed rate, and calciner conditions — to predict f-CaO within 15–30 minutes, 96% accurately, without any new in-kiln hardware.
Q: What does "live Cpk" mean for a cement process lead on the floor?
It means your f-CaO process capability index updates continuously in the control room dashboard — not once a shift from a lab sheet — so you can see a Cpk deterioration in real time and adjust kiln setpoints before the batch goes out of spec.
Q: Does the platform require replacing our existing DCS or historian?
No. iFactory connects to your existing DCS, LIMS, and process historian via standard OPC-UA, Modbus, or direct historian API — typically deployed and generating live SPC charts within 75 days without any control system replacement.
Q: Can iFactory handle kilns running alternative fuels with variable calorific value?
Yes. The AI model continuously adapts to fuel CV variation, adjusting burn-zone temperature targets and calciner fuel split recommendations in real time to maintain consistent f-CaO Cpk regardless of fuel grade changes.
Q: How long before we see measurable Cpk improvement after deployment?
Most cement plants see statistically significant Cpk improvement within the first 30–60 days of live operation, as the AI baseline period establishes normal operating envelopes and OOC alerting begins catching drift events before they become excursions.
Conclusion: Real-Time SPC Is the Foundation of Clinker Quality Control
The 2–4 hour lab cycle was never a design choice — it was a measurement limitation. Today, AI-driven soft sensors and live SPC engines have removed that constraint entirely. For cement plant process leads, deploying iFactory's kiln connector means every shift operates with the same quality visibility that was previously only available in a lab report. Free lime Cpk above 1.33, burn-zone stability scores, calciner feed ratio SPC, and raw mill chemistry drift detection — all in one dashboard, all in real time. The result is tighter clinker chemistry, lower fuel spend, fewer customer claims, and a digital audit trail that satisfies ISO 50001, EU CBAM, and ESG reporting requirements simultaneously. Book a Demo to see iFactory's live kiln SPC engine mapped to your specific process configuration.
Ready to Run Your Kiln on Live Cpk?
Connect with an iFactory cement specialist and see real-time SPC for free lime, burn-zone temperature, and feed ratio running on your kiln's actual data — in one session.