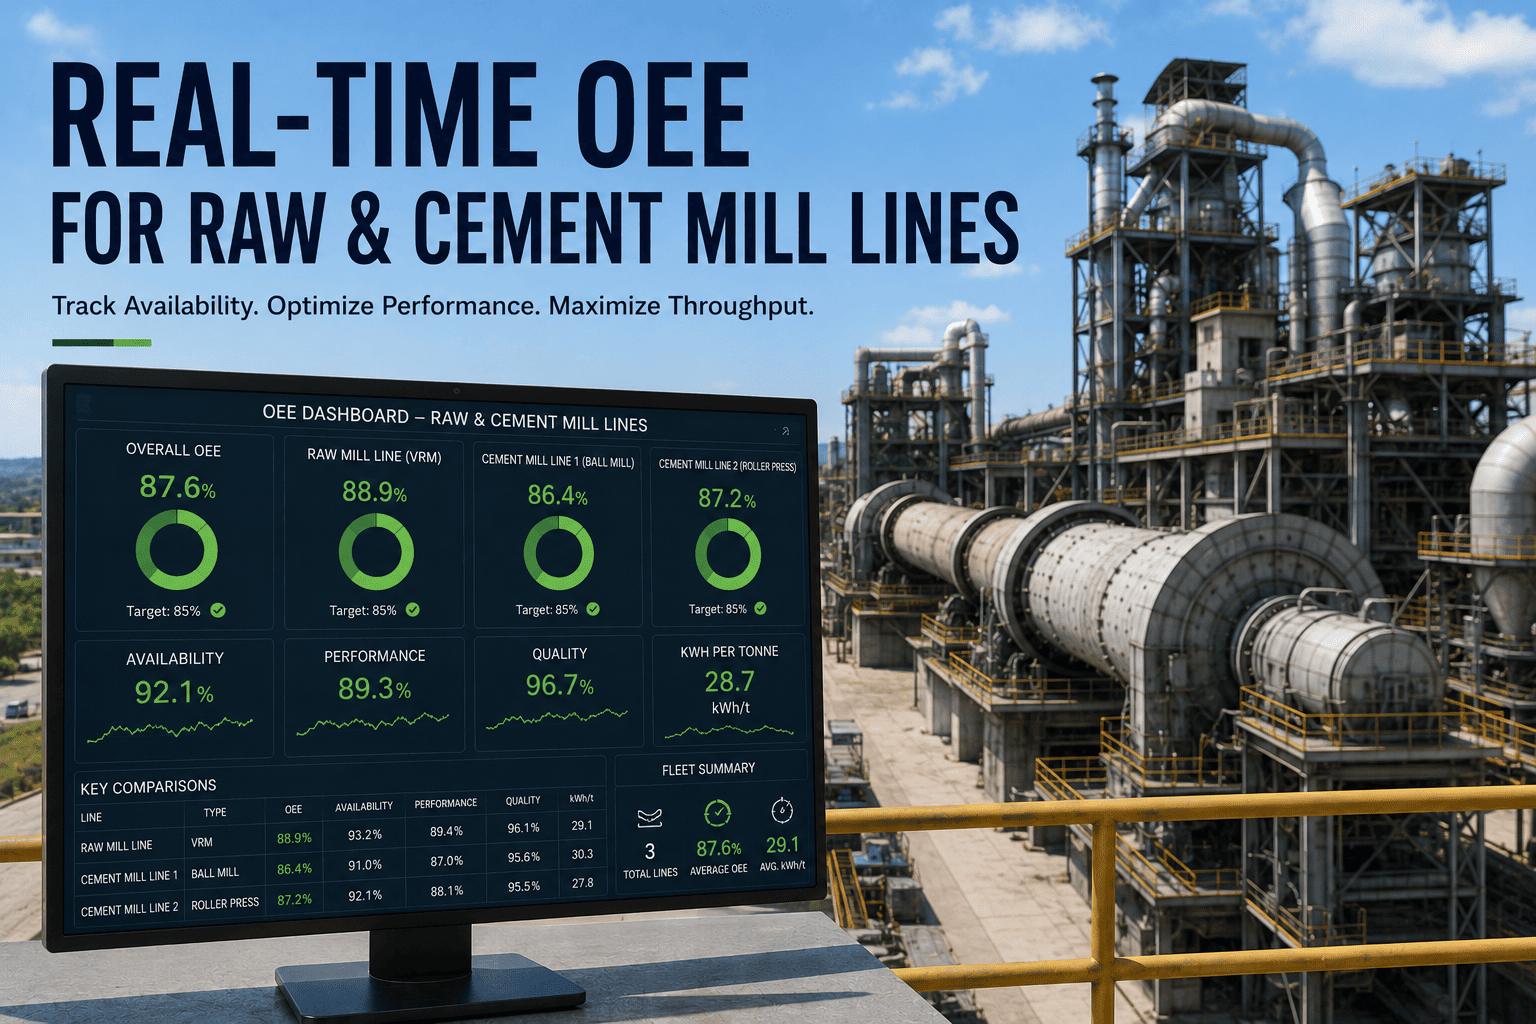
Ask a kiln superintendent how the line ran last month and you will usually get an availability number. It is the metric the daily report leads with, the one the morning meeting argues about, and the one that quietly hides the largest share of lost production. A kiln can post 90 percent availability and still be destroying a fifth of its output, because running is not the same as running at rate, and running at rate is not the same as making saleable clinker. OEE is the only number that catches all three at once, and you can book a demo to see it calculated live on your own kiln lines.
Three Respectable Numbers That Produce One Bad One
The arithmetic of OEE is unforgiving in a way that individual metrics are not, and this is precisely its value. Availability, performance, and quality multiply rather than average, so a shortfall in any one factor drags the whole score down proportionally. The worked example below uses figures that would pass without comment on almost any daily production report — and lands at a number that would not.
This is why the industry average sits where it does. Global benchmarks place cement OEE somewhere in the 65 to 72 percent range, while world-class plants operate consistently above 85 percent, and the gap between those two figures is not a mystery of process chemistry — it is an accounting problem. Losses that live inside separate departmental reports never get summed. Maintenance owns availability, production owns rate, and the laboratory owns quality, and no single report multiplies them together until the month closes.
The financial translation is direct enough to end most debates about whether the measurement matters. Every one percentage point of run factor on a 5,000 tpd clinker line is worth roughly $210,000 in annual contribution. On a 3,000 tpd kiln, a single point of availability represents around 30 additional tonnes of clinker per day. Plants operating without real-time KPI visibility have been found to lose between 8 and 15 percent of available kiln production hours annually to unplanned stoppages, and emergency repairs carry premiums estimated at over three times the cost of the same work planned.
Where the Missing Points Actually Go
A single OEE percentage is a scoreboard, not a diagnosis. What makes it operationally useful is decomposition — knowing that the eleven missing points are four points of unplanned stoppage, three points of feed rate shortfall, two points of off-spec clinker, and two points of ramp-up losses after restarts. Each of those calls for a different owner and a different intervention, and lumping them into one number invites the wrong project. The allocation below shows how the losses typically distribute on a line sitting near the industry average.
Rate loss deserves particular attention because it is structurally the hardest to see. Downtime announces itself — the kiln is either turning or it is not, and somebody writes a report. Off-spec clinker announces itself through the laboratory. But a kiln running steadily at 85 percent of design feed for six weeks produces no event, no alarm, and no report. It simply produces less, consistently, while every operational indicator reads normal. Conservative settings adopted during a process upset frequently persist for shifts or weeks beyond the original cause, and nothing in a conventional reporting structure surfaces that.
Three Definitional Traps That Make Cement OEE Meaningless
Before benchmarking anything, the definitions have to hold. Cement lines are unusually easy to flatter through measurement choices, and a plant comparing its own inflated figure against a properly calculated industry benchmark will draw exactly the wrong conclusion. Each factor below carries a specific trap, and the difference between the loose and the disciplined version is frequently worth more than ten OEE points on paper — with no change whatsoever in actual production.
The availability trap is the most consequential because it is also the most defensible-sounding. There is a legitimate argument that a planned refractory campaign should not count against equipment effectiveness, and in some frameworks it does not. The problem arises when a plant applies that exclusion, arrives at 97 percent availability, and then compares itself against a benchmark calculated without the exclusion. Benchmarking only works when every line in the comparison uses the same denominator, which is why fleet-level analytics has to enforce the definition centrally rather than accept whatever each site reports.
The Metric Set That Sits Underneath the OEE Number
OEE is the headline, but it is not diagnostic on its own — a plant needs the supporting metrics that explain why each factor sits where it does. The set below is what most cement operations converge on, with the formulas and benchmark ranges that make the numbers comparable across lines and across sites. The financial sensitivity column is the one that determines which gap gets funded first. Book a demo to see these calculated live against your own asset hierarchy.
| Metric | How It Is Calculated | Benchmark | Why It Moves Money |
|---|---|---|---|
| Kiln OEE | Availability multiplied by performance multiplied by quality | 85%+ world class, 65-72% average | The only figure capturing total production value created or destroyed by equipment condition |
| Kiln availability and run factor | Operating hours divided by scheduled hours | 88-93% dry process, 92-95% top tier | Roughly $210,000 per point annually on a 5,000 tpd line |
| Unplanned downtime share | Unplanned stop hours divided by available hours | Below 3% best in class, 6-10% median | A single kiln stop has been costed at $25,000 to $120,000 per day |
| MTBF by asset class | Operating hours divided by number of failure events | Target 8-12% improvement year on year | Rising MTBF confirms the PM programme is catching failure precursors |
| MTTR by asset class | Total repair time divided by repair events | Kiln drive gearbox under 8 hours | Cutting MTTR from 18 to 8 hours lifts theoretical availability from 97.6% to 98.9% |
| Specific heat consumption | Thermal energy per tonne of clinker produced | 750-850 kcal/kg clinker | Responds within days to cooler, burner, and preheater condition changes |
| Grinding energy intensity | Electrical energy per tonne through the mill circuit | Ball mill 28-35 kWh/t, VRM 18-25 kWh/t | The fastest-responding indicator of liner wear and charge depletion |
| PM compliance rate | Completed PM tasks divided by scheduled PM tasks | Above 90% target | Compliance below 80% correlates with 15-25% more corrective work within 90 days |
Two rows in that table are causally linked in a way worth spelling out. PM compliance is a leading indicator and unplanned downtime share is a lagging one, and the documented relationship between them — compliance dropping below 80 percent producing a 15 to 25 percent rise in corrective maintenance volume inside a 90-day window — means a compliance slip visible today is a downtime number you will report next quarter. Watching only the lagging metric guarantees you learn about the problem one quarter after you could have acted on it.
Benchmarking Lines Against Each Other, Not Against a Published Average
External benchmarks tell you whether a plant is competitive. Internal benchmarks tell you what to do about it, because a sister line running the same clinker on similar equipment has already proven what is achievable in your own operating context. The value of a fleet view is that it converts an abstract improvement target into a specific question: what is Line 2 doing during startup that Line 4 is not. The scorecard below is the structure that makes that question answerable.
The same comparison logic applies to shifts, and it is frequently more revealing than the line-to-line view because the equipment is held constant. When one crew consistently returns the kiln to full rate forty minutes faster after a stop, that difference is worth quantifying and transferring rather than leaving as an informal reputation. Shift-level OEE is also where alternative fuel handling shows up most clearly — sites running high substitution rates see meaningfully different stability depending on how burner conditions are managed, with AI-driven burner-stability logic associated with materially higher OEE than manual control at high substitution levels.
Converting Recovered Points Into a Number the Board Recognises
Every OEE conversation eventually reduces to whether the improvement is worth the effort, and cement is unusually well suited to answering that because contribution per tonne and daily capacity are both known precisely. The worked example below follows a single line from a below-benchmark run factor to a realistic improved one, using published contribution assumptions rather than optimistic ones.
That example covers availability alone. Layer in the rate and quality factors and the picture changes again, because those points are typically cheaper to recover than availability points — they require no additional maintenance spend, only the visibility to see that a line has been running eight points below design for months without anyone recording it as a loss. Closing the availability gap alone is generally understood to recover four to six OEE points, which means the performance and quality work that follows is operating on a base that is already improved.
On timing, plants moving from reactive to predictive monitoring commonly report payback in the region of six to nine months, driven substantially by the prevention of a single unplanned kiln stop and start cycle. That framing is worth holding onto during the business case discussion, because it sets a realistic and verifiable test: if the system prevents one avoidable stop in the first three quarters, it has already paid for itself, and everything the continuous measurement delivers after that is compounding return rather than justification.