Ask three plants in the same group what their grinding OEE is and you will get three numbers that cannot be compared. One counts planned maintenance as downtime, another does not. One measures throughput against nameplate, another against a rate someone set years ago. One calculates it monthly in a spreadsheet, another not at all. The result is that the single most useful management number in a grinding operation — how much of its potential each mill is actually delivering — is either missing, stale, or defined so differently that benchmarking is impossible. iFactory's OEE Analytics Suite fixes that with real-time, consistently defined OEE across every raw and cement mill — so you can finally compare a VRM, a ball mill, and a roller press on one honest scale.
OEE and Performance for Cement Plants
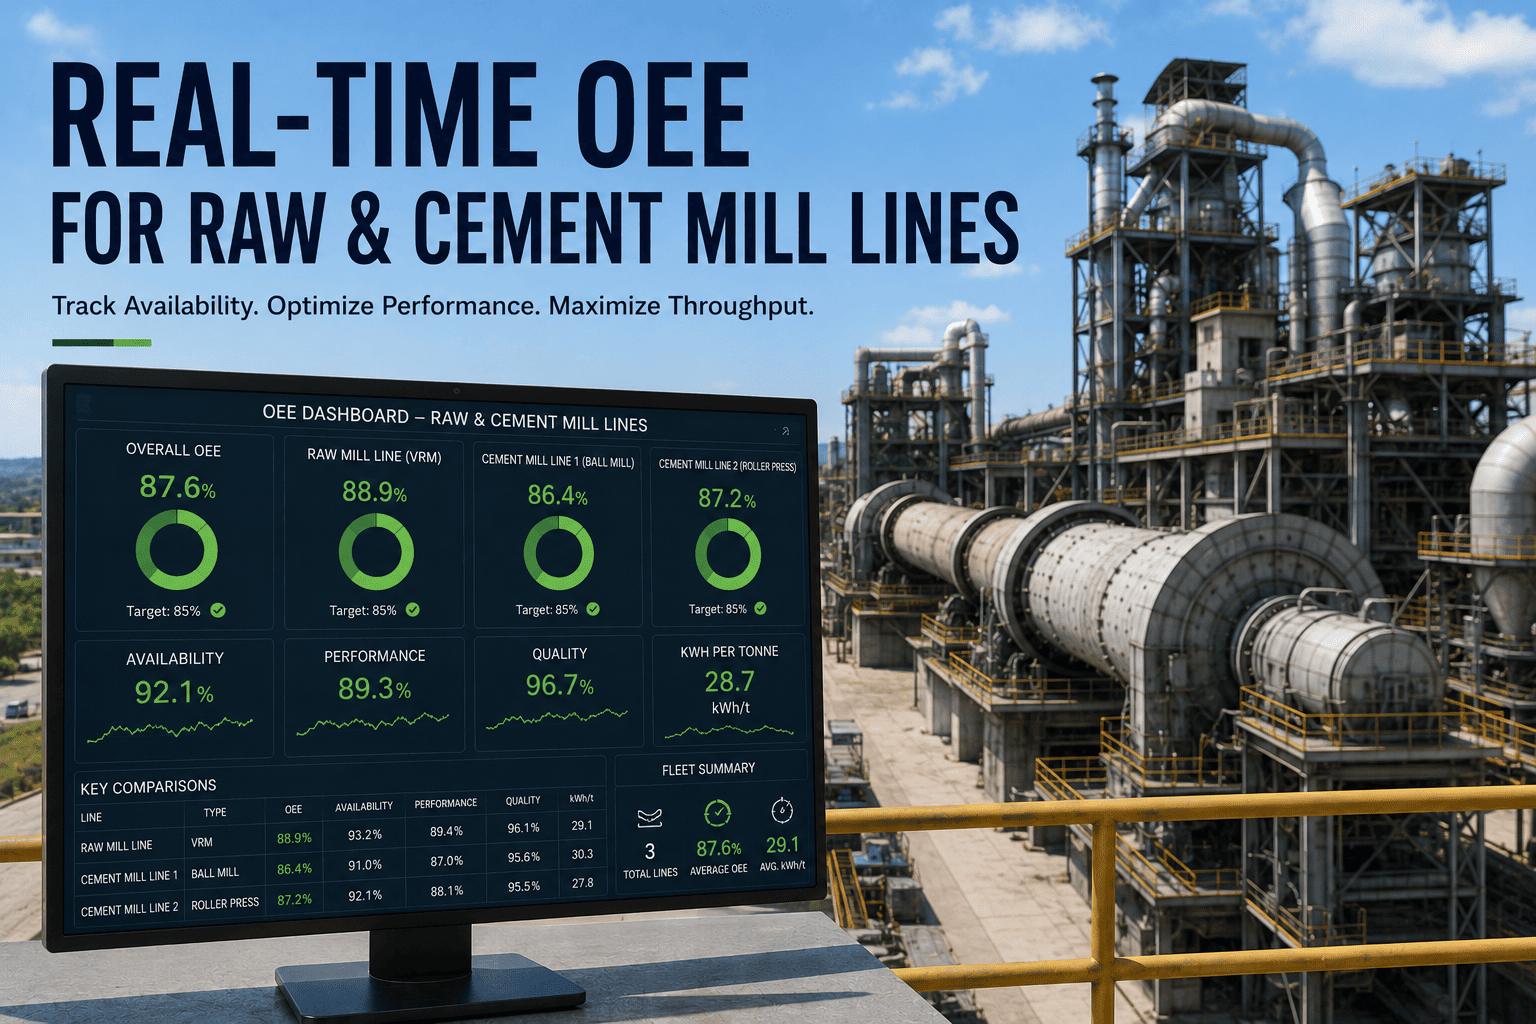
Real-Time OEE for Raw and Cement Mill Lines
Track availability, throughput, kWh per tonne, and Blaine capability for every grinding line, live and on one definition. Benchmark VRMs, ball mills, and roller presses across the fleet and see exactly where the potential is going.
OEE is only powerful when it is consistent and current. A number calculated by hand once a month tells you what happened weeks ago, and a number defined differently at each site cannot rank one mill against another. Without both consistency and speed, the biggest loss on your worst mill stays invisible, and improvement effort goes wherever the loudest complaint is rather than where the largest opportunity sits. A live, common OEE turns performance from an argument into a fact.
OEE in Three Numbers
Overall Equipment Effectiveness is the product of three simple factors. Each answers a different question about the mill, and multiplying them shows how quickly small losses compound into a large gap between what the line could make and what it does.
88%
Availability
Is the mill running when it should be? Breakdowns and stops live here.
×
82%
Performance
Is it running at rate? Slow running and minor stops live here.
×
97%
Quality
Is it making on-spec cement? Off-spec and rework live here.
=
70%
OEE
The share of true potential actually delivered.
Where the Output Actually Goes
The most useful view of OEE is the waterfall: start from all the planned production time, then watch it drain away through the classic losses until only real, good output remains. Seeing the drops side by side tells you instantly which loss is worth attacking first.
From planned time to OEE, drop by drop
The numbers are an example, but the pattern is real: the tallest drop is where your biggest gain hides. On most mills it is not the loss anyone is complaining about.
Two KPIs OEE Alone Misses on a Mill
Standard OEE tells you how much you made, but on a grinding line two more numbers decide whether it was worth it. iFactory carries them alongside OEE so the picture is complete.
Specific power (kWh/t)
A mill can hit high OEE while quietly burning too much energy per tonne. Tracking kWh/t per mill and per product exposes efficiency OEE cannot see, and makes it comparable across the fleet.
Blaine capability
The quality leg made concrete for grinding: can the mill reliably hit target fineness, and with how much margin? It turns the quality factor from a pass or fail into a real capability measure.
Benchmark the Whole Fleet on One Scale
Once every mill reports OEE the same way, the fleet lines up on a single ranking — and the conversation changes. You stop debating whose mill is best and start seeing exactly which line is furthest from its potential and what type of equipment tends to lead. That gap is your roadmap.
Fleet OEE, ranked best to worst
1
Cement Mill 2 VRM
78%
2
Raw Mill 1 VRM
73%
3
Cement Mill 1 Roller press + ball
71%
4
Cement Mill 3 Ball mill
64%
5
Raw Mill 2 Ball mill
58%
biggest opportunity
Ranked on one definition, the worst performer and the largest gap are obvious. The example is illustrative; your fleet's real order is what a demo would reveal.
Do you know which of your mills is furthest from its potential right now? Book a 30-minute demo and we'll benchmark your grinding lines on one honest scale.
From Dashboard to Decision
A number on a screen is not the point. The suite is built to move you from seeing performance to acting on it, and it pairs naturally with optimization and predictive maintenance to actually close the gaps it reveals.
See
Live OEE, kWh/t, and Blaine capability for every mill, one definition.
Find
The biggest loss on each line and the widest gap across the fleet.
Fix
Prioritize the highest-value action and close it with optimization or PdM.
What Real-Time OEE Delivers
Making performance visible, current, and comparable turns grinding from a black box into a managed asset — and it points every improvement effort at the place it pays most.
Live
Performance view
real-time OEE, not a monthly spreadsheet
One
Definition
every mill comparable across the fleet
Clear
Biggest loss
the largest opportunity, no longer hidden
kWh/t
In context
energy efficiency tracked beside output
Frequently Asked Questions
How do you make OEE comparable across different mill types?
By applying one consistent definition of availability, performance, and quality, with each mill's performance measured against its own appropriate ideal rate. A VRM, a ball mill, and a roller press have different rated capacities, but OEE expresses each as a percentage of its own potential, so the resulting scores are directly comparable even though the machines are not identical.
Where does the data come from?
From the systems you already run: your control system, historian, and quality data. iFactory pulls run status, throughput, power, and quality results, applies the common OEE definition automatically, and presents it live. There is no manual monthly calculation and no dependence on someone remembering to update a spreadsheet.
Is this just a dashboard, or does it help us improve?
It starts by making performance visible and comparable, which is the necessary first step, but the value is in what follows. The suite highlights the largest loss on each line, and because it sits alongside iFactory's optimization and predictive maintenance, the gaps it exposes can be closed directly rather than just reported.
Does it cover both raw mills and cement mills?
Yes. Both are grinding lines with the same three OEE factors, and both benefit from live, comparable measurement. Raw mills carry the added chemistry dimension and cement mills the fineness dimension, and the suite reflects the right quality measure for each while keeping the overall OEE consistent across the fleet.
How quickly can we see our numbers?
Once connected to your data sources, OEE can be computed and displayed live, with history built from your existing records. The best next step is a demo where we stand up OEE for your grinding lines and show the fleet ranking and the biggest loss on your weakest mill.
Put Every Mill on One Honest Scale.
See Your Grinding Fleet Ranked in Real Time
Bring your mill run, throughput, power, and quality data. We'll stand up live OEE on one definition, rank your raw and cement lines, and show the biggest loss and the largest gap across the fleet.