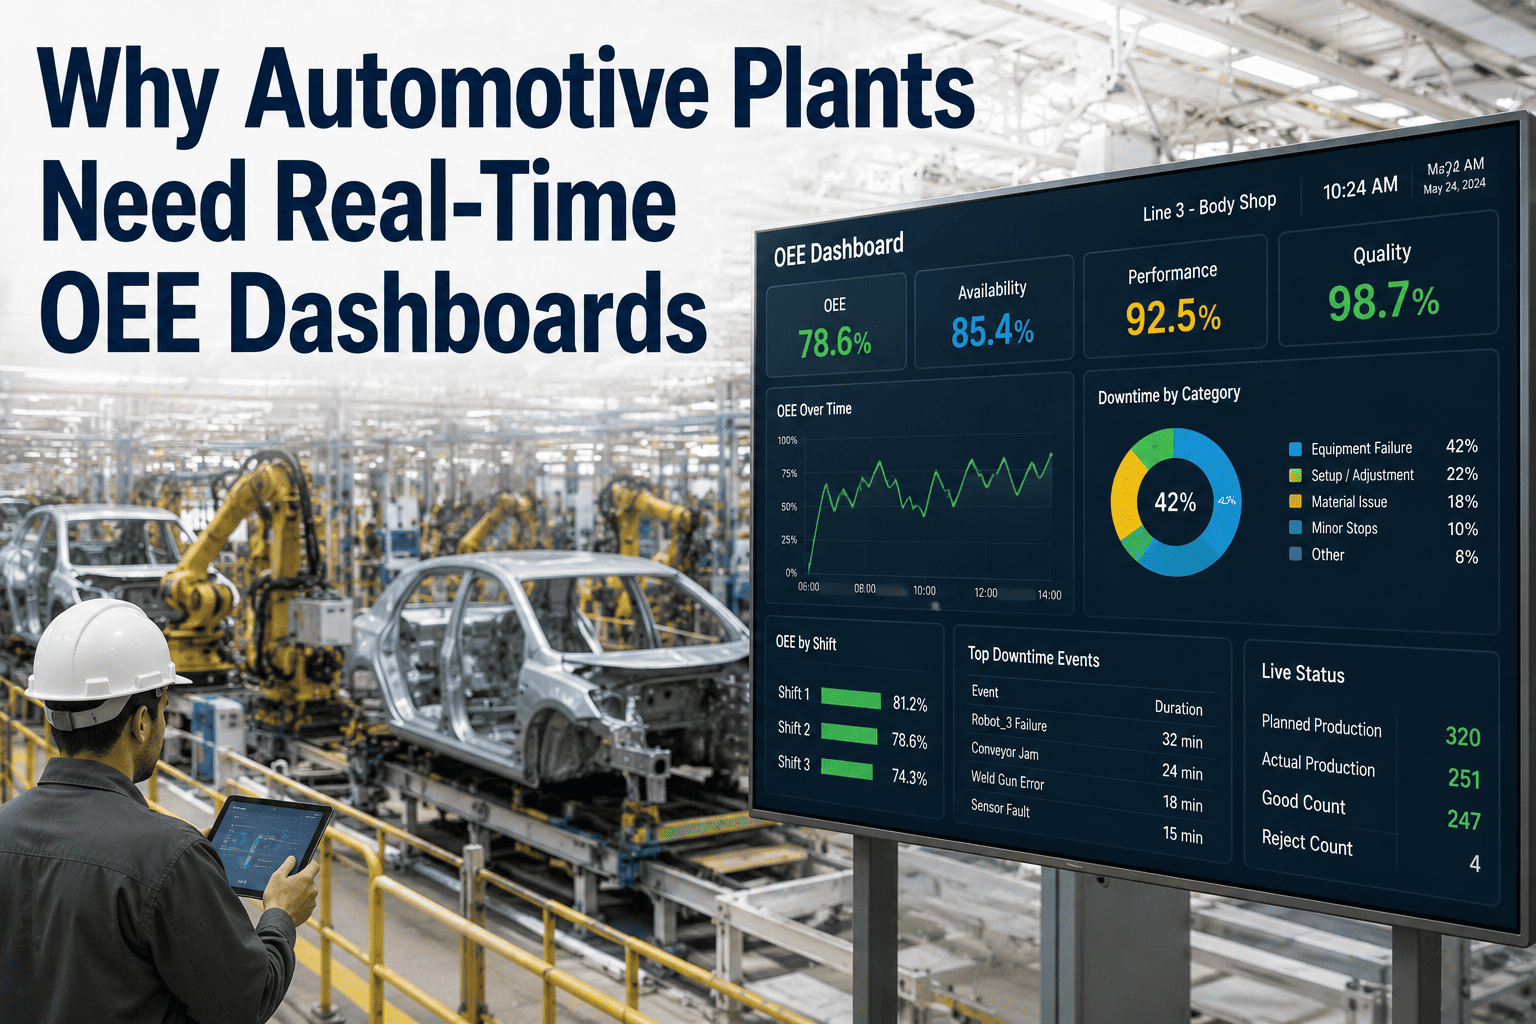
An automotive plant loses $639 every second the line is down. Multiply that up: $38,333 per minute, $2.3 million per hour, and by the time the shift ends it's an eight-figure hole. That is the Siemens True Cost of Downtime number — and it explains why the biggest gap in an auto plant is no longer the equipment. It's the loop between the moment a problem starts and the moment somebody starts fixing it. In the average paper-and-radio plant, that loop is 15–30 minutes. In a plant running a properly built real-time OEE dashboard, it is under two minutes. Every minute you shave off that loop pays for the system twice.
iFactory Real-Time OEE
Real-Time OEE Dashboards Built for Automotive Plants — Where One Hour Costs $2.3M
Sub-second signal capture, station-level visibility, digital andon, and cause-tagged downtime — the loss-to-action loop compressed from 30 minutes to under two. Layered on your existing PLC, SCADA and MES stack.
$639
automotive downtime cost / sec
$2.3M
per hour of unplanned stop
42%
of stops from equipment failure
60%
faster response with digital andon
What Downtime Actually Costs Your Plant, By the Clock
Automotive is the highest-per-hour downtime cost in manufacturing — higher than semiconductors, higher than oil and gas, higher than pharma. Because JIT supply chains have no buffer, every second a station is silent is a second the whole downstream cascade is silent too. This is what one stopped line looks like on the clock.
Per second
$639
The number ticking while operators walk to find a supervisor.
Per minute
$38,333
A five-minute delay in detection is nearly $200k gone before work even begins.
Per hour
$2.3M
The Siemens True Cost of Downtime automotive benchmark.
Per shift
$18.4M
One bad eight-hour shift approaches many plants' annual OEE-improvement budget.
The Loss-to-Action Loop — Where the Real Waste Lives
The equipment failing is only the first event. Everything that happens between the failure and the first turn of a wrench is loss. Paper-and-radio plants routinely burn 15–30 minutes here. A real-time OEE dashboard compresses the same loop into under two.
Paper & radio plant
15-30 minutes
2-5 min
Operator notices the stop
1-3 min
Walks to find the supervisor
3-8 min
Supervisor calls the right team
5-15 min
Response arrives with partial info
3-6 min
Diagnose problem on-site
Fix begins
$9,500 to $19,000 lost before starting
Real-time OEE dashboard
Under 2 minutes
<1 sec
Sensor captures stop event
<5 sec
Alert routed to right role
<10 sec
Cause code auto-tagged, context attached
<30 sec
Response team arrives, briefed
<90 sec
Diagnosis pre-completed via data
Fix begins
Under $1,300 lost before starting
Andon Evolution — From a Cord to a Cloud
Toyota introduced the andon cord in the 1970s: any operator could stop the line by pulling a rope. The idea has never been wrong — but everything that happens after the signal has changed completely. Here is where most auto plants sit today, and where the real-time OEE dashboard puts them.
1970s
Andon Cord
Physical rope above the line. Zero data capture. Supervisor walks over on foot.
1990s
Tower Lights
Coloured lamps on each station. Faster visual signal, but still nothing logged and no cause data.
2010s
MES Boards
Static shift boards updated hourly. Better history, but by the time it's on the board, the moment has passed.
Today
Real-Time Cloud Dashboard
Sub-second events, station-level tiles, auto-routed alerts with cause codes, mobile visibility for anyone with the badge.
What Lives on the Real-Time Automotive OEE Dashboard
A good dashboard is not a spreadsheet on a screen. It is a live command surface — one glance and the supervisor knows what to do next. iFactory ships six tiles designed specifically for automotive assembly, stamping, weld and paint lines.
Tile 01
Live Shift OEE vs Target
Current shift Availability × Performance × Quality against target, updated every cycle. Colour-coded so a supervisor knows in one look whether the shift is on plan or behind.
Tile 02
Station-Level Status
Every station on the line as a coloured tile — running, starved, blocked, or down. The station causing the cascade is visible instantly.
Tile 03
Downtime Timer + Cause
Live seconds counter on every active stop, with cause code already attached. No more "who logs this?" — the system does.
Tile 04
Micro-Stop Rate
Sub-3-minute stops per hour, per station. Invisible on paper logs, brutal to throughput — and often the fastest win once measured.
Tile 05
Quality & First-Pass Yield
Live reject rate, defect Pareto, and cross-linked stop events. Ties quality failures back to the station and shift that caused them.
Tile 06
Cause Code Pareto (Shift + Rolling 7-Day)
The top downtime causes for the current shift and the last week, ranked by minutes lost — so the daily standup opens with the number one problem, not the loudest opinion.
Want to see the tiles live on your own line data? Book a demo and we'll walk a real automotive plant dashboard end-to-end.
The JIT Cascade — Why One Stopped Station Costs More Than One
Automotive downtime does not stay in the station that failed. Just-in-time production has no buffer — a stopped weld cell backs up paint, starves final assembly, missed shipments trigger OEM line-down charges, and warranty exposure rises on batches produced just before the failure. This is the cascade a real-time dashboard breaks by catching the trigger event in seconds instead of minutes.
1
Weld Cell Stops
One robot fault. No buffer. Line paused.
2
Paint Backs Up
Bodies queue at paint entry. Air-flow and temperature drift begin.
3
Final Assembly Starves
Downstream stations idle. Labour cost accrues without output.
4
Shipments Miss
Truck slots slip. Airfreight substitution charges get quoted.
5
OEM Line-Down Charge
Tier-1 penalty, warranty review, CSI hit. Total cost 3-5x the primary loss.
iFactory's Automotive Real-Time Dashboard Kit
You can't compress a loss-to-action loop with a screen alone. You need the signal capture layer, the routing logic, the mobile reach, and the audit-ready record — all of which iFactory ships as one platform on top of the PLC, SCADA and MES stack you already own.
Sub-Second Signal Capture
Direct PLC and OPC-UA read at cycle rate. Every state transition timestamped to the millisecond — no manual button-press dependence, no under-counted micro-stops.
Digital Andon Routing
Data-triggered alerts routed by station, shift, severity and skill. Soft-stop, hard-stop or notify-only, configured per alert type. No cord to pull, no whistle to hear.
Cause-Code Auto-Tagging
Machine state combined with recipe, PLC fault codes and cycle-history to auto-suggest cause codes at the moment of stop. Operator confirms in one tap.
Multi-Screen Deployment
Floor screens, supervisor mobile, plant-manager desktop, executive rollup — same live data, right level of detail per role. Unlimited viewers, no per-seat drag.
Rolling Pareto & Trend
Shift, day, 7-day and 30-day rolling loss Pareto in one click. Standups open on the top cause, not the loudest voice — and improvement traction is visible in the trend line.
IATF 16949 Audit Trail
Every event attributable, time-stamped and retained — auditable end to end for IATF 16949, VDA 6.3 and OEM-specific requirements. Compliance falls out of the same data that runs the shift.
What Auto Plants Report After Rollout
These are outcomes automotive operators typically see within the first three to six months of moving from paper-and-radio loss reporting to a real-time OEE dashboard. Payback in the highest-cost sectors is measured in weeks, not quarters.
15-30x
Loss-to-action loop
30 min collapses to under 2 min end-to-end
40-60%
Unplanned stops cut
via micro-stop attack and early-warning routing
3-6 mo
Typical payback
one prevented major stop often covers the year
One week
To first line live
layered on existing PLC / SCADA / MES stack
Want the number for your own plant? Talk to our automotive team and we'll build a real-hour cost model on your production rate.
Frequently Asked Questions
Do we need to rip out our MES or SCADA to install a real-time OEE dashboard?
No. iFactory layers on top of the automation stack you already have — PLC, SCADA, MES, historian. It reads the OPC-UA and OPC-DA tags your plant already publishes and adds sub-second capture where it doesn't. There is no rip-and-replace, no line requalification, and typical first-line go-live is one week.
How does the dashboard capture the tiny micro-stops paper logs always miss?
By reading the machine directly at cycle rate. Every state transition — running, starved, blocked, faulted — is timestamped to the millisecond, so sub-3-minute stops are captured whether or not an operator remembered to log them. That is where 40–60% of the recoverable OEE typically hides.
Can we still let operators pull the andon — or does the digital system replace them?
Both. The dashboard captures machine-driven signals automatically and lets any operator raise a manual signal from the HMI or a mobile device. Per-alert stop behaviour is configurable — a material shortage might notify the material handler while the line keeps running, an equipment fault holds the affected station only, a safety event hard-stops the line. The philosophy Toyota established in the 1970s is preserved; only the plumbing changes.
Does the audit trail satisfy IATF 16949 and OEM-specific requirements?
Yes. Every event is attributable to a unique user or system source, contemporaneously timestamped, retained for the required period, and auditable end to end. IATF 16949, VDA 6.3, and OEM-specific line-performance reporting are supported out of the box — because the same live data that runs the shift is what the auditor eventually asks for.
What is the realistic payback in an automotive plant?
Fast. Because a single hour of automotive downtime carries a $2.3M cost benchmark, one prevented major stop typically covers a full year of program cost. Most auto plants see payback in three to six months from a combination of faster response, micro-stop reduction, and OEM line-down avoidance. Book a demo and we'll build the model on your specific production rate.
Every second the dashboard is not live, it's $639.
See What a 2-Minute Loss-to-Action Loop Looks Like on Your Line
In a 30-minute demo we'll walk a live automotive dashboard, show the station-level tiles and cause-tagged downtime that compress your response loop, and build the real-hour cost model on your plant's actual production rate — layered on your existing stack, first line live in a week.
1 week
to first line live
IATF
audit trail by design