Real-Time SPC Monitoring Software for Statistical Process Control
By Larry Eilson on April 25, 2026
A pharmaceutical packaging line in Hyderabad ran for fourteen straight months hitting every internal quality target — 99.4% pass rate at final inspection, no customer complaints, audit-ready paperwork. Then a routine capability study revealed something nobody saw coming: the fill-weight process was running at Cpk 0.91. Mathematically, that meant 2,700 defective units per million were leaving the line — roughly 8,100 bad units a month — and pass/fail inspection was simply too coarse to catch them. The plant had been winning the inspection game while losing the process game. Three weeks after switching from end-of-line inspection to real-time SPC monitoring with continuous Cp/Cpk tracking, the team identified a temperature-correlated drift, repositioned a sensor, and pushed Cpk to 1.61. Defect rate dropped from 2,700 ppm to roughly 0.6 ppm — a 4,500x improvement — without a single new piece of production equipment. That is the difference real-time SPC makes. Not better inspection. A fundamentally smarter process.
iFactory Quality Intelligence
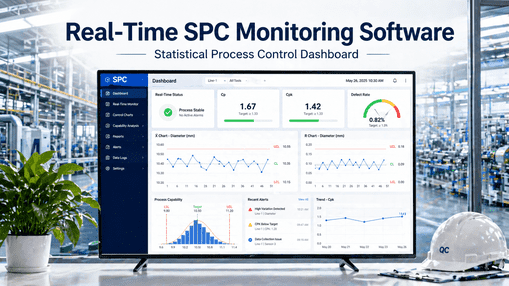
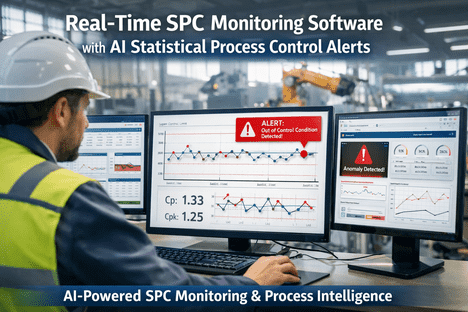
Real-Time SPC Monitoring Software for Statistical Process Control
Live control charts, continuous Cp/Cpk tracking, automated Western Electric rules, and AI-powered alerts that catch process drift before a single out-of-spec unit reaches your customer.
Pass/fail inspection tells you whether a unit meets specification. SPC tells you whether the process producing those units is capable of meeting specification — and that is the only metric that scales. A plant running at Cpk 0.9 generates 2,700 defects per million units even when 97.3% of inspected units pass. Inspection cannot find what inspection does not look for. SPC, properly implemented, makes the process itself trustworthy.
Inspection-Led Quality
Reactive — Catches Defects After They Exist
01
Defects exist before detection — every bad unit consumed material, time, and capacity
02
Sampling lag means hours or shifts of bad product before anyone knows
03
Pass rate looks great while Cpk silently collapses underneath
04
Capability studies happen monthly or quarterly — drift goes unseen for weeks
Real-Time SPC
Predictive — Catches Drift Before Defects
01
Process trends flagged before any unit goes out of spec
02
Sample-by-sample updates — the chart moves with every measurement
03
Rolling Cpk shows capability drift live, not in next month's report
04
Eight Western Electric rules + four Nelson rules fire automatically on every chart
The Cpk Ladder — What Your Capability Number Actually Means
Most quality teams know Cpk should be greater than 1.33. Few have internalized the brutal mathematics of what each rung on the ladder means in real defective parts shipped to customers. The numbers below are pulled directly from the statistical tables — not projections, not marketing math.
Cpk Value
Defects per Million
Yield
Status
0.67
45,500 ppm
95.45%
Not Capable
0.90
2,700 ppm
99.73%
Not Capable
1.00
1,350 ppm
99.865%
Marginal
1.33
63 ppm
99.9937%
Industry Standard
1.67
0.57 ppm
99.99994%
Excellent
2.00
0.002 ppm
99.9999998%
Six Sigma
Want to know exactly where your critical processes sit on this ladder — in real time, not in next quarter's report? Book a 30-minute SPC walkthrough and see live Cp/Cpk on your data structure.
Anatomy of a Live Control Chart
The X-bar chart is the workhorse of SPC. Sigma zones around the centerline are where Western Electric rules fire — pattern detection that catches process changes long before any single point breaks the control limits. This is the visual grammar your operators read every shift.
X-bar Control Chart with Western Electric Zones
In control — random variation around centerline
Trend warning — six points trending upward (Rule 3)
Out of control — points in Zone A or beyond control limits
The Eight Western Electric Rules — Decoded
Walter Shewhart's math told us when a process was out of control by control-limit breaches alone. The Western Electric Handbook (1956) added pattern rules that catch subtler shifts long before a point ever crosses the line. iFactory evaluates all eight on every sample, automatically — with severity tuning per parameter to prevent alert fatigue.
1
Beyond 3σ
A single point falls outside the upper or lower control limit. The classic Shewhart out-of-control signal — investigate immediately.
2
9 in a Row
Nine consecutive points on the same side of the centerline. Indicates a sustained mean shift even without any limit breach.
3
6 Trending
Six consecutive points all increasing or all decreasing. Tool wear, temperature drift, or material aging often look like this.
4
14 Alternating
Fourteen consecutive points alternating up and down. Suggests two interleaved data streams or sampling system issues.
5
2 of 3 in Zone A
Two out of three consecutive points fall in Zone A on the same side. Early warning of a developing mean shift.
6
4 of 5 in Zone B
Four out of five consecutive points in Zone B or beyond on the same side. Confirms the shift Rule 5 hinted at.
7
15 in Zone C
Fifteen consecutive points within ±1σ of centerline. Suspiciously low variation — often indicates incorrect limits or stratification.
8
8 Outside Zone C
Eight consecutive points beyond ±1σ on either side. Indicates mixed populations or bimodal process behavior.
Choosing the Right Control Chart for Your Data
The fastest way to wreck an SPC deployment is picking the wrong chart for the data. iFactory auto-detects whether your measurements are continuous or discrete, subgrouped or individual — but the engineer in the room should always understand why a particular chart was chosen.
Scroll to see all chart types
Chart Type
Data Type
When to Use
X-bar & R
Continuous, subgrouped (n = 2 to 9)
Dimension, weight, temperature with rational subgroups taken at each time point. The default workhorse.
X-bar & S
Continuous, subgrouped (n ≥ 10)
Same use as X-bar & R but uses standard deviation instead of range — more accurate for larger subgroups.
I-MR
Continuous, individual (n = 1)
Low-volume or high-cost parts where rational subgrouping is impractical. Uses moving range for variation.
EWMA / CUSUM
Continuous, sensitive
Exponentially weighted & cumulative-sum charts catch small drifts (under 1σ) that Shewhart charts miss.
p-chart
Attribute, varying n
Proportion of non-conforming units when subgroup size varies sample to sample.
np-chart
Attribute, fixed n
Same use as p-chart but plots absolute count of non-conforming units when subgroup size stays fixed.
c-chart
Defect count, fixed area
Count of defects per item when inspection area or unit size stays the same across samples.
u-chart
Defect count, varying area
Same as c-chart but normalized for varying inspection area or sample size.
How Modern SPC Connects to Your Plant Floor
The death of an SPC project is manual data entry. Operators key numbers into spreadsheets, errors creep in, latency builds up, and within months everyone gives up. Real-time SPC works because data flows automatically from the equipment that already produces it. iFactory pulls live measurements from PLCs, CMMs, vision systems, and inline gauges — and when manual entry is genuinely needed, tablet-based capture replaces clipboards.
Live charts, rolling Cp/Cpk/Pp/Ppk, Western Electric & Nelson rules, AI drift detection
4
Act
Alert & Route
Tiered alerts to operators, engineers, and quality leads via SMS, email, dashboards
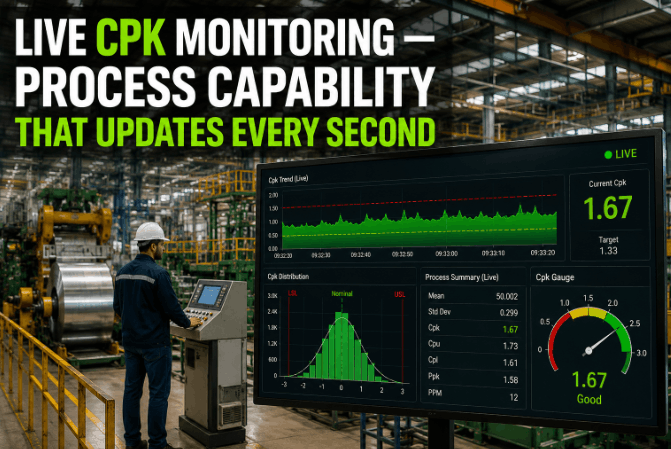
The Capability Toolkit — Every Index, Calculated Continuously
Most SPC platforms calculate Cp and Cpk and stop there. iFactory continuously tracks the full capability family — short-term and long-term, two-sided and one-sided, centered and target-shifted — so quality engineers always have the right index for the conversation.
Cp
Process potential — spec width vs process spread, ignores centering
Cpk
Adjusted for centering — the most-cited capability index
Pp
Performance potential using overall sigma — long-term view
Ppk
Long-term capability with centering — what audits actually want
Cpm
Penalizes deviation from target, not just from centering
DPMO
Defects per million opportunities — the language executives understand
iFactory tracks all of these continuously, sample by sample — not in scheduled studies. Want to see your real Cpk drift live? Talk to our quality engineers.
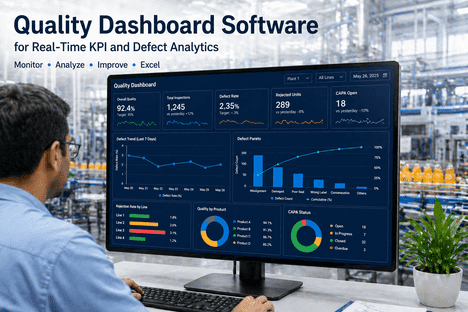
What Real-Time SPC Actually Delivers
The case for SPC is not philosophical. It is measured in scrap reduced, complaints prevented, capacity reclaimed, and audit time recovered. These are the outcomes our deployment data shows across pharmaceutical, FMCG, automotive, and electronics manufacturers running iFactory SPC in 2025–2026.
68%
Reduction in scrap rate
on critical-to-quality dimensions within 90 days
94%
Less time on capability calcs
automated rolling Cpk replaces monthly studies
4–6 hrs
Earlier drift detection
vs end-of-shift inspection sampling
45–90 days
Typical ROI payback
on a 10–20 parameter pilot deployment
Frequently Asked Questions
What is the difference between SPC and end-of-line inspection?
Inspection asks "is this unit good or bad?" SPC asks "is the process producing good units stable and capable?" A plant can have 99% inspection pass rates while running at Cpk 0.9 — meaning 2,700 ppm are mathematically defective. SPC monitors the process itself so drift is caught before defects exist, rather than after. Both have their place, but SPC is the only one that scales with volume.
Do I need expensive new measurement equipment to start SPC?
Almost never. Most plants already collect the measurement data SPC needs — it just lives in spreadsheets, paper logs, or PLC tags nobody is using. iFactory connects to PLCs via OPC-UA, Modbus, and EtherNet/IP, pulls CMM data via Q-DAS or DMIS, and supports tablet-based manual entry where automated capture is not yet practical. A typical pilot covers 10–20 parameters with no new metrology hardware.
What Cpk should we target for our processes?
Industry-standard capable processes target Cpk ≥ 1.33 (about 63 ppm). Automotive and aerospace customers typically demand Cpk ≥ 1.67 (under 1 ppm). Six Sigma manufacturers chase Cpk ≥ 2.00 (essentially zero defects). The right target depends on the consequence of a defect — a low-cost consumable can live at 1.33, while a safety-critical aerospace component should never sit below 1.67.
Will SPC alerts overwhelm operators with noise?
They will if the system fires every rule equally on every parameter. iFactory routes alerts through a four-tier escalation path with per-parameter rule tuning — operators see only what is actionable on their line, engineers see what needs investigating, and management is pulled in only when the process is genuinely trending out of control. Alert fatigue is a configuration problem, not an SPC problem.
How long does it take to roll out real-time SPC?
A focused pilot on 10–20 critical-to-quality parameters typically goes live in 4–6 weeks: one week for data connection, two for chart setup and rule configuration, then operator training and calibration. Full plant rollout depends on parameter count and integration complexity — most sites cover their full critical parameter list within 4–6 months and see measurable scrap reduction within the first 90 days.
Is iFactory SPC compliant with AIAG, ISO, and FDA standards?
Yes. Every deployment ships audit-ready for AIAG VDA SPC standards, ISO 9001 / IATF 16949 quality management requirements, and FDA 21 CFR Part 11 electronic records and signatures for regulated pharmaceutical and medical-device environments. Audit packs include time-stamped chart history, signed rule violation acknowledgments, capability study reports, and full data lineage from sensor to chart.
Stop Inspecting Defects. Start Preventing Them.
See Your Live Cp/Cpk on Your Real Production Data — In 30 Minutes
Bring a process you suspect is drifting. We will plug in sample data, build the chart live, fire the Western Electric rules, calculate rolling capability, and show you exactly where the leverage is. No slides — just your numbers, on a real SPC platform.