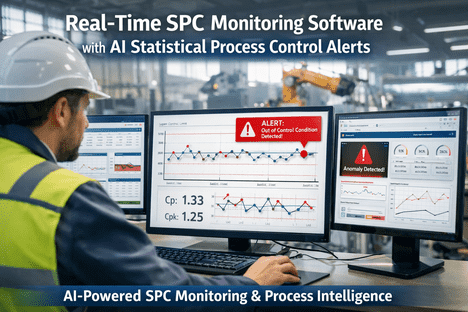
Real-Time SPC Monitoring Software with AI Statistical Process Control Alerts
By Josh Brook on April 21, 2026
SPC has been the backbone of manufacturing quality since Walter Shewhart published the first control chart in 1931. Ninety-five years later, the math has not changed — but almost everything else has. The plants actually using SPC well in 2026 are running it very differently from the plants running it badly. The difference is not the statistics. It is the speed, the integration, and the intelligence layer on top. A process running at Cpk 0.9 generates 2,700 defects per million units — even though 97.3% of units still pass inspection. A process at Cpk 1.33 generates only 64 ppm. At Cpk 1.67, just 0.6 ppm. Knowing exactly where your process sits on that ladder, in real time, for every critical parameter, is what separates a plant scrapping 8% of output from a plant scrapping 0.1%. iFactory's real-time SPC platform pulls data directly from CNC, CMM, vision systems, and PLCs — plots control charts live, runs all eight Western Electric rules automatically, calculates Cp/Cpk/Pp/Ppk continuously, and fires AI-powered alerts the moment a process starts drifting, not after the first out-of-spec unit reaches the customer. Documented outcome: 30–50% scrap reduction and 60%+ quality-driven downtime cut at manufacturers who implement it seriously. This page walks through exactly how that works.
Real-Time SPC Monitoring · AI-Powered Alerts
Real-Time SPC Monitoring Software with AI Statistical Process Control Alerts
Live control charts, automatic Western Electric rules detection, continuous Cp/Cpk tracking, and AI alerts that catch process drift before a single out-of-spec unit reaches your customer.
Faster drift detection with AI than traditional SPC
60%+
Quality-driven downtime reduction
Sources: NIST/SEMATECH Engineering Statistics Handbook · Montgomery's Introduction to Statistical Quality Control · AIAG VDA SPC Manual · iFactory Deployment Data 2026 · Western Electric Handbook (1956)
Why SPC Is Not Optional — The Cpk Ladder
Pass/fail inspection tells you whether a unit meets spec. SPC tells you whether the process producing those units is capable of meeting spec — which is the only metric that scales. A plant running at Cpk 0.9 is a plant generating 2.7% defective product mathematically, regardless of how hard the inspectors work. Move the process from Cpk 1.0 to Cpk 1.67 and you cut defect rates by 4,500x. The numbers below are the exact ppm defect rates at each capability level, directly from the statistical tables — not marketing projections.
Process Capability (Cpk)
Defect Rate · PPM
Production Impact
0.67
Incapable
45,500 ppm
4.55% defective · Process fundamentally unable to meet spec
1.00
Marginal
2,700 ppm
0.27% defective · Any drift produces out-of-spec product
1.33
Capable
64 ppm
Automotive & FMCG minimum standard (IATF 16949)
1.67
Robust
0.6 ppm
Critical-to-quality parameters · Six Sigma benchmark
2.00
World Class
0.002 ppm
Medical devices, aerospace, semiconductor nodes
Live SPC Control Chart — What Your Process Actually Looks Like
Below is a live-style rendering of an X-bar control chart with the three zones (±1σ, ±2σ, ±3σ) that Western Electric rules watch. Every plotted point gets evaluated against all eight rules in real time. The shaded zones are where the rule logic triggers — iFactory highlights points in red the moment a rule fires and fires an alert before the next sample is taken.
The 8 Western Electric Rules — Automated & Instant
Manually monitoring all eight Western Electric rules across dozens of parameters on multiple lines is a mathematical impossibility. iFactory evaluates every rule on every chart, every sample, with zero human latency — and configures alert severity per rule so your team is not drowning in false positives while the real signals slip through.
Rule 1
Point Beyond ±3σ
Any single point above UCL or below LCL. The classic out-of-control signal — process has shifted materially.
Critical
Rule 2
2 of 3 Beyond ±2σ
Two of the last three consecutive points above +2σ or below −2σ on the same side. Drift is confirmed.
Critical
Rule 3
4 of 5 Beyond ±1σ
Four of the last five consecutive points outside the ±1σ band on the same side. Early drift signal.
Warning
Rule 4
8 in a Row on One Side
Eight consecutive points above or below the centerline. Process mean has shifted without OOC.
Warning
Rule 5
6 Points Trending
Six consecutive points steadily increasing or decreasing. Tool wear, temperature drift, or material change.
Warning
Rule 6
14 Alternating
14 consecutive points alternating up and down. Often indicates over-adjustment or sampling error.
Info
Rule 7
15 Within ±1σ
15 consecutive points hugging the centerline inside ±1σ. Process variation has mysteriously shrunk — investigate.
Info
Rule 8
8 Points Beyond ±1σ
Eight consecutive points outside ±1σ on either side. Bimodal process or mixing from multiple sources.
The fastest way to destroy an SPC deployment is to pick the wrong chart type for the wrong data. iFactory auto-detects data structure (continuous vs count, subgrouped vs individual) and recommends the correct chart — but also supports manual override for engineers who know exactly what they want.
Variable Data · Continuous Measurements
X̄-R Chart
Subgroups of 2–10 samples
Dimension, weight, temperature when you take rational subgroups at each time point.
X̄-S Chart
Subgroups > 10
Same use case as X̄-R but with standard deviation instead of range for larger subgroups.
I-MR Chart
Individual measurements
Low-volume or high-cost parts where subgrouping isn't practical. Uses moving range.
EWMA / CUSUM
Small sustained shifts
Exponentially weighted & cumulative sum charts catch small drifts Shewhart charts miss.
Attribute Data · Counts & Pass-Fail
p Chart
Fraction defective, varying sample size
Proportion of non-conforming units when subgroup size varies from sample to sample.
np Chart
Number defective, constant sample
Same use as p-chart but plots absolute count when subgroup size stays fixed.
c Chart
Defects per unit, constant opportunity
Count of defects per item when inspection area stays the same across samples.
u Chart
Defects per unit, varying opportunity
Same as c-chart but normalized for varying inspection area or sample size.
Traditional SPC vs AI-Enhanced SPC
Traditional SPC is essential for regulatory compliance and baseline monitoring — nobody passes an AIAG audit without documented control charts. But traditional SPC is fundamentally reactive: it detects the problem after it shows up in your metrology data. AI-enhanced SPC adds three capabilities Shewhart's math was never designed to provide.
Capability
Traditional SPC
iFactory AI-Enhanced SPC
Drift Detection Speed
Lag from 2 to 48 hours depending on metrology
10–50x faster via virtual metrology prediction
Alert Triggers
8 Western Electric rules on historical points
WE rules + ML anomaly detection + cross-parameter correlation
High — all rules fire same way regardless of context
Severity-ranked with ML prioritization by business impact
Compliance Audit Trail
Manual documentation
Full audit trail with electronic signatures, AIAG VDA ready
The Alert Escalation Ladder
Not every signal needs a line stop. iFactory routes alerts through a four-tier escalation path — so operators see what matters, engineers see what needs investigating, and management only gets pulled in when the process is genuinely trending out of control.
Tier 1
Info
Rules 6, 7, 8 · Minor patterns
Logged for quality engineer review — no operator interruption
Next shift
Tier 2
Warning
Rules 3, 4, 5 · Drift indicators
Dashboard notification to process engineer and shift supervisor
Within hour
Tier 3
Critical
Rules 1, 2 · OOC confirmed
Push notification + SMS + work order created automatically
Within 15 min
Tier 4
Stop Ship
Cpk < 1.0 sustained
Line stop authorized + quarantine hold + quality lead paged
Immediate
The Uncontrolled Process Problem — A Real Example
This case is pulled directly from a UK FMCG deployment. It shows what happens when a process runs for over a year without anyone checking its capability — and what happens when SPC finally goes in.
Before SPC · 14 Months
Process Parameter
Cream deposit weight (±3.5g tolerance)
Cpk
0.82
Standard Deviation
1.4g
Out-of-spec Rate
8.2%
Annual Cost of Uncontrolled Process
£148,000
Invisible in management reports — no one had run a control chart
8 weeks SPC
After SPC · 8 Weeks Later
Root Cause Identified
Depositor nozzle wear on 2 heads
Cpk
1.48
Standard Deviation
0.79g
Out-of-spec Rate
< 0.5%
Annual Savings Captured
£139,000+
Payback period: under 3 months from SPC go-live
Compliance & Standards Built In
Every iFactory SPC deployment ships audit-ready for the standards that matter. Electronic records, signed Cpk studies, documented OOC response actions, and version-controlled control limits — inherited, not configured.
Bath concentration, pH, plating thickness, precious metal usage
Material waste reduction · precious metal savings
What You Get in Year One
30–50%
Scrap rate reduction across critical parameters
60%+
Quality-driven downtime cut
Cpk 1.0 to 1.5+
Typical capability lift on targeted processes
< 3 months
Payback period documented at real deployments
Frequently Asked Questions
What is the difference between traditional SPC and AI-enhanced SPC?
Traditional SPC detects out-of-control conditions after they appear in measurement data — lag ranges from 2 hours for inline metrology to 48 hours for offline. AI-enhanced SPC adds virtual metrology prediction, cross-parameter correlation, and sub-sigma drift detection that catches problems 10–50x faster than Shewhart charts alone. iFactory runs both in parallel — traditional SPC for compliance, AI for speed. Book a demo to see both running on live data.
Does iFactory support all eight Western Electric rules?
Yes — all eight Western Electric rules plus the four Nelson rules are evaluated on every chart, every sample, with configurable severity and alert routing. You can enable or disable individual rules per parameter to reduce alert fatigue on high-variability processes while keeping strict rule enforcement on critical-to-quality parameters.
Which capability indices are calculated and reported?
Cp, Cpk, Pp, Ppk, Cpm, Cpr, Ppr, NCp, NCpk, NCpr, and DPMO — all calculated in real time and trended continuously rather than at scheduled capability studies. Rolling Cpk updates sample-by-sample so you see capability drift live, not after a monthly report.
Can iFactory SPC pull data from our CNC, CMM, and measurement devices automatically?
Yes. iFactory connects to PLCs (OPC-UA, Modbus, EtherNet/IP), CMMs (Q-DAS, DMIS, XML export), vision systems (REST APIs), and direct gauge entry via tablets and keyboards. Historical data imports from Minitab, Excel, Q-DAS, and existing SPC systems are supported during deployment. Ask support about your specific measurement stack.
How do we avoid alert fatigue on our SPC system?
Two mechanisms. First, 4-tier escalation (Info to Warning to Critical to Stop Ship) routes low-severity patterns to quality engineer review queues while reserving operator-visible alerts for genuine OOC signals. Second, AI prioritization ranks alerts by predicted business impact — so a drift on a critical-to-quality parameter surfaces above a pattern on a less consequential one. Together they eliminate the 90%+ false positive noise traditional SPC produces.
Is iFactory SPC audit-ready for IATF 16949 and FDA 21 CFR Part 11?
Yes. Every SPC record includes timestamped measurements, electronic signatures, audit trail of control limit changes, documented OOC response actions, and signed capability studies — meeting IATF 16949 automotive requirements, AIAG VDA SPC manual guidelines, and FDA 21 CFR Part 11 for pharma and medical device applications. Audit preparation time typically drops from weeks to hours after go-live.
Your Process Is Already Telling You Something
Stop Running Shewhart Math on Yesterday's Data. Catch the Drift Before It Costs You.
Book a 30-minute SPC specialist session. We will connect to your sample data, run a live capability study on one critical parameter, configure the Western Electric rules, and show you exactly how fast AI-enhanced SPC catches what your current system misses.