The average manufacturing plant operates at just 60% OEE — meaning 40% of every shift is lost to downtime, slow cycles, and quality defects that nobody sees until the shift report lands on a desk the next morning. Meanwhile, the Industrial IoT market has crossed $276 billion because the plants that do see what's happening — in real time, on every machine, every second — are pulling away from the competition at a pace that spreadsheets and clipboard audits can never match.
Real-Time Industrial Monitoring
See Every Machine, Every Metric, Every Second — Before Problems Become Downtime
Connect IoT sensors across your entire plant floor and transform raw machine data into live OEE dashboards, instant alerts, and AI-driven decisions that recover the 40% of production capacity most manufacturers never knew they were losing.
Book a Free Monitoring Platform Demo
$276B
Global Industrial IoT market in 2025 — growing at 13.3% CAGR
40%
Of production capacity lost in plants running at typical 60% OEE
65%
Of companies now implementing IIoT strategies to cut costs
800 hrs
Average annual equipment downtime per manufacturer
Sources: Research Nester · Lean Production · SNS Insider · Aberdeen Research
The Visibility Gap: What You Can't See Is Costing You Millions
Most manufacturing plants today are running partially blind. Operators know a machine is down only when they walk past it. Supervisors learn about a quality drift at the end-of-shift report. Maintenance teams discover a bearing is failing when the line stops. This gap between what is happening on the floor and when leadership finds out about it is the single largest source of preventable production loss in modern manufacturing.
Without Real-Time Monitoring
Hour 0
Bearing vibration exceeds safe threshold
Hour 3
Operator notices unusual noise but continues production
Hour 6
Bearing fails — line stops, emergency repair called
Hour 10
Parts arrive, repair begins — $260K/hr lost
Total cost: 4+ hours downtime, emergency parts premium, overtime recovery
VS
With Real-Time IoT Monitoring
Second 0
Sensor detects vibration anomaly — alert triggered instantly
Minute 2
AI classifies degradation pattern — work order auto-generated
Next PM Window
Bearing replaced during planned downtime — zero production loss
Total cost: One planned replacement at standard parts pricing
The data is unambiguous: plants running real-time monitoring systems consistently achieve 85%+ OEE (world-class benchmark), while plants relying on manual tracking average 60% or less. That 25-point gap translates directly into recovered production capacity — without buying a single new machine.
How much production capacity is hiding in your visibility gap? Book a free assessment and see your real-time OEE potential.
The IoT Monitoring Stack: From Sensor to Decision in Milliseconds
Real-time industrial monitoring is not a single product — it's an integrated technology stack where each layer feeds the next. Data flows from physical sensors on your machines through edge computing gateways, into cloud analytics engines, and finally onto the dashboards and mobile alerts that drive immediate action. Here's what each layer does and why skipping any one of them creates a blind spot.
Layer 1
Smart Sensors & Edge Devices
Vibration, temperature, pressure, current, acoustic, and humidity sensors attached directly to motors, pumps, compressors, conveyors, and HVAC units. Edge gateways process up to thousands of data points per second locally — filtering noise, detecting threshold breaches, and forwarding meaningful signals upstream.
Vibration, Temperature, Pressure, Current, Acoustics
Layer 2
Connectivity & Data Transport
Industrial protocols (OPC UA, MQTT, Modbus) transport sensor data to cloud or on-premise analytics platforms. 5G and LPWAN networks enable low-latency, high-bandwidth connections — even in remote or RF-hostile environments like steel mills and underground mining operations.
OPC UA, MQTT, 5G, LPWAN, Modbus
Layer 3
AI Analytics & Pattern Engine
Machine learning models trained on operational baselines detect anomalies, classify degradation patterns, and generate failure probability scores. The AI doesn't just tell you something is wrong — it tells you what will fail, when, and what action to take.
ML Models, Anomaly Detection, Failure Prediction
Layer 4
Dashboards, Alerts & Automated Actions
Live OEE dashboards visible from the shop floor to the boardroom. Instant mobile alerts for threshold breaches. Auto-generated work orders routed to the right technician. Executive AI briefings that summarize plant performance in natural language — no data scientist required.
Live OEE, Mobile Alerts, Auto Work Orders, AI Reports
What Real-Time Monitoring Actually Measures
The power of IoT monitoring lies in what it tracks and how fast it reports it. Every metric below updates continuously — not at the end of a shift, not in a weekly report, but every second. That speed is the difference between catching a problem before it costs you money and reading about it after the damage is done.
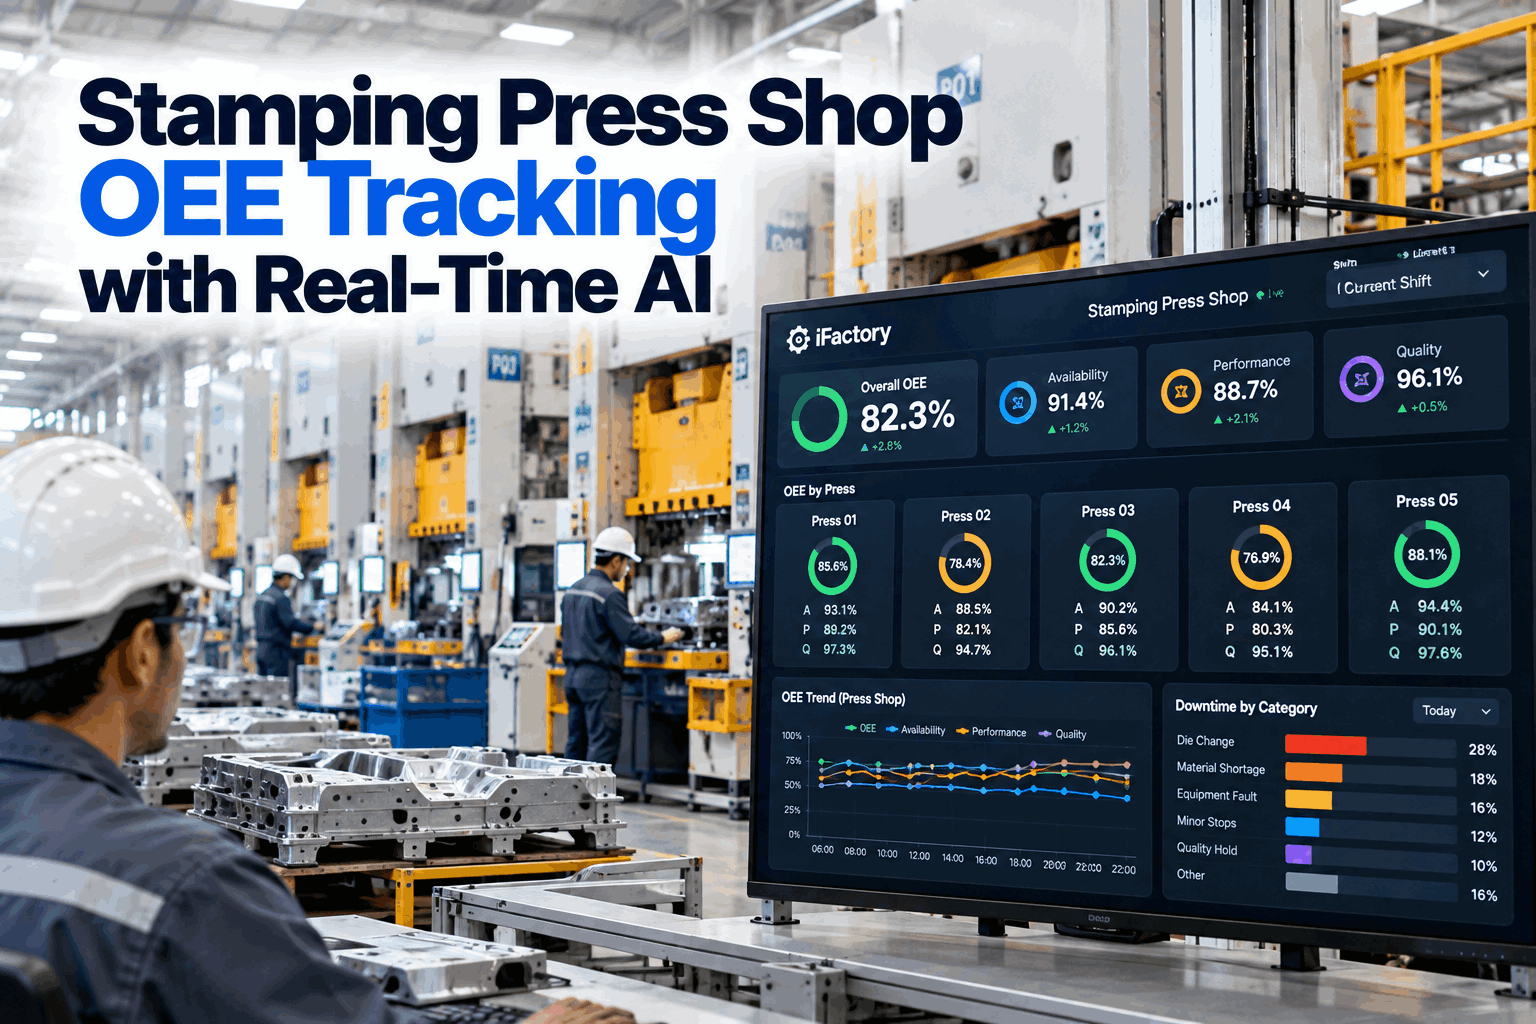
Combined OEE: 77.7% — targeting 85% world-class
Machine Uptime & Downtime
Exact start and stop times for every asset. Downtime reason codes captured automatically — no operator input required.
Cycle Time Analysis
Actual vs. ideal cycle times per machine, per product, per shift. Identify slow cycles and micro-stops invisible to manual tracking.
Vibration & Temperature
Continuous monitoring of bearing health, motor temperature, and mechanical stress. Threshold alerts trigger before degradation becomes failure.
Energy Consumption
Real-time WAGES (Water, Air, Gas, Electricity, Steam) tracking per machine, per line, per shift. Anomaly detection flags consumption spikes instantly.
Quality & Defect Rates
First-pass yield, scrap rates, and SPC trend data updated live. AI root-cause analysis identifies defect sources as they emerge.
Production Output
Units produced vs. target, throughput velocity, and batch completion tracking. Real-time visibility into whether you'll hit the shift target or fall short.
Want to see all these metrics updating live on a single dashboard for your plant? Schedule a real-time monitoring demo.
The Business Impact: Numbers That Move the Boardroom
Real-time IoT monitoring is not a technology project — it's a profitability project. The numbers below come from documented industrial deployments, not theoretical models. Every metric represents actual production capacity recovered, costs eliminated, and revenue protected.
25%
Average OEE Improvement
Plants moving from 60% to 85% OEE recover one-quarter of their total production capacity — the equivalent of adding a new production line without capital expenditure.
70%
Fewer Unplanned Breakdowns
Continuous condition monitoring with AI prediction catches degradation weeks before failure, eliminating the emergency repair cycle.
30%
Lower Maintenance Costs
Fix only what needs fixing, when it needs fixing. No more replacing healthy parts on a calendar schedule.
15%
Energy Cost Reduction
Real-time energy monitoring detects consumption anomalies and idle-state waste that manual audits miss entirely.
$1.4T
Lost to downtime annually by the world's 500 largest companies
2.1M hrs
Of downtime saveable with full predictive monitoring adoption
$233B
In maintenance cost savings estimated for Fortune 500 companies
Industry Applications: One Platform Across Your Entire Operation
Real-time monitoring isn't confined to one machine type or one industry. Any physical asset that moves, heats, pressurizes, rotates, or consumes energy can be instrumented with IoT sensors and connected to an analytics platform. Here's how different sectors use the same core technology to solve industry-specific challenges.
Discrete Manufacturing
CNC machines, stamping presses, robotic cells, assembly lines
Spindle load, servo current, cycle times, part counts, reject rates
Recover 15-25% hidden capacity by eliminating micro-stops and slow cycles invisible to manual tracking.
Process Manufacturing
Reactors, mixers, heat exchangers, distillation columns
Temperature profiles, pressure curves, flow rates, batch consistency
Maintain batch-to-batch consistency and prevent off-spec production that wastes raw materials.
Energy & Utilities
Turbines, generators, transformers, grid infrastructure
Winding temperatures, oil quality, load profiles, harmonic distortion
Prevent grid-level outages where a single transformer failure cascades across thousands of customers.
Steel & Metals
Blast furnaces, rolling mills, continuous casters, cranes
Furnace lining wear, roll force, cooling water flow, crane hoist stress
Avoid catastrophic furnace shutdowns costing $1M+ per day with continuous thermal and structural monitoring.
Food & Beverage
Conveyors, packaging lines, refrigeration, CIP systems
Belt speed, seal integrity, cold chain temperature, sanitation cycle completeness
Maintain food safety compliance while maximizing throughput between CIP cleaning cycles.
Pharmaceuticals
Clean rooms, HVAC, autoclaves, filling lines
Particle counts, differential pressure, humidity, sterilization parameters
Ensure GMP compliance with continuous environmental monitoring — avoid batch losses from undetected excursions.
Operating in any of these industries? See how iFactory configures real-time monitoring for your specific equipment.
Why iFactory for Real-Time Industrial Monitoring?
Most IIoT platforms give you data. iFactory gives you decisions. The difference is the gap between a dashboard full of numbers and a system that tells your maintenance team exactly what to do, when to do it, and why — automatically. iFactory's six integrated modules turn raw sensor streams into coordinated plant intelligence without middleware, without data silos, and without requiring a data science team to interpret the results.
Your Machines Are Talking. Are You Listening?
iFactory connects every sensor, every machine, and every production line into a single AI platform that turns raw data into real-time decisions. Stop reading about yesterday's problems. Start preventing tomorrow's. Join the 65% of industrial companies already implementing IIoT strategies to transform their operations.
Frequently Asked Questions
What is real-time industrial monitoring?
Real-time industrial monitoring uses IoT sensors, edge computing, and cloud analytics to continuously track machine performance, environmental conditions, and production metrics — delivering live data to dashboards and mobile alerts as events happen, not hours or shifts later. It replaces manual data collection, clipboard audits, and end-of-shift spreadsheets with automated, second-by-second visibility into every asset on your plant floor.
What is the difference between real-time monitoring and SCADA?
Traditional SCADA systems focus on process control — monitoring and controlling specific process variables like temperature, pressure, and flow. Modern real-time IoT monitoring platforms go further by adding AI-powered analytics, predictive maintenance, OEE tracking, energy management, and quality intelligence on top of raw sensor data. While SCADA tells you what is happening right now, AI-powered monitoring tells you what will happen next and what to do about it.
How many sensors does a typical manufacturing plant need?
Sensor density depends on asset criticality and monitoring objectives. A typical mid-sized plant with 50-100 machines might deploy 200-500 sensors covering vibration, temperature, current, and pressure on critical assets. Most implementations start with a pilot on 3-5 high-value or high-failure-rate machines, then scale across the plant based on demonstrated ROI. Modern wireless sensors and LPWAN connectivity make retrofitting existing equipment straightforward without rewiring the plant.
How quickly can real-time monitoring show ROI?
Most plants see measurable improvements within the first 30-90 days of deployment. The first prevented breakdown typically pays for the pilot system. Documented results include 25% OEE improvement (recovering hidden capacity), 70% fewer unplanned breakdowns, and 30% lower maintenance costs. Full-scale deployments typically achieve payback within 6-14 months, with ongoing savings compounding as AI models improve their prediction accuracy over time.
Can iFactory integrate with our existing SCADA, MES, or ERP systems?
Yes. iFactory connects to existing industrial systems through standard protocols including OPC UA, MQTT, and Modbus for SCADA/PLC integration, and supports direct API connections to SAP, Oracle, and other ERP platforms. Auto-generated work orders flow directly into your CMMS or ERP procurement workflows. The platform is designed to layer on top of your existing infrastructure — not replace it — so you get AI-powered intelligence without ripping out systems that work.