Here is a number that should change how every quality manager thinks about capability reports. A process running at Cpk 1.67 ships about 0.6 defective parts per million. Let that same process drift just enough to fall to Cpk 1.0 — a shift small enough that nothing looks obviously wrong on the floor — and it now ships 2,700 defective parts per million. That is a 4,500-fold jump in escapes. And if your Cpk is calculated once a week, you will not find out until the next report runs, by which point everything made during the drift has already shipped. A weekly Cpk tells you what left the building. A live Cpk tells you what is leaving right now. An iFactory capability layer is what closes that gap to seconds.
iFactory · Process Capability Monitoring
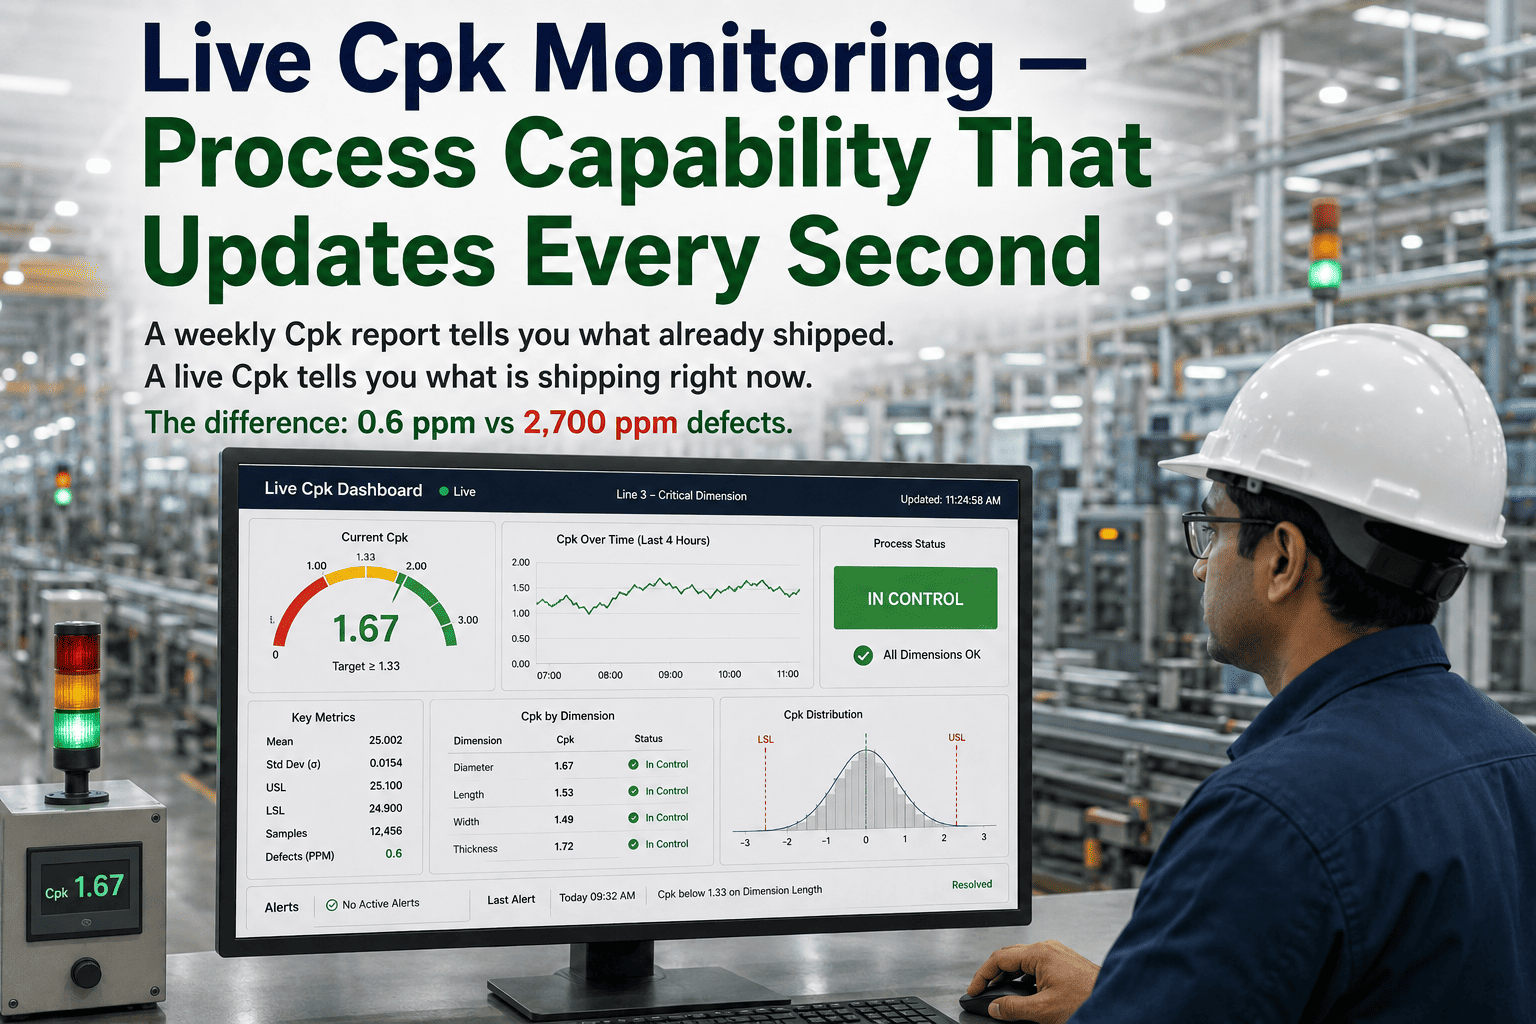
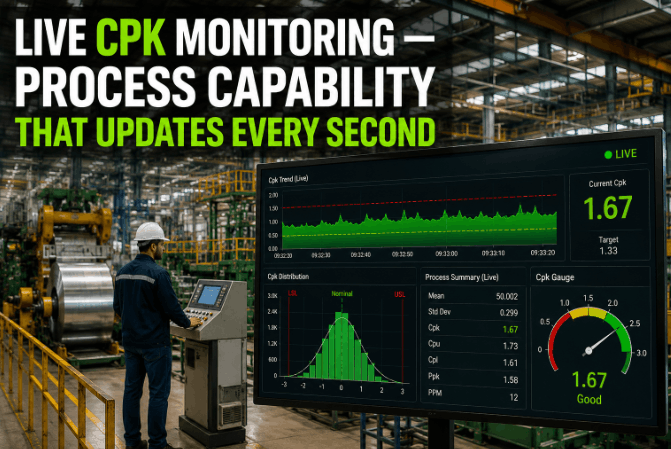
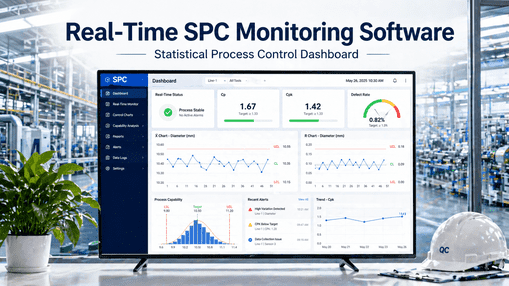
Live Cpk: Process Capability That Updates Every Second, Not Every Week
A periodic Cpk report describes parts that already shipped. A live Cpk watches capability in real time and alerts you the moment a process drifts toward the defect cliff — while you can still stop it.
0.6
ppm defects at Cpk 1.67
2,700
ppm defects at Cpk 1.0
1.33
the minimum "capable" threshold
Seconds
not weeks, between reading and reality
The Defect Cliff: Why Small Cpk Changes Are Huge
Cpk and defect rate are not linearly related — they fall off a cliff. A modest drop in capability does not nudge your defect rate up a little; it multiplies it. This is the single most important thing to understand about why capability needs watching in real time. The table below shows the relationship for a centered, normal process. Look at how violently the ppm column moves for small moves in Cpk.
2.00
~0.002 ppm
World-class
1.67
~0.6 ppm
Critical-ready
1.33
~64 ppm
Capable (min)
What Cpk Is Really Telling You
Before the live part, the fundamentals. Cpk captures two things at once: how centered your process is between the spec limits, and how tight its spread is. A high Cpk means the process is both well-aimed and consistent — comfortably inside the limits with room to spare. The catch is that the famous ppm values assume the process stays centered. Real processes do not. A tool wears, a temperature drifts, a material lot changes — and the mean walks toward a spec limit while the Cpk number quietly falls. That walking is exactly what happens between two weekly reports, invisible until the next one runs.
Centering
How far the process mean sits from the nearest spec limit. Drift the mean toward a limit and Cpk drops even if the spread never changes.
Spread
How much the process varies, measured as three standard deviations. Widen the variation and Cpk drops even if the process stays perfectly centered.
The hidden assumption
The clean ppm numbers assume the process stays put. It never does — which is why a single weekly snapshot is a guess about the other six days.
The Real Problem Is the Time Gap
The weakness of periodic capability is not the math — it is the latency. Between when a part is made and when its Cpk is calculated, an entire shift's worth of product can ship. Walk the timeline of a drift in a plant that reports weekly, and the cost of the gap becomes obvious.
Weekly Cpk report
finds the drift after it ships
Monday
Last report ran. Cpk was a healthy 1.67. Everyone moves on.
Wednesday
A tool starts to wear. The mean walks toward the upper limit. Nobody is looking.
Thu-Fri
Cpk is now near 1.0 - 2,700 ppm shipping. Still invisible.
Next Mon
Report finally runs and shows the drop. Five days of product already gone.
The report is correct - and five days too late.
Live Cpk monitoring
catches the drift as it starts
Monday
Cpk streams live at 1.67. Baseline visible on the dashboard.
Wednesday
The mean starts walking. Live Cpk ticks down. An alert fires at the threshold.
Minutes later
Operator changes the tool before Cpk ever reaches 1.33. Drift stopped.
Ongoing
Capability holds above target. Near-zero escapes the whole week.
The drift never reached the customer.
Want to see live Cpk streaming from one of your own critical characteristics? Talk to a capability specialist and we will set it up on your data.
What Live Cpk Monitoring Actually Does
It is more than a faster report. Continuous capability turns a backward-looking number into a forward-looking control. Here is what changes when Cpk updates every second instead of every week.
Cpk calculated weekly from a sample
becomes
Cpk recalculated continuously from live data
Drift discovered at the next report
becomes
Drift alerted the moment it crosses a threshold
Capability known for the line as a whole
becomes
Capability tracked per characteristic and machine
Bad product found at final inspection
becomes
Process corrected before bad product is made
Capability evidence assembled for audits
becomes
Audit-ready capability history, always current
Want every critical characteristic on a live capability dashboard with threshold alerts? Book a demo and we will scope it to your process.
Frequently Asked Questions
Why does a small Cpk drop cause such a big defect jump?
Because the relationship is exponential, not linear — it follows the tail of the normal distribution. At Cpk 1.67 only about 0.6 parts per million fall outside spec; at Cpk 1.33 it is around 64 ppm; at Cpk 1.0 it is roughly 2,700 ppm. Each small loss of capability moves you further down a steeply curving tail, so the escapes multiply rather than add.
What Cpk should we be targeting?
The common thresholds are 1.33 as the minimum for a capable process, 1.67 for critical or safety-relevant characteristics, and 2.0 as world-class. Automotive and aerospace standards frequently mandate 1.33 for key characteristics and 1.67 for safety-critical ones. The point of live monitoring is to keep you safely above your target, not just to confirm after the fact that you were.
Isn't a weekly Cpk report good enough?
It is accurate, but it describes the past. A process can drift from 1.67 to 1.0 between two reports as a tool wears or a material lot changes, and a weekly cadence means everything made during that drift ships before anyone sees the number fall. The report tells you what happened; live monitoring lets you act while it is still happening.
How is this different from an SPC control chart?
They are complementary. SPC tells you whether the process is stable — in statistical control. Cpk tells you whether a stable process is actually capable of meeting the spec, and by how much margin. Live Cpk runs the capability calculation continuously on top of your data stream, so you see both stability and capability move in real time rather than at sampling intervals.
Do we need new sensors to monitor Cpk live?
Usually not. If you already capture measurements — from gauges, CMMs, in-line sensors, or test stands — those values are what live Cpk runs on. The work is in streaming that data continuously, recalculating capability per characteristic, and setting threshold alerts. A capability layer over your existing measurement data is typically where plants begin.
Stop finding out about the drift after it shipped.
See Cpk Stream Live From Your Critical Characteristics
Bring one critical characteristic. We will stream its measurements into a live capability calculation, show Cpk updating in real time, and fire an alert the moment it drifts toward your threshold — so the process gets corrected before a single bad part reaches the customer. Turnkey: a capability layer over your existing measurement data, per characteristic and machine, audit-ready. Live in weeks, not quarters.
Live
Cpk per characteristic
Threshold
alerts before the cliff
0.6 ppm
the target, held continuously
Weeks
to live on your data