Live Cpk Monitoring — Process Capability That Updates Every Second

By Henry Green on June 4, 2026

live-cpk-monitoring-—-process-capability-that-updates-every-second

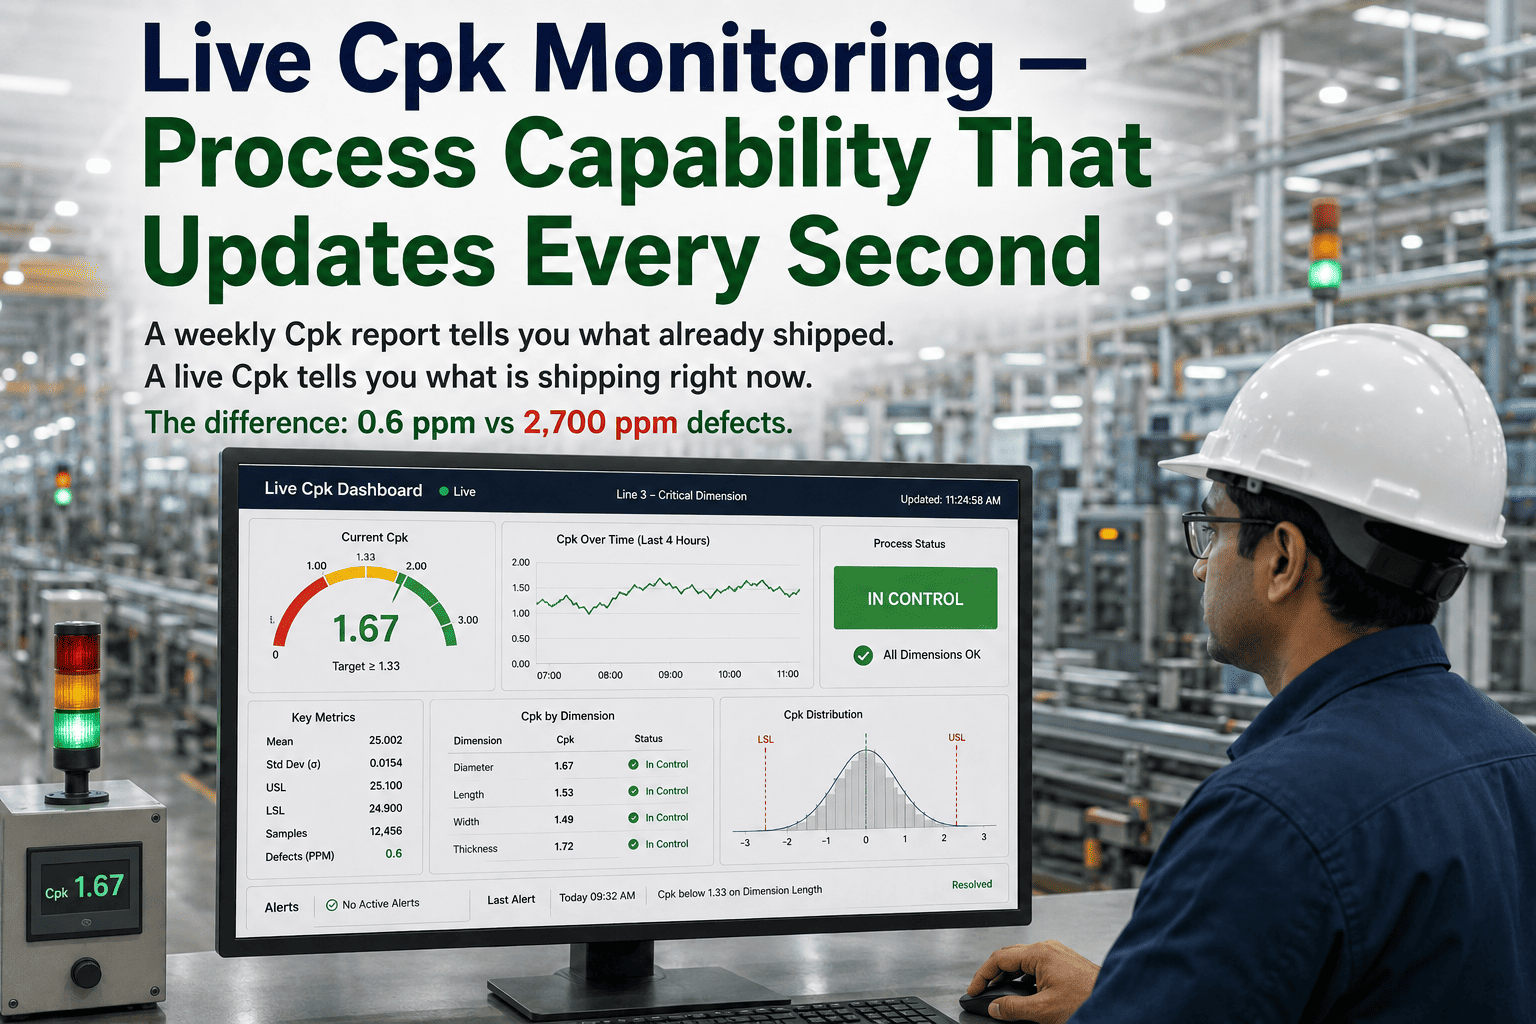
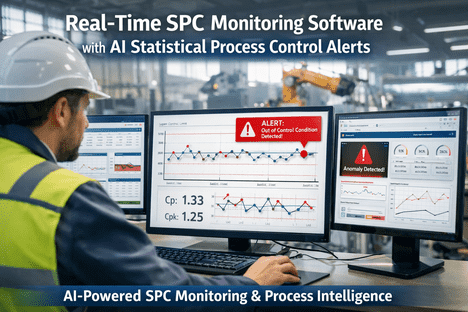
A weekly Cpk report tells you what already shipped. A live Cpk tells you what is shipping right now. That distinction is not semantic — it is the difference between catching a process drift during the shift it starts and discovering it during the next quality review meeting after 4,000 parts have already left the dock. For Six Sigma Black Belts managing critical parameters across high-volume lines, the Cpk value in last week's spreadsheet is a historical document. iFactory's continuous Cpk monitoring engine calculates process capability per parameter, every second, updating with each new measurement — and automatically escalates when Cpk drops below 1.33, with a second-tier alert when it approaches 1.0. The goal is simple: no quality engineer should ever learn about a capability problem from a customer.

iFactory Manufacturing Intelligence · Six Sigma Black Belt
Live Cpk Monitoring — Process Capability That Updates Every Second
Continuous Cpk per critical parameter. Automated alert at Cpk < 1.33. Escalation at Cpk < 1.0. No weekly pull, no manual study, no delayed discovery.
2,700 PPM
Defect rate at Cpk = 1.0 — what ships while you wait for the weekly report
63 PPM
Defect rate at Cpk = 1.33 — the IATF 16949 minimum acceptable threshold
<1 PPM
Defect rate at Cpk = 1.67 — OEM preferred supplier target in automotive
See Your Live Cpk Dashboard in Action
iFactory's quality team will configure a live demonstration against your actual parameter set — showing continuous Cpk, threshold alerts, and escalation logic for your specific process.

The Cost of Delayed Cpk — What Happens Between Reviews

The gap between when a process capability starts degrading and when a quality team discovers it is where most preventable escapes originate. A Cpk that begins dropping at the start of a shift will not appear in a weekly report until days later — by which point the process has produced at a degraded capability level across an entire production window. The defect-rate math is straightforward and unforgiving.

Cpk Value Sigma Level Defect Rate (PPM) Industry Interpretation iFactory Response
≥ 2.00 3.4 PPM World-class / Six Sigma quality Monitor — no action
≥ 1.67 < 1 PPM OEM preferred supplier target (automotive, aerospace) Monitor — no action
1.33 – 1.67 4–5σ 1 – 63 PPM IATF 16949 minimum / industry capable Watch — capability trending
1.00 – 1.33 3–4σ 63 – 2,700 PPM Marginal — approaching risk of escape Alert — engineer notified instantly
< 1.00 < 3σ > 2,700 PPM Not capable — active nonconformance risk Escalation — supervisor + CAPA triggered

The Cpk thresholds above are not abstract. They translate directly to how many defective parts your process produces every hour. Want to see these thresholds applied live to your critical parameters? Book a Demo and we will walk through a live configuration.

How iFactory Continuous Cpk Monitoring Works

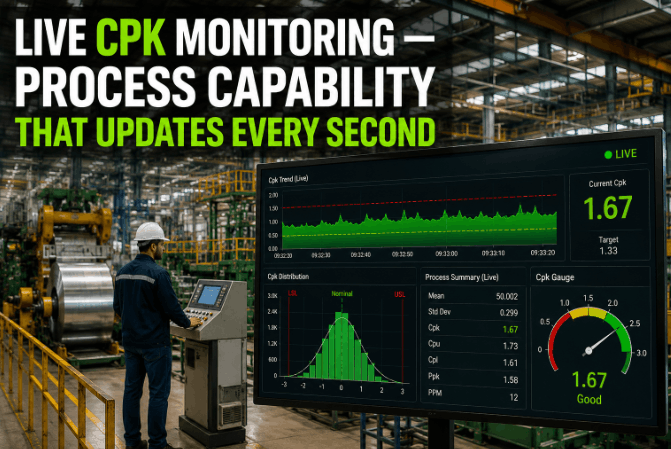
iFactory does not recalculate Cpk on a schedule. It recalculates with every measurement that arrives from your gauges, CMMs, vision systems, or manual entry — maintaining a rolling capability window that reflects the process as it exists right now, not as it existed when someone last ran a study.

01
Measurement Ingestion — Any Source, Any Rate
Measurement data streams in from inline gauges, CMMs, vision systems, PLCs, and manual operator entry via OPC-UA, MQTT, REST APIs, or direct MES integration. Every data point is timestamped and attributed to its parameter, line, and production order automatically.
02
Rolling Capability Window Maintained Per Parameter
Each parameter maintains a configurable rolling window (typically the last 25–100 measurements, per AIAG SPC guidelines) that recalculates mean, standard deviation, and all four capability indices — Cp, Cpk, Pp, Ppk — with each new point. Short-term and long-term standard deviation tracked in parallel.
03
Threshold Evaluation — Two-Tier Alert Logic
After each recalculation, Cpk is compared against both configured thresholds: the warning threshold (default 1.33 — industry minimum) and the escalation threshold (default 1.0 — active nonconformance risk). Each threshold triggers a different notification chain and response protocol.
04
Role-Based Notification and Escalation
Warning-level alerts route to the assigned quality engineer with parameter detail, current Cpk value, trend direction, and the last 25 measurement points. Escalation-level alerts add the production supervisor and automatically open a CAPA record — timestamped, linked to the affected production order, and audit-ready.
05
Live Dashboard — Every Parameter, Every Line
The Cpk dashboard surfaces the current capability index for every monitored parameter across all lines — color-coded by threshold status, sortable by Cpk value, and filterable by product family, production order, or shift. No report generation, no export required.
06
Audit Trail and PPAP-Ready Export
Every Cpk reading, threshold crossing, notification, and response is automatically recorded in a tamper-proof audit trail. PPAP capability study reports can be generated on demand from the same live data — eliminating the need to run separate capability studies for customer submissions.

What a Six Sigma Black Belt Sees on the Live Cpk Dashboard

The iFactory Cpk dashboard is designed for the way Black Belts actually work — not as a status board, but as a decision surface. Every element surfaces the question: which parameter needs my attention right now, and what is driving its current capability level. Book a Demo to walk through the full dashboard with one of our quality engineers.

Six Sigma Black Belt
Live view: Current Cpk per parameter across all monitored lines, sorted by risk level. Trend direction indicator (improving / stable / degrading). Gap between Cp and Cpk — surfaces centering problems vs. spread problems instantly.
Acts on: Parameters with Cpk dropping toward 1.33 before the threshold is breached. Identifies whether the problem is variation inflation or mean shift — and initiates the right corrective action.
Quality Manager
Live view: Line-level capability summary — how many parameters are currently below 1.67, below 1.33, or below 1.0. CAPA count and aging for open capability-related corrective actions. Customer-specific Cpk commitments vs. current performance.
Acts on: Escalation events requiring containment decisions. Cpk trend reports for customer review meetings — pulled directly from live data, no manual assembly.
Production Supervisor
Live view: Current Cpk status per line — green / yellow / red by threshold. Escalation-level alerts with recommended containment action. Parameters that crossed 1.0 threshold on the current shift.
Acts on: Immediate containment — hold suspect production, call quality engineer, implement reaction plan per control plan. All actions timestamped automatically in iFactory.
Plant Manager / VP Quality
Live view: Facility-level capability health score. Parameters below minimum threshold expressed as percentage of total monitored parameters. Week-over-week Cpk improvement or degradation trend by product family.
Acts on: Strategic resource allocation for capability improvement projects. Customer escalation responses with current Cpk data attached. Cross-site capability benchmarking.

Live Cpk vs. Periodic Capability Studies — A Direct Comparison

Most quality organizations run capability studies at PPAP, during initial production runs, and then periodically — often quarterly or when a process change occurs. Live Cpk monitoring does not replace these formal studies; it fills the gap between them with continuous visibility. Here is what each approach provides and where each falls short without the other.

Capability Periodic Capability Study iFactory Live Cpk Monitoring
Update frequency Weekly, monthly, or per change event Every measurement — continuous
Cpk threshold alert No — discovered at next review Automatic at <1.33 and <1.0
Mean shift detection Visible only after study recalculation Visible in Cp vs. Cpk gap, updated live
Analyst time per cycle 2–4 hrs per study (data pull, Minitab, report) Zero — calculation is automated
PPAP report generation Manual study required, separate from production data On-demand from live production data
CAPA initiation Manual, after review session identifies the problem Auto-triggered on escalation-threshold crossing
Audit trail Manual documentation per study Automatic — every Cpk value timestamped
Escape risk window Entire production run between studies Minutes — alert fires as Cpk degrades

Expert Perspective: What Black Belts Get Wrong About Cpk Monitoring

The most common Black Belt mistake I see in Cpk programs is treating capability as a study result rather than a process state. When Cpk is a number you calculate, you defend it at audits. When Cpk is a signal you monitor continuously, you act on it during production. Those are not the same quality posture — and the PPM difference between them is measurable. A Cpk that drops from 1.45 to 1.05 between weekly reviews has produced roughly 1,800 additional defective parts per million over that window. That is not a statistical abstraction — it is a warranty claim waiting to happen.

Six Sigma Master Black Belt
iFactory Advisory Board — Discrete Manufacturing Quality Systems, Tier-1 Automotive
Four Black Belt blind spots that live Cpk monitoring closes:

Treating the Cp–Cpk gap as an audit footnote rather than a live centering alarm — a widening gap is a mean shift signal, not a rounding issue

Running PPAP capability studies on controlled conditions then monitoring production with weekly pulls — the two datasets are measuring different process states

Configuring a single Cpk threshold (1.33) and treating it as binary pass/fail — degrading capability from 1.45 to 1.08 represents a 40x increase in defect rate before any alarm fires

Not connecting Cpk degradation to its CAPA system — a Cpk alert that requires manual CAPA initiation will be responded to hours later; an automated trigger responds in seconds

Conclusion: Cpk as a Live Operating Signal, Not a Retrospective Metric

Process capability indices were designed to answer one question: can this process reliably produce within specification? That question is only meaningful in the present tense. A Cpk from last Tuesday's study answers a different question — one about a process state that may no longer exist. For Six Sigma Black Belts who are accountable for the quality of what is shipping right now, continuous Cpk monitoring is not a feature upgrade. It is the difference between a quality system that controls a process and one that documents it.

iFactory's live Cpk engine calculates process capability per critical parameter, every second, with automatic two-tier alerts at Cpk < 1.33 and Cpk < 1.0 — plus automated CAPA initiation, a complete audit trail, and on-demand PPAP-ready capability reports. If your team still discovers Cpk problems from weekly reports, Book a Demo to see what real-time capability visibility looks like on your actual parameter set.

Frequently Asked Questions

iFactory uses a configurable rolling window — defaulting to the last 25–100 measurements per AIAG SPC guidance — with each new point triggering a full recalculation of Cpk, Cp, Pp, and Ppk simultaneously.
Yes — each critical parameter can have its own warning threshold (default 1.33) and escalation threshold (default 1.0), with independent notification routing per threshold level.
No — PPAP studies remain a separate, controlled-condition baseline. Live Cpk monitoring fills the gap between studies and can generate on-demand PPAP-format capability reports from production data.
iFactory ingests measurement data from CMMs, inline gauges, vision systems, PLCs, and manual entry via OPC-UA, MQTT, REST APIs, and direct MES connectors — including legacy equipment through protocol converters.
Both Cp and Cpk are calculated and displayed live per parameter — a widening gap surfaces as a live centering alert, directing the engineer toward adjustment rather than variation reduction as the correct corrective action.
Continuous Cpk · Two-Tier Alerts · PPAP-Ready · IATF 16949
Your Process Capability Is Changing Right Now. Are You Watching?
iFactory calculates Cpk per critical parameter, every second — alerting at <1.33, escalating at <1.0, auto-initiating CAPA, and maintaining a complete audit trail. Stop learning about capability problems from reports. Start catching them during the shift.
Live Cpk Per Parameter Alert at Cpk < 1.33 Escalation at Cpk < 1.0 Auto CAPA Trigger PPAP-Ready Reports

Share This Story, Choose Your Platform!