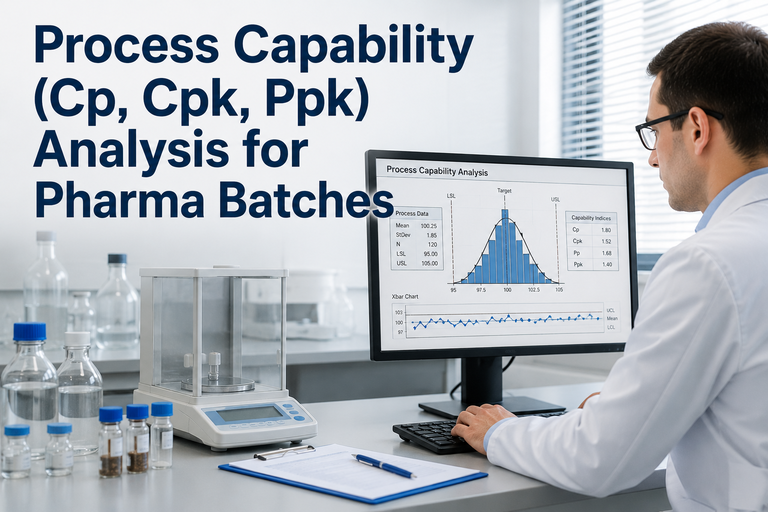
A pharma QA director in Hyderabad described the moment her CPV review went sideways. Three batches of an immediate-release tablet had all passed assay, all passed content uniformity, all passed dissolution. Every individual result sat comfortably within 95.0–105.0% of label claim. Then the auditor ran the numbers. Cpk on assay came back at 1.08. Ppk came back at 0.82. The conversation changed in the next ten minutes — not because any batch had failed, but because the process was riding the edge of its specification window, and the gap between Cpk and Ppk said the process drifted between batches more than the within-batch variation alone would suggest. The point of capability analysis is not to argue with individual results that already cleared spec. It is to forecast whether the next 100 batches will, with the same process, same materials, same operators, same equipment. A Cpk of 1.33 means the process has roughly 4 standard deviations of room on the narrower side of the spec. A Cpk of 1.0 means the cushion is gone. Auditors notice the difference. So do patients, eventually. Book a capability audit and we will run Cp, Cpk, and Ppk on your last 30 batches against your CQAs.
iFactory Pharma Process Intelligence
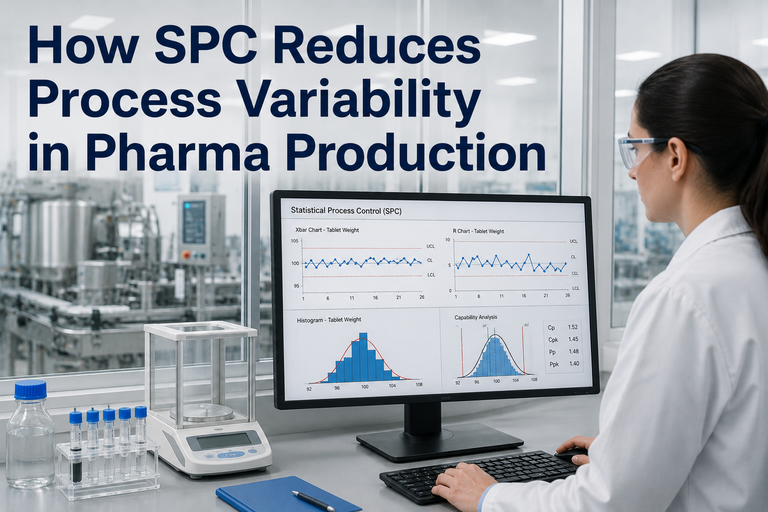
Process Capability (Cp, Cpk, Ppk) for Pharmaceutical Batches — Calculate It Right, Read It Right, Improve It Right
A practical guide for pharma QA, validation, and manufacturing teams. The formulas, the thresholds, the FDA expectations, the failure modes — and what to do when Cpk and Ppk disagree.
≥ 1.33
Industry target Cpk for robust pharma processes
30%
GMP deviations tied to weak statistical evaluation
3-stage
FDA Process Validation lifecycle, capability throughout
21 CFR 211
Regulatory anchor for capability evidence
The Capability Vocabulary — Cp, Cpk, Pp, Ppk in One Page
The four indices look similar and are constantly confused, even in mature pharma operations. The distinction is small in symbol and large in meaning. Read this once and the rest of the page makes sense.
Cp
Process Capability — Potential
Cp = (USL − LSL) / 6σwithin
How much spec room exists vs short-term variation, assuming the process is perfectly centered. Cp does not penalize being off-center. Useful, but never the full story.
Cpk
Process Capability — Actual (within)
Cpk = min[(USL − μ)/3σwithin, (μ − LSL)/3σwithin]
The narrower of two ratios, accounting for where the mean actually sits. Uses within-subgroup variation, so it reflects short-term process potential. The number QA cites most often.
Pp
Process Performance — Potential
Pp = (USL − LSL) / 6σoverall
Same as Cp, but uses the overall (long-term) standard deviation including between-batch variation. Honest mirror of Cp under real production conditions.
Ppk
Process Performance — Actual (overall)
Ppk = min[(USL − μ)/3σoverall, (μ − LSL)/3σoverall]
Reality check. Uses overall σ. Cpk minus Ppk tells you how much of your variation is between batches vs within batches. The auditor's favorite comparison.
The Threshold Ladder — What Each Cpk Value Actually Means
Pharma processes do not need world-class Cpk on every characteristic. They need Cpk that matches the patient risk of the attribute. A non-critical excipient assay at Cpk 1.0 may be acceptable. A potency assay on a narrow-therapeutic-index API at the same Cpk would be a serious finding. The ladder below is the practical reading every QA director uses.
< 1.00
Incapable
Process produces non-conforming product at statistically meaningful rate. Out-of-spec is a question of when, not if. Triggers immediate CAPA, scope expansion, and source variation investigation.
Below 3σ
1.00–1.33
Marginal
Process can hit spec but rides the edge. No margin for upstream variation, raw material lot shift, or equipment wear. Acceptable as Stage 2 PPQ entry only with strong control strategy and elevated monitoring.
3–4σ
1.33–1.67
Industry Target
Cpk of 1.33 is the de facto industry target for routine pharma manufacturing. Process has comfortable margin for normal variation sources. Sustainable for ongoing CPV with standard monitoring frequency.
4–5σ
1.67–2.00
Robust
Process has substantial spec margin. Cpk ≥ 1.67 is appropriate for critical-to-quality attributes (potency, sterile fill, narrow-therapeutic-index APIs). Reduced sampling and skip-lot strategies become defensible.
5–6σ
≥ 2.00
World-Class
Six Sigma capability. Process is so tightly centered and so low in variation that defect rate is statistically negligible. Appropriate target for highest-risk attributes; rare in legacy pharma manufacturing without process redesign.
Six Sigma
Cpk vs Ppk — The Gap That Auditors Read First
When an auditor pulls a capability report, the first thing they look at is not the absolute value of Cpk. It is the gap between Cpk and Ppk on the same data set. If both numbers are similar, the process is stable and the variation you see within batches looks a lot like the variation you see across batches. If Ppk is meaningfully lower than Cpk, something is happening between batches that the within-batch math is hiding. That is where the questions start.
Healthy Pattern
Cpk ≈ Ppk
Within-batch and overall variation are similar. The process is in a state of statistical control. Between-batch noise is not adding meaningful variation.
Interpretation: The capability number is trustworthy. Routine CPV monitoring is sufficient.
Divergence Pattern
Cpk >> Ppk
Each batch looks capable in isolation, but the batches do not agree with each other. Between-batch drift inflates overall σ. Cpk overstates the true performance.
Investigate: Raw material lots, equipment differences, operator shifts, environmental conditions, analytical method drift.
The Five Pharma CQAs Where Capability Analysis Lives
Not every measurement deserves a Cpk study. Capability analysis is meaningful when the attribute is continuous, the spec is two-sided (or one-sided with a hard limit), and the data behaves reasonably normally. These are the five attribute families where capability is most commonly reported, with the spec basis each is anchored to.
1
Assay (Potency)
Typically 90.0–110.0% LC
The most common Cpk target. Mean potency vs label claim, two-sided spec. Narrow-therapeutic-index APIs may require ≥ 1.67.
2
Content Uniformity
USP <905> acceptance value
Variation between individual dosage units. Captures blend uniformity and tablet-to-tablet consistency. Critical for low-dose and combination products.
3
Tablet Weight & Hardness
Compendia + product-specific limits
Highest data density per batch (in-process every minute). Often the earliest indicator of compression-stage drift or punch wear.
4
Dissolution
Q-value at specified time
Three-stage USP test. Capability analysis usually applied to mean release at the critical time point across batches, not individual unit results.
5
Sterile Fill Volume, pH, Osmolality
Product-specific narrow bands
Aseptic and parenteral attributes. Cpk targets routinely ≥ 1.33, with critical fills (small-volume parenteral) frequently held to ≥ 1.67.
Worked Example — Tablet Assay, 30 Batches
The most useful version of this article is one where the math is on the page. Here is a representative tablet assay data set: 30 commercial batches, individual batch means, label claim 100 mg, spec 90.0–110.0%.
Cp
(110 − 90) / (6 × 2.1) = 1.59
Potential looks healthy
Cpk
min[(110 − 99.6)/(3 × 2.1), (99.6 − 90)/(3 × 2.1)] = 1.52
Above 1.33 — capable
Pp
(110 − 90) / (6 × 3.4) = 0.98
Overall is below 1.0 — concerning
Ppk
min[(110 − 99.6)/(3 × 3.4), (99.6 − 90)/(3 × 3.4)] = 0.94
Real-world performance below target
What this combination actually says
Cpk of 1.52 says the within-batch process is in good shape. Ppk of 0.94 says that when you look across all 30 batches together, the process behaves much worse. The 0.58 gap between them is between-batch drift — likely raw material lots, equipment cleaning differences, or environmental variation across the months of production. This is the exact pattern that passes a single-batch release test and fails a CPV trend review.
The Calculation Workflow — Six Steps, In Order
Where most pharma capability studies go wrong is not the formula. It is the steps before the formula. Sample selection, normality check, control-chart status, and σ estimation method all shape the number the formula returns. Skip them and the Cpk you publish is a number, not a measurement.
Step 1
Define the CQA and its specification
Two-sided or one-sided. Compendia, regulatory, or internal limit. Tie the spec to a control plan reference so the auditor sees the lineage.
Step 2
Pull a representative data set
Minimum 25–30 batches for a meaningful capability estimate. All from the same validated process state. Document any excluded batches with rationale.
Step 3
Verify statistical control
Plot the data on an X-bar and R chart (or I-MR for individual values). Capability analysis on an out-of-control process is invalid. Stabilize first, capability second.
Step 4
Test for normality
Anderson-Darling or Shapiro-Wilk. Non-normal data needs transformation (Box-Cox, Johnson) or distribution-fit capability methods. Default formula assumes normality.
Step 5
Estimate σ correctly
Within-subgroup σ for Cp/Cpk via R-bar/d2 or pooled SD. Overall σ for Pp/Ppk via classical sample SD. The two will differ when the process is unstable.
Step 6
Calculate and report with CI
Point estimate is only half the report. Include 90% or 95% confidence interval. Cpk = 1.40 (90% CI: 1.18, 1.62) is auditor-ready. Cpk = 1.40 alone is not.
Want this run on your real batch records? Share 30 batches of assay or weight data and we will run all six steps and return a CPV-ready capability report.
The FDA Three-Stage Lifecycle — Where Capability Fits
FDA's Process Validation guidance establishes a three-stage lifecycle. Capability analysis appears in different forms at each stage, with different acceptable thresholds. Knowing which Cpk number belongs to which stage saves a lot of audit-day pain.
Stage 1
Process Design
Capability is forecasted from development and characterization data. The expectation is that the designed control strategy can deliver Cpk ≥ 1.33 at commercial scale. Stage 1 exit gate: high confidence that the process can be capable, not yet that it is.
Stage 2
Process Performance Qualification (PPQ)
Capability is calculated on the PPQ batches themselves (typically 3+, more for complex products). Cpk ≥ 1.0 with 90% confidence is the floor most sponsors are willing to defend; Cpk ≥ 1.33 is the modern norm before commercial release.
Stage 3
Continued Process Verification (CPV)
Capability is monitored continuously across commercial batches. Trend Cp, Cpk, Pp, and Ppk over rolling windows (typically 20–30 batches). Decline in capability triggers investigation before specification failure occurs. CPV is mandatory, not optional.
When Capability Drops — The Six Investigation Lanes
A capability number that declined since the last quarterly review is a question, not an answer. Where the answer lives is in one of six places. Walk these in order. The earliest lanes are the cheapest to investigate.
Lane 1
Measurement System
Before chasing the process, verify the measurement. GR&R on the analytical method. HPLC column age, reference standard lot, balance calibration. The variation may not be the process — it may be the test.
Lane 2
Raw Material Lots
Trend Cpk against API and major excipient lot changes. Lot-to-lot shifts in particle size, moisture, or impurity profile are the single most common source of between-batch variation drift.
Lane 3
Equipment State
Compression tooling wear, blender baffle condition, fluid bed nozzle calibration, capsule filler dosing disc. Maintenance cycle drift quietly degrades capability over months.
Lane 4
Environmental Conditions
RH and temperature drift in compression, granulation, and packaging suites. Hygroscopic APIs and friable blends are particularly RH-sensitive. Trend Cpk vs HVAC log.
Lane 5
Operator & Shift
Stratify the data by operator, by shift, by day-of-week. If capability drops on one combination, the SOP or training has a gap. Quiet drivers, easy to fix once found.
Lane 6
Subgroup Logic
Rational subgrouping affects the within-σ estimate. If subgroups span natural process shifts (compression speed change, blend split), σ-within is inflated and Cpk falls without any real process change.
Common Cpk Misreadings — The Auditor's Quick List
These are the errors that show up most often in capability reports submitted for QA review. Each one inflates or deflates the number in a way that can be caught on a single page of the calculation log.
Computing Cpk on non-normal data without transformation
Run Anderson-Darling first. If p < 0.05, transform or use a distribution-fit method.
Reporting Cpk on an out-of-control process
Capability is only valid on a process in statistical control. Stabilize, then measure.
Treating Cpk ≥ 1.0 as universally acceptable
Risk-tier the CQA. NTI APIs and parenteral attributes routinely require ≥ 1.67.
Using sample SD for Cpk (it is Ppk)
Cpk requires within-subgroup σ (R-bar/d2 or pooled SD). Sample SD belongs to Ppk.
Ignoring the Cpk–Ppk gap
A divergence is a finding, not a footnote. Always investigate when the two indices disagree.
Reporting point estimate without confidence interval
Cpk estimates from 30 batches have meaningful uncertainty. Always report a CI.
Frequently Asked Questions
Does FDA require a specific Cpk value?
No. FDA does not mandate a specific Cpk in 21 CFR Part 211 or in its Process Validation guidance. What FDA does require is statistical evidence that the process consistently produces product meeting its quality attributes. Cpk ≥ 1.33 has emerged as the de facto industry target for commercial pharma manufacturing, with higher thresholds for critical attributes and narrow-therapeutic-index APIs.
How many batches do I need for a meaningful capability study?
Twenty-five to thirty batches is the practical minimum for stable point estimates with usable confidence intervals. Three PPQ batches give you a Stage 2 readout but the capability number is highly uncertain — always report it with a 90% CI. CPV trending typically uses rolling 20–30-batch windows.
Should I report Cpk or Ppk to the auditor?
Report both, always. Cpk shows what the process is capable of under stable conditions. Ppk shows what the process is actually doing across all observed variation. The gap is the conversation. Reporting one without the other is the most common preventable finding in a capability review.
What if my data is not normal?
Run a formal normality test (Anderson-Darling or Shapiro-Wilk). If the data fails, two paths: transform the data (Box-Cox or Johnson transformation) and apply standard Cpk, or use a non-normal capability method (Pearson or distribution-fit). Document the method choice and rationale in the calculation log. Auditors accept both — they object to assuming normality without checking.
My Cpk is fine but Ppk is much lower — what do I do?
Walk the six investigation lanes in order: measurement system, raw materials, equipment, environment, operators/shifts, subgroup logic. The Cpk–Ppk gap is between-batch variation that does not appear inside a single batch. The investigation is structured rather than guess-and-check; document each lane that was checked and what was found.
How does CPV use capability indices?
Continued Process Verification trends Cp, Cpk, Pp, and Ppk over rolling batch windows. Declining trends trigger investigation before any individual batch fails spec. CPV is the early-warning system that converts capability from a one-time validation number into ongoing process intelligence.
Stop Reporting Capability and Start Reading It
Run Cp, Cpk, and Ppk on Your Real Batches — In 30 Minutes
Share 30 batches of assay, weight, content uniformity, or dissolution data. We will run all four indices with confidence intervals, walk the Cpk–Ppk gap, and identify which of the six investigation lanes is driving any divergence.
4
Indices computed per CQA
6
Investigation lanes structured
CPV
Ready for Stage 3 monitoring
21 CFR
211 audit-ready output