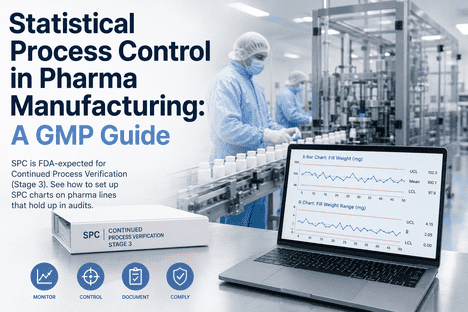
Statistical Process Control in Pharma Manufacturing: A GMP Guide
By Larry Eilson on May 18, 2026
A pharmaceutical plant runs 30 commercial batches, charts the dissolution numbers in a spreadsheet, sees a slow drift toward the upper specification limit on batch 22, and nobody notices until the OOS investigation lands eight weeks later. By that point three lots are on hold, the deviation file is open, and the FDA inspector arriving next month will ask the one question every Quality head dreads: "Show me your Stage 3 trending — can you demonstrate the process was in a state of control?" That moment is the difference between a routine inspection and a Form 483. Statistical Process Control is not a nice-to-have analytics layer. It is the FDA-expected mechanism for Continued Process Verification under the 2011 Process Validation guidance, the only auditable way to prove a state of control across the product lifecycle, and the single best defense against the slow drifts that turn a validated process into a recalled batch. This guide walks through how SPC is actually set up on a GMP pharmaceutical line, what charts hold up in an audit, and where the line between "we have SPC" and "we have SPC that the FDA accepts" actually sits.
GMP · Stage 3 CPV · ICH Q10
Statistical Process Control That Survives an FDA Audit — Not Just a Spreadsheet With Control Limits.
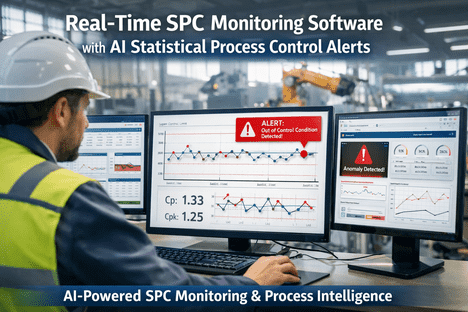
Real-time SPC charts, Cpk/Ppk capability tracking, automated CAPA triggers, and 21 CFR Part 11 audit trails on a turnkey NVIDIA AI server. Pre-configured, pre-validated, deployed on your pharmaceutical lines in 6–12 weeks.
Pharma manufacturing software market by 2031 at 12.55% CAGR
87%
Pharma and biotech firms now deploy quality management software
30
Batches typically needed to establish SPC alert limits in CPV Phase 1
74%
Regulatory failures linked to manual data handling errors
The Spreadsheet Problem — Why Stage 3 Demands More
Most pharmaceutical plants have been "doing SPC" for years. The reality, in the majority of facilities, is that batch data is exported from a MES or PLC system into a controlled spreadsheet, an analyst calculates mean and standard deviation, and a control chart gets pasted into the Annual Product Quality Review. That workflow satisfied a 1990s interpretation of process monitoring. It does not satisfy the FDA's 2011 Process Validation guidance, and it will not survive a modern inspection focused on data integrity and ALCOA+ principles.
Spreadsheet-Based Trending
What most plants still do
Detection latency2–12 weeks post-batch
Data integrityManual transcription, audit-trail gaps
Western Electric rulesRarely applied, often miscoded
CAPA triggerReactive — after OOS event
FDA inspection postureHigh risk — 483 observations common
21 CFR Part 11Not compliant without compensating controls
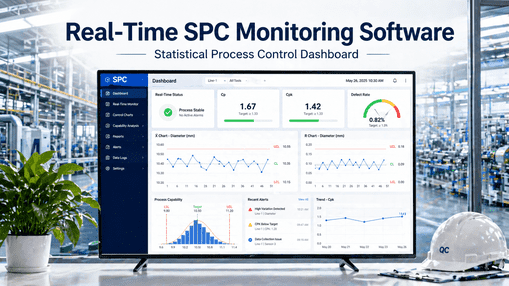
Real-Time SPC on a Validated Platform
What FDA Stage 3 actually expects
Detection latencyWithin-batch, signal in minutes
Data integrityDirect from PLC, sealed audit trail
Western Electric rulesAll 8 rules automated, false-alarm tuned
CAPA triggerProactive — drift detected before OOS
FDA inspection postureAudit-ready, evidence on demand
21 CFR Part 11Native compliance, validated build
The FDA's Three-Stage Lifecycle — and Where SPC Lives
The 2011 Process Validation guidance reframed validation as a lifecycle activity rather than a one-time event. The phrase that matters is in Stage 3, and the regulatory expectation is unambiguous: a state of control must be demonstrated continuously, with statistical methods, for the life of the product. Stage 3 is not optional, and APQR trending alone does not satisfy it.
Stage 1
Process Design
Risk assessment, design of experiments, identify CPPs and CQAs, define a control strategy aligned with ICH Q8/Q9/Q10.
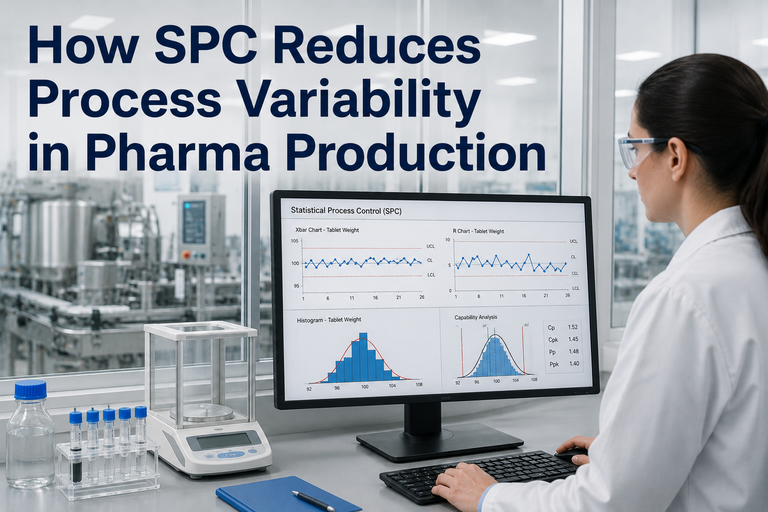
The Four SPC Charts That Carry the Weight in Pharma
Hundreds of control chart variants exist in textbooks. In a real GMP pharmaceutical plant, four do the heavy lifting — and the choice of chart for each parameter is itself an audit-traceable decision documented in the CPV protocol. The twin of an effective SPC program is that the right chart is matched to the right data type, the right sample structure, and the right detection objective.
I-MR (Individuals & Moving Range)
Use for batch-level data where one measurement per batch is the natural unit — assay, dissolution mean, microbial endotoxin.
Most-used chart for finished product CQAs across the industry
X-bar & R
Use when multiple measurements form a subgroup — tablet weight from a 10-tablet sample, fill volume across a vial tray.
Detects both mean shifts and within-subgroup variation in one view
EWMA (Exponentially Weighted Moving Average)
Use for early detection of small, sustained drifts — fill weight creeping toward upper limit, dissolution slowly degrading lot over lot.
Catches the slow drift that Shewhart rules miss until OOS
p-chart & np-chart
Use for attribute data — visual inspection reject rate, capsule defect rate, label printing fail rate per lot.
Tracks defect proportions when measurements are pass/fail rather than continuous
From CPP to CQA — The Map That Drives Every Pharma SPC Plan
SPC in pharmaceutical manufacturing only works when the right things are being charted. The discipline that gets this right is QbD — Quality by Design — which establishes a traceable map from each Critical Process Parameter back to the Critical Quality Attribute it influences. Below is the canonical map for a solid oral dose line. Every CPP on the left flows to one or more CQAs on the right; every flow is a candidate SPC chart, and the highest-risk flows become mandatory ones documented in the CPV protocol.
Critical Process Parameters (CPP)
P1Compression force (kN)
P2Turret speed (RPM)
P3Pre-compression force
P4Feeder speed
P5Granulation moisture (LOD)
P6Coating spray rate
P7Inlet air temperature
SPC
Engine
Real-time monitoring & signal detection
Critical Quality Attributes (CQA)
Q1Tablet hardness
Q2Weight uniformity
Q3Content uniformity
Q4Friability
Q5Dissolution rate
Q6Film thickness
Q7Assay
Move From Spreadsheet-Based Trending to Real-Time, Audit-Ready SPC — Without Rebuilding Your Validation Package.
A turnkey AI server pre-loaded with validated SPC, Cpk/Ppk tracking, Western Electric rule automation, 21 CFR Part 11 audit trails, and CAPA integration. Pre-configured hardware, software ready, deployed in 6–12 weeks. What you get: hardware + software + training + 24×7 support.
Reading Process Capability — Cpk, Ppk, and the 1.33 Threshold
Control charts tell you whether a process is in control. Capability indices tell you whether an in-control process is actually good enough to meet specifications. The two metrics every pharmaceutical Quality team reports to the FDA are Cpk (short-term capability within a batch) and Ppk (overall process performance across batches). The scale below is the practical interpretation used in CPV protocols across the industry.
< 1.00
Not Capable
Process variation exceeds spec window. Immediate CAPA. High OOS risk.
1.00–1.33
Marginal
Acceptable per FDA Stage 3A criteria (Ppk > 1.0) but improvement plan expected.
1.33–1.67
Capable
Industry-accepted minimum for new commercial processes. Routine monitoring sufficient.
> 1.67
Highly Capable
Six-sigma class. Reduced sampling defensible with risk assessment.
Stage 3A protocols typically require Ppk > 1.0 across a predetermined number of consecutive commercial batches to demonstrate statistical control. Cpk and Ppk together form the capability story regulators expect to see in the APQR and the CPV report.
Anatomy of an Audit-Ready SPC System
An inspector does not ask whether a plant has SPC. The inspector asks how it works, who built the limits, what triggered the last signal, what action followed, and whether the audit trail is sealed. Below is the six-element checklist that separates an SPC system that satisfies the FDA from one that produces an observation.
01
Validated Control Limits
Alert and action limits derived from at least 30 commercial batches (CPV Phase 1), documented in a pre-approved protocol, reviewed at defined intervals. No arbitrary 3-sigma limits without statistical justification.
02
Direct Data Integrity
Data flows directly from PLC, MES, or LIMS into the SPC engine — no Excel intermediate, no manual transcription, no copy-paste. ALCOA+ principles satisfied at the source.
03
21 CFR Part 11 Compliance
Electronic signatures, time-stamped audit trails, role-based access, validated change control. Every chart, limit change, and signal response carries a tamper-evident record.
04
Tuned Signal Rules
Western Electric rules applied with awareness of pharma data characteristics — autocorrelation, non-normality, mixed within-batch and between-batch variation. False-alarm rate documented and managed.
05
CAPA Integration
Every action-limit excursion automatically opens a CAPA ticket. Investigation timeline, root cause classification, and corrective action are linked to the original SPC signal in one auditable record.
06
Periodic Re-Evaluation
Capability indices reviewed and control limits re-baselined on a defined schedule — typically annually or after defined process changes. Documented as part of the CPV report and APQR.
The ROI Numbers — What SPC Done Right Returns
SPC in pharmaceutical manufacturing earns its place not because of regulatory compliance alone, but because the numbers underneath compliance are substantial. Batch failures, OOS investigations, recall risk, and inspection findings each carry costs that compound over the product lifecycle. The market is responding accordingly — pharma manufacturing software is projected to grow from $4.01B in 2026 to $7.24B by 2031, driven specifically by the FDA-mandated shift to validated digital quality platforms.
30%
Reduction in batch-related cost overruns when machine-learning drift detection is layered on top of SPC control charts
Pharma manufacturing software industry research 2026
30–40%
Acceleration in CAPA closure time when SPC signal events are auto-routed into integrated CAPA workflow — investigation time drops from weeks to days
QMS deployment benchmarks across pharma 2024–2025
$11B+
Aggregate pharma industry regulatory fines paid in recent years — much of it linked to data integrity and process control documentation gaps
Pharmaceutical compliance industry analysis 2026
87%
Of pharma and biotech firms have deployed quality management software, driven by FDA, EMA, and global regulatory pressure on data integrity
Pharmaceutical QMS market size report 2024
77%
Of QMS implementations in 2024 were cloud-based — but pharma plants with sensitive process data increasingly choose on-prem AI servers for OT segmentation
QMS deployment architecture trends
74%
Of regulatory failures traced back to manual data handling errors — eliminated when SPC consumes PLC and LIMS data directly
FDA Computer Software Assurance guidance research
Frequently Asked Questions
Is SPC actually required by the FDA, or is it just recommended?
The FDA's 2011 Process Validation guidance does not name SPC by acronym as a mandatory tool, but it explicitly requires statistical methods to demonstrate a state of control during Stage 3 Continued Process Verification — and SPC is the universally accepted statistical method that satisfies this requirement. EU GMP Annex 15 reinforces the same expectation. FDA Warning Letters routinely cite Stage 3 monitoring failures where statistical evaluation was missing or inadequate. In practice, SPC is the operational mechanism through which CPV is demonstrated.
How many batches do we need before SPC limits are valid?
Industry practice and BioPhorum Operations Group guidance converge on approximately 30 batches for the CPV Phase 1 short-term period during which alert limits, review parameters, and risk profiles are established. Some processes with fast cycle times reach this in months; others with longer batch cycles take a year or more. Before reaching 30 batches, provisional limits derived from PPQ data are used and clearly identified as such in the CPV protocol.
Do we need to buy the NVIDIA AI server separately to run this?
No. The iFactory SPC platform ships as a turnkey AI appliance — pre-configured NVIDIA server with the SPC engine, capability tracking, audit-trail database, and visualization layer pre-loaded and pre-validated. You provide line power, network, and floor space. Field technicians dispatched globally handle network segmentation, OPC UA or Profinet handshakes with PLCs, LIMS integration, and operator training. Live in 6–12 weeks with a 3-phase roadmap.
Does the system handle 21 CFR Part 11 compliance out of the box?
Yes. The platform ships with electronic signature workflows, sealed audit trails on every data record and configuration change, role-based access control, and a validated change-control history. Standard validation documentation — IQ, OQ, PQ protocols, traceability matrix, and validation summary report — is delivered with the system to support your internal computer system validation under FDA Computer Software Assurance principles.
Can SPC catch slow drifts, or only sudden process shifts?
Both, but you need the right chart for each. Shewhart-style I-MR and X-bar charts detect sudden shifts effectively but are slow on small sustained drifts. EWMA and CUSUM charts are designed specifically for small drift detection — exactly the failure mode that turns a validated process into an OOS investigation eight weeks late. A well-built CPV program runs Shewhart and EWMA in parallel on critical CQAs, and the platform handles this configuration without requiring a statistician for each chart change.
How do you handle false alarms from autocorrelated pharma data?
Pharmaceutical process data frequently violates the classical Shewhart assumption of independent, normally distributed observations — fermentation, granulation, and coating processes especially. Applying textbook Western Electric rules to autocorrelated data generates false signals that cripple a CPV program through investigation fatigue. The iFactory platform applies tuned rule sets, time-series-aware control charts, and false-alarm rate monitoring so signals that fire are signals worth investigating. The configuration choices are documented and audit-traceable.
Does this replace our existing LIMS, MES, or eQMS?
No — and it shouldn't try to. The SPC platform is purpose-built for real-time process monitoring and integrates with your existing LIMS for analytical results, MES for batch context, and eQMS for CAPA workflow. Standard connectors are available for the major systems (Veeva Vault QualityDocs, MasterControl, TrackWise, Empower, LabWare). Your existing validated systems remain the system of record; the SPC platform consumes data from them and feeds signals back through documented interfaces.
From "We Trend in Excel" to "Here's Our State of Control, Documented and Audit-Ready" — That's the Shift Inspectors Are Looking For.
A turnkey pharmaceutical SPC platform on a pre-configured NVIDIA AI server. Validated build, 21 CFR Part 11 native, GMP-grade audit trail, CAPA integration, Cpk/Ppk tracking, tuned Western Electric rules. 1000+ industrial clients, 99.9% uptime, 24×7 fully managed service. Live in 6–12 weeks with a contractually committed delivery date.