Statistical Process Control in Power Plants: A Practical Guide
By Josh Brook on May 12, 2026
The plant manager at a 660 MW supercritical coal unit in Singrauli got the call at 11:42 PM on a Saturday. Bearing vibration on the LP turbine had crossed the alert setpoint at 11:38, gone to alarm at 11:41, and tripped the unit at 11:42 — total elapsed time, four minutes. The post-event analysis told a different story. Vibration had been creeping upward for 31 hours. Heat rate had drifted by 47 Btu/kWh over the same window. Bearing oil temperature had crossed the +2σ line of its 30-day baseline at 4:14 PM Friday. None of these three signals tripped a DCS alarm. Each one stayed inside its hard limit. But every one of them was screaming "out of control" in the language of statistical process control — and nobody was listening, because no SPC chart was running. The plant lost 17 hours of generation and ₹3.2 crore of revenue to a trip that statistical process control would have caught Friday afternoon. This is the gap SPC closes in modern power plants — not by replacing the alarm system, but by adding a layer of pattern detection that fires hours, sometimes days, before the alarm ever could.
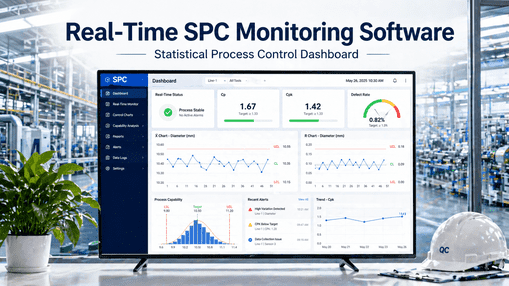
SPC for Power Plants · Practical Implementation Guide
SPC Catches Drift in Heat Rate, Vibration, Emissions, and Water Chemistry — Before Your Alarm System Even Sees It.
A practical guide to applying statistical process control inside the modern thermal, combined-cycle, and HRSG power plant. Real charts, real rules, real signals — running on an on-premise AI appliance, live in 6–12 weeks. Hardware + software included.
Average SPC lead time over alarm-based detection on slow-developing faults
47 Btu
Typical heat-rate drift hidden inside ±3σ before any alarm threshold trips
8 rules
Nelson Rules to detect non-random patterns in real plant data
₹3.2 cr
Revenue lost in a single 17-hour trip — preventable with SPC pattern alerts
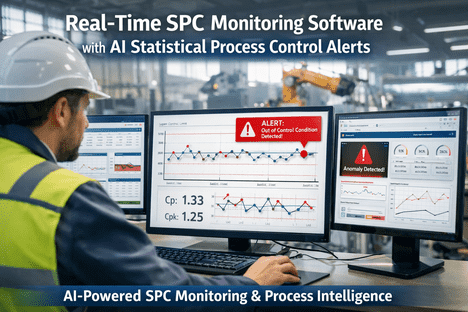
SPC vs Alarms — Why Your DCS Misses Drift That SPC Catches
The DCS alarm system was designed for safety, not statistics. It fires when a parameter crosses a hard limit. SPC was designed for control — it fires when a parameter starts behaving in ways that are no longer random, even while every reading is still inside the hard limit. These are two completely different jobs, and in a power plant you need both. Here's the timeline that explains why.
T -36 hrs
Process Stable
All parameters inside ±2σ. Heat rate, vibration, NOx, conductivity all within statistical control. No action needed. SPC chart shows random scatter around mean.
T -8 hrs
SPC Pattern Signal Fires
7 consecutive points trending upward on LP turbine bearing vibration. Nelson Rule 3 triggered. Reading still 38% below alarm threshold. SPC alerts shift engineer. DCS shows nothing.
T -4 hrs
Second SPC Rule Triggered
Bearing oil temperature also trends upward — 2 of 3 points outside +2σ. Now two correlated parameters showing non-random behavior. SPC raises severity. Still no DCS alarm.
T -10 min
Alert Setpoint Crossed
DCS pre-alarm triggers. Operator sees vibration approaching limit. By this point, the SPC system has been signaling for nearly 8 hours. Most plants only see this final moment.
T 0
Trip Alarm
Hard limit crossed. Protection trip. 17 hours of lost generation. Without SPC, the only signal the plant ever sees is the last 10 minutes. With SPC, the plant had 8 hours of structured warning.
Every power plant runs hundreds of monitored signals — but four domains drive almost all the operational losses where SPC has clear, measurable impact. Heat rate degradation, rotating equipment vibration, emissions excursions, and water chemistry drift. Each has well-understood signatures that SPC charts catch long before any control loop or alarm threshold.
01
Heat Rate & Efficiency
Typical drift: 30–120 Btu/kWh over 90 days · Lost: ₹1–6 cr/year per unit
Net unit heat rate — Xbar-R chart on hourly average, baseline reset quarterly
Condenser backpressure — I-MR chart, alerts on Nelson Rule 2 (shift detection)
Here's what an Xbar-R chart looks like on a 660 MW unit's LP turbine bearing vibration — recorded across the 36 hours leading up to a forced outage that was preventable. The chart tells you what the alarm system never could.
What the SPC chart told the plant — and what the DCS missed:
T -28 hours — 7 consecutive points trending upward. Nelson Rule 3. Vibration reading 4.4 mm/s, well inside the alert setpoint of 5.6 mm/s. DCS shows nothing.
T -14 hours — Reading crosses +1σ. 4 of 5 points outside 1σ. Nelson Rule 5. Bearing oil temp on a separate chart now also shows Rule 3 trend. Two correlated signals out of control.
T -6 hours — Reading crosses +2σ. 2 of 3 outside 2σ. Nelson Rule 2. Maintenance has had 22 hours of warning by now. With SPC, this is when a planned shutdown gets scheduled.
T -10 minutes — DCS pre-alarm finally fires. Without SPC, this is the first signal anyone sees. The 28-hour SPC warning window is the entire difference between a planned ramp-down and a forced trip.
The 8 Nelson Rules — Pattern Recognition for Power Plant Signals
Western Electric Rules and Nelson Rules are the standard library of pattern signals an SPC engine looks for. In power plant data they show up constantly — but only if you're charting the data with proper control limits. Here are the 8 Nelson Rules and what they typically mean inside a thermal or combined-cycle plant.
Rule 1
Beyond 3σ
One point falls outside the control limits
Power-plant translation: An assignable cause has acted on the process. Possible: actuator failure, sensor fault, sudden load change, water chemistry contamination event
Rule 2
9-Point Shift
9 consecutive points on the same side of the mean
Step change in process behavior. Possible: fuel quality change, equipment swap (e.g., mill change), seasonal ambient shift, control loop retuned
Rule 3
6-Point Trend
6 consecutive points trending in one direction
Steadily developing fault. Possible: bearing wear, tube fouling, FGD slurry density drift, ID fan blade erosion, calibration drift
Rule 4
14-Point Alternation
14 consecutive points alternating up and down
Control loop hunting. Possible: PID tuning issue, two operators correcting against each other, sensor noise, sticky valve
Rule 5
2 of 3 Beyond 2σ
2 of 3 consecutive points more than 2σ from mean (same side)
Process drift accelerating. Possible: vibration ramping, condenser fouling crossing into significant, emission excursion forming
Rule 6
4 of 5 Beyond 1σ
4 of 5 consecutive points more than 1σ from mean (same side)
Earlier-stage drift, often the first useful warning. Possible: heat rate creep, gradual seal wear, soot blower effectiveness reduction
Rule 7
15-Point Hugging
15 consecutive points within 1σ of the mean
Variability has dropped suspiciously. Possible: sensor stuck, transmitter saturated, control loop in manual, dead-band masking real variance
Rule 8
8-Point Bimodal
8 consecutive points outside 1σ on both sides of mean
Two populations mixed. Possible: alternating fuel sources, shift-handover process change, mill swap creating bimodal coal flow
Your DCS Has the Signals. SPC Reads Them.
iFactory's SPC engine ships as a turnkey on-premise appliance — pre-configured NVIDIA AI server, control chart library, Nelson Rule engine, pattern alert system. Connects to your existing DCS, SCADA, CEMS, and chemistry feeds. Live in 6–12 weeks.
Implementing SPC in a Power Plant — 5 Practical Steps
SPC fails in plants when it's deployed as a software project. It succeeds when it's deployed as a control discipline supported by software. This 5-step rollout is what works in real power plants.
01
Select the Right Signals — Don't Chart Everything
A typical 660 MW unit has 8,000–15,000 monitored tags. Charting all of them creates noise, not insight. Start with 60–120 critical signals: net heat rate, bearing vibrations on every major rotating asset, CEMS outputs, key chemistry signals, condenser backpressure, mill outlet temperatures, feedwater heater terminal differences. Add more only when proven valuable.
02
Establish Control Limits From 90 Days of Clean Data
Pull 90 days of historical data for each charted signal, filter for known abnormal events (trips, startup, derates, maintenance windows), then compute mean and σ from the clean baseline. UCL/LCL set at ±3σ. Capability indices (Cp, Cpk) calculated against operational tolerance windows. Re-baseline quarterly or after any major overhaul.
03
Activate Nelson Rules in Two Stages
Stage 1: enable Rules 1, 2, 3, 5 only. These are the high-signal-to-noise rules. Let operators get used to seeing pattern alerts before adding the more sensitive Rules 4, 6, 7, 8. Stage 2 begins after 30 days of stable Stage 1 operation. Premature activation of all 8 rules creates alert fatigue and kills adoption.
04
Define the Response Routine
An SPC alert without a defined response is just an email. Each rule trigger on each chart should map to a clear next action: investigate immediately, log and watch, escalate to maintenance, trigger a work order. Document who owns each response, what verification looks like, and how to close the alert. The SPC platform should enforce this routine, not leave it to operator discretion.
05
Review Capability Monthly, Re-baseline Quarterly
SPC isn't deploy-and-forget. Monthly capability reviews — Cpk for each charted signal compared to last quarter — tell you whether the process is improving, stable, or deteriorating. Quarterly re-baselining keeps control limits aligned with the real operating envelope. Annual full-scope reviews catch signals that should be added or retired.
The Numbers — What SPC Recovers in a Typical Thermal Power Plant
30–120
Btu/kWh heat rate drift
Recovered by SPC-driven detection of condenser fouling, air heater leakage, feedwater heater performance — before it shows up in monthly performance reports
1–3
Forced outages avoided/yr
Per unit, on average — through early bearing vibration detection, water chemistry ingress alerts, and combustion drift signals
4–72
Hours SPC lead time
Over alarm-based detection on slow-developing faults — long enough to plan a load reduction or controlled shutdown instead of a trip
60–80%
Chemistry-driven tube failures reduction
When SPC controls dosing and continuously charts cation conductivity, dissolved oxygen, and silica trends
8–14
Month payback period
Typical for SPC platform deployment in a thermal plant — from heat rate, availability, and chemistry-driven tube failure savings combined
99.9%
Platform uptime SLA
iFactory's on-premise SPC appliance runs continuously, 24×7 monitoring, with remote support and monthly model retraining included
What Goes Wrong When Plants Skip SPC (And Try to Live on Alarms Alone)
Forced outage
Bearing failure crosses alarm with no warning
Vibration drifted for days inside the alert threshold. Trip happens during peak hours. 12–48 hours of lost generation. ₹1–6 crore in single-event cost.
Heat rate creep
Efficiency drops 1.5% over a quarter unnoticed
Monthly performance report flags it. By then, $400K–$1.2M of extra fuel has already been burned. Root cause never traced because the drift signal is buried in daily averages.
Emissions excursion
NOx consent value exceeded during ramp event
CPCB regulatory event, financial penalty plus reporting overhead. SPC would have shown the slow drift in burner balance two weeks earlier — when fixing it was a tuning adjustment, not a regulatory event.
Tube failure
Boiler tube leak forces unplanned shutdown
Cation conductivity had a slow upward drift for 30 days. Grab samples didn't reveal it. SPC chart would have shown Rule 6 (4 of 5 outside 1σ) early enough to identify the condenser leak. ₹40 lakh–₹2 crore per tube event.
CEMS calibration
Emissions analyzer slowly biases over months
Compliance reports look fine, then a CPCB audit catches the drift. Penalty + remediation cost. SPC's Rule 7 (15-point hugging) catches stuck-sensor patterns the moment variance drops below expected — long before a manual cal check.
6–12 Weeks From Order to a Working SPC Discipline
Weeks 1–4
Ship · Integrate · Baseline
Pre-configured NVIDIA AI appliance ships to plant. Field techs connect DCS, SCADA, CEMS, chemistry analyzer feeds. 90 days of historical data ingested. 60–120 critical signals selected with the plant's engineering team. Clean-data baseline computed for control limits.
Weeks 5–8
Configure · Pilot · Train
Control charts and capability indices established. Stage 1 Nelson Rules (1, 2, 3, 5) activated in advisory mode. Response routines drafted with shift engineers. Pilot one shift on the new SPC workflow. Train CCR operators, performance engineers, and maintenance leads.
Weeks 9–12
Go Live · Stage 2 · Optimize
Full plant rollout. Pattern alerts go live to operator HMIs. Stage 2 rules (4, 6, 7, 8) activated after 30 days of clean operation. Monthly capability review begins. 24×7 remote support and quarterly model retraining engaged.
What's Included — All Hardware, All Software, All Integration
Pre-loaded AI Appliance
NVIDIA-powered SPC engine, racked and shipped ready. Control chart library, Nelson Rule processor, pattern alert system all pre-installed and pre-tuned.
DCS / SCADA Integration
OPC-UA, Modbus TCP, OPC HDA, MQTT, REST adapters. Works with ABB Symphony, Emerson Ovation, Yokogawa CENTUM, Siemens T3000, and most CEMS analyzer brands.
Plant-Specific Baselining
Control limits, Cpk baselines, response routines all built from your 90-day operating data — not a generic library. Re-baselined quarterly as part of the managed service.
Field Integration
On-site cabling, network setup, data feed verification, HMI integration into operator workstations, CCR layout consultation.
Operator & Engineer Training
In-person and recorded training for shift operators, performance engineers, maintenance leads, and the plant's instrumentation team.
Managed Service · 24×7
Remote monitoring, monthly model retraining, quarterly capability review with your performance head, 99.9% uptime SLA.
Why iFactory for Power Plant SPC
01
Designed for the Slow-Developing Fault
Most generic SPC tools chart whatever you give them. iFactory is configured around the specific drift signatures power plants actually face — bearing degradation, heater fouling, FGD slurry drift, cation conductivity creep, mill classifier wear. The rule set, chart types, and alert thresholds are pre-tuned for these signals out of the box.
02
100% On-Premise — Your Data Never Leaves
The SPC engine, control charts, baseline data, and alert history all live on the in-plant NVIDIA appliance. No cloud round-trip, no external data exposure, no compliance friction with NERC CIP, IEC 62443, or local cyber-security requirements. Critical for nuclear, defense-linked, and grid-critical sites.
03
Operator-First UI, Not Statistician-First
The shift engineer doesn't need to know what an X-bar chart is. The screen shows the signal, the trend, the rule fired, and the recommended action. The math runs in the background. Performance engineers and maintenance leads get the full statistical layer — operators get clarity.
04
Audit-Ready by Default
Every chart, every baseline, every rule trigger, every operator response — timestamped, signed, archived. When CPCB, NERC, an internal performance audit, or the OEM asks for evidence of process control discipline, the answer is three clicks away. No paper trails. No reconstructing what happened.
Frequently Asked Questions
Doesn't our DCS already do this? Why do we need a separate SPC system?
No — and the difference matters. A DCS alarms when a value crosses a hard limit. An SPC system alerts when a value's behavior changes — even when every reading is still well inside the limits. These are two different jobs. Vibration creeping upward inside the alert threshold is invisible to the DCS and obvious to SPC. Net heat rate drifting 80 Btu/kWh across a quarter is invisible to the DCS and shows up on day 12 of the drift in SPC. The DCS protects the plant; SPC controls the process. You want both.
Will SPC create alert fatigue for our operators?
Only if it's deployed badly. The deployment routine — Stage 1 rules first (Rules 1, 2, 3, 5), then Stage 2 after 30 days — is designed specifically to prevent alert fatigue. Pattern signals are also routed by role: operators see only the alerts that demand immediate response, performance engineers see trend-class signals, maintenance leads see equipment-class signals. By go-live, a typical 660 MW unit generates 12–20 actionable SPC alerts per week — not per shift. Each one is real.
How long before SPC starts paying back?
Heat rate signals typically pay back first — within 60–90 days of go-live, plants identify 30–80 Btu/kWh of recoverable drift (condenser fouling, heater performance, air heater leakage). Vibration-driven outage avoidance shows up over the first 6–12 months as one or two trips get pre-empted. Water chemistry tube-failure reduction takes 12–18 months to show up statistically, because tube events are rare to start with. Total ROI window is typically 8–14 months.
Can SPC integrate with our existing performance monitoring software (PI, eDNA, etc.)?
Yes. iFactory connects directly to OSIsoft PI (now AVEVA PI), GE eDNA, Emerson PHD, Yokogawa Exaquantum, and most industrial historians via standard interfaces (PI Web API, OLE DB, OPC HDA, REST). The SPC platform reads from your existing historian — it doesn't replace it. Where you don't have a historian, the appliance can also ingest directly from the DCS via OPC-UA or OPC HDA and persist its own time-series store.
Does this work for combined-cycle plants, not just coal-fired thermal?
Yes — and the signal mix is different. Combined-cycle and HRSG-based plants get heavy SPC value from gas-turbine compressor signals (inlet differential pressure, vibration harmonics, exhaust spread), HRSG drum chemistry, steam-turbine vibration, and combustion dynamics. The platform ships with pre-built signal libraries for thermal coal, combined-cycle gas, HRSG, hydropower, and nuclear secondary-side systems. The Nelson Rule engine is the same — what changes is the signal selection and baseline behavior.
What happens to operator decisions when an SPC alert fires?
SPC never trips equipment or moves setpoints autonomously. Every alert is advisory. The response routine — defined during weeks 5–8 of deployment — tells the operator what action to take, who to notify, and how to verify. Common responses include: investigate immediately, log and watch with elevated review frequency, schedule a maintenance work order, escalate to performance engineering, or trigger an inspection during the next planned reduction. The operator retains complete decision authority. SPC just makes sure they're seeing the signal in the first place.
Your Next Forced Outage Has a Signature Forming Right Now. SPC Reads It.
Every power plant has the data sitting in its DCS, SCADA, CEMS, and chemistry feeds. The plants pulling ahead are the ones reading it through control charts and Nelson Rules, not just alarm thresholds. iFactory's turnkey SPC appliance ships in weeks, integrates with your existing systems, and pays back in months. Let's walk through your last 90 days of trips and drift together.