A compression supervisor at a mid-sized oral solid dosage facility outside Bangalore noticed something his team had been writing off for six months. Tablet weights drifted up on the third hour of every shift on the same press, then drifted back inside the next hour. None of the individual readings ever crossed the spec — the team checked. But the X-bar chart showed a textbook ramp pattern, every shift, every day, on Press B and only on Press B. When they finally pulled the feeder frame, the issue was a barely-loose bolt on the force-feeder that flexed under sustained vibration and changed the gravimetric flow rate by a tiny amount. The defect was not the tablet. The defect was the variability that the chart could see and the spec window could not. This is the difference between specification thinking and SPC thinking. Specifications tell you whether a batch passes. SPC tells you whether the process behind the batch is still the process you validated. Predictive SPC implementations have been shown to anticipate 79 of 87 out-of-spec events before they occurred — 92% versus 79% with traditional monitoring. The math is not new. The discipline of using it on every shift, on every CQA, is what separates the plants that get cited from the ones that get praised. Book an SPC walkthrough and we will set up the four charts that matter most for your line.
iFactory Pharma Process Intelligence
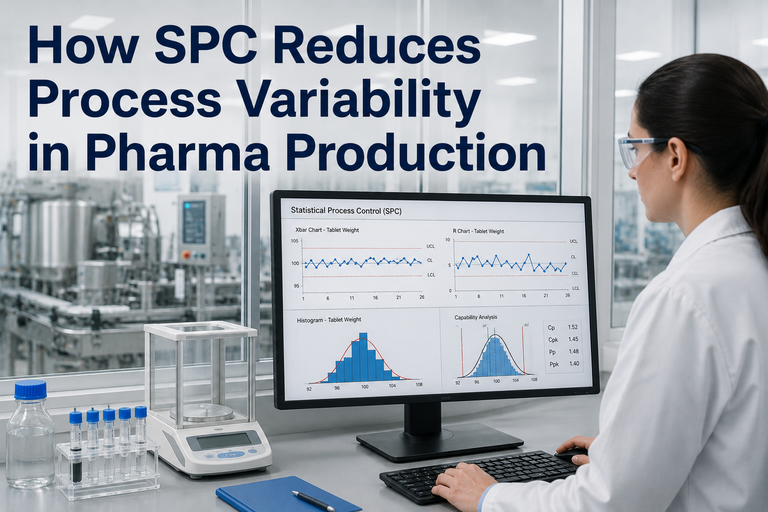
How SPC Reduces Process Variability in Pharma — A Structured Field Guide for Tablet, Capsule, and Packaging Lines
The pharma-specific SPC playbook: common-cause vs special-cause, the eight Western Electric rules, the right control chart for each unit operation, and the structured path from "variation everywhere" to a process you can trend, predict, and defend in front of an auditor.
92%
Predictive SPC OOS detection accuracy
8
Western Electric rules for special-cause detection
3
Sources of variation: process, sampling, testing
CPV
Stage 3 anchor in FDA process validation
Common Cause vs Special Cause — The Distinction That Drives Everything
Every measurement in a pharma process has variation. The job of SPC is not to eliminate it — that is impossible. The job is to separate the variation that lives inside the process design from the variation that comes from something assignable. Reducing variability begins with this distinction, because the actions you take are different for each.
Common Cause
Inherent to the process
Behavior: Random, within control limits, predictable as a distribution
Pharma examples: API micro-variation between drum sublots, blender capacity tolerance, ambient RH within validated range, balance repeatability
What to do: Reducing it requires redesigning the process — tighter equipment, narrower raw-material specs, better blending strategy
Wrong reaction: Adjusting the process every time a point moves. This is tampering. It makes variability worse.
Special Cause
Assignable, removable
Behavior: Non-random pattern, often outside limits or violating run rules
Pharma examples: Wrong API lot loaded, punch wear, balance recalibration drift, new operator, HVAC excursion, feed frame jam
What to do: Investigate, identify, document, eliminate. The cause is findable and removable.
Wrong reaction: Treating it as common cause. This leaves an assignable problem in the process and degrades capability over time.
The Right Control Chart for the Right Pharma Measurement
Pharma SPC fails most often not because the team did not run a chart, but because they ran the wrong one. Continuous measurements need variables charts. Pass/fail counts need attribute charts. Within these families, the subgroup structure dictates the specific chart. Get this right and the rest of SPC works.
X̄–R
X-bar & Range Chart
Subgroups of 2–5 samples, continuous data
Tablet weight at compression (n=10 weighed every 30 min), capsule fill weight, fill volume on parenteral lines
X̄–S
X-bar & Std Dev Chart
Subgroups larger than 10, continuous data
Content uniformity sampling (USP <905> n=30), high-frequency tableting force monitoring
I–MR
Individual & Moving Range
One measurement per time point or per batch
Batch assay results, dissolution Q-values, granulation LOD, environmental room differential pressure
p
p-Chart (Proportion)
Variable sample sizes, proportion defective
Reject rate from automated inspection, percent unbroken ampoules per inspection lot
np
np-Chart (Count)
Fixed sample size, count of defectives
Count of capped/loose closures per 200-bottle sample, count of mis-printed labels per carton lot
c
c-Chart (Defects)
Fixed unit, count of defects (not defectives)
Cracks per blister sheet, particulate counts per 100 mL parenteral, surface flaws per coated tablet
u
u-Chart (Rate)
Variable unit, defects per unit area/volume
Defects per square meter of carton printing, particulates per litre of filled solution, errors per page of batch record
EWMA
EWMA / CUSUM
Small shifts, high-stakes attributes
Stability data trending, slow API potency drift, environmental monitoring time-series with autocorrelation
The Eight Western Electric Rules — Your Daily Signal Detector
A point inside the control limits does not mean the process is in control. Eight pattern-based rules — codified by the Western Electric committee in 1956 and used in every Minitab and Statgraphics package since — detect special-cause variation long before a point goes outside ±3σ. Auditors expect to see these rules applied in CPV trending. Pharma teams that ignore them write OOS investigations that should have been pattern-flag investigations weeks earlier.
Rule 1
Point Beyond 3σ
One point outside the upper or lower control limit. The classical out-of-control signal. Stop, investigate, document.
Rule 2
Run of 9 (Same Side)
Nine consecutive points on the same side of the centerline. A persistent shift — the process mean has moved.
Rule 3
Trend of 6
Six consecutive points all increasing or all decreasing. Classic wear, drift, or environmental-creep signature.
Rule 4
14 Alternating
Fourteen consecutive points alternating up and down. Often a feeder cycle, sampling artifact, or operator overcorrection.
Rule 5
2 of 3 Beyond 2σ
Two of three consecutive points in the outer third (same side). Early warning, often precedes a Rule 1 event.
Rule 6
4 of 5 Beyond 1σ
Four of five consecutive points in the middle third or outer third (same side). Sustained shift signal.
Rule 7
15 Within 1σ
Fifteen consecutive points hugging the centerline. Stratification — subgroups are not random; missing variation.
Rule 8
8 Outside 1σ
Eight consecutive points outside the inner third (either side). Mixture pattern — two distributions are overlapping.
Pattern Reading — What an X-bar Chart Actually Shows
This is what a stable, in-control compression process looks like, followed by what each of the most common special-cause patterns looks like on the same chart. Auditors and quality engineers learn to read these silhouettes the way a clinician reads an ECG.
In Control
Random scatter, all points inside limits, no patterns. Common-cause variation only.
Trend (Rule 3)
Six or more consecutive points climbing. Tool wear, slow contamination, or environmental drift.
Shift (Rule 2)
Process mean moves abruptly and stays moved. New API lot, equipment swap, recalibration.
Cycle (Rule 4)
Alternating high-low pattern. Feeder cycle, sampling alternation, two-source mixing.
Mapping SPC to Every Tablet, Capsule, and Packaging Unit Operation
Pharma SPC is most useful when it is anchored to a specific unit operation with a specific CQA and a specific chart. The table below is the operating map most QA teams converge on after a few years of CPV work. The right chart, on the right characteristic, at the right frequency, on every line.
Unit Operation
Critical Quality Attribute
Recommended Chart
Frequency
Dispensing & weighing
Net weight, RM identity
I–MR
Per dispense
Granulation (wet/dry)
LOD, granule size, blend potency
X̄–R or I–MR
Per batch / hourly
Blending
Content uniformity (sublots), assay
X̄–S
Per blend, 10 sample sites
Compression
Tablet weight, hardness, thickness
X̄–R
Every 30 min, n=10
Capsule filling
Fill weight, fill uniformity
X̄–R
Every 15 min, n=10
Coating
Weight gain %, appearance defects
I–MR + p-chart
Per coating run + per AQL lot
Blister / bottle packaging
Leak rate, cap torque, fill count
p-chart + I–MR
Per AQL inspection
Labeling & serialization
Print defects, code readability
c-chart or u-chart
Per inspection lot
Want this mapped to your specific lines and products? Share your current SPC plan and we will benchmark it against this matrix and your CPV obligations.
The Variability Reduction Workflow — Five Steps, In Order
Variability does not get reduced by buying better software. It gets reduced by walking a structured path. This is the path that converts an SPC chart from a wall decoration into a tool that consistently narrows distribution width on critical characteristics.
Step 1
Stabilize First
Plot the data on the appropriate chart. Apply the eight Western Electric rules. Eliminate every special cause you find. Do not attempt to reduce variability on an out-of-control process — the math will mislead you.
Step 2
Partition the Variance
Decompose total variation into manufacturing, sampling, and testing. Run a method GR&R. If 30% of your "process variation" is actually analytical noise, you are chasing the wrong target.
Step 3
Stratify by Source
Slice the data by shift, operator, equipment, raw material lot, day-of-week. The hidden driver almost always lives in one stratification slice. Box-plot the slices side by side.
Step 4
DOE the Survivors
Once stratification narrows the suspect list, run a small DOE on the surviving variables. Two- or three-factor full factorial is sufficient most of the time. Confirm causality, not correlation.
Step 5
Recompute Capability
After the change is implemented and 25+ batches have been produced, recompute Cp, Cpk, Pp, and Ppk. Verify the variability has actually narrowed. Update control limits if appropriate. Update SOPs and operator training.
Tampering vs Improvement — The Most Expensive SPC Mistake
Tampering is what happens when operators adjust a process every time a point moves, even when the process is in statistical control. Deming demonstrated mathematically that tampering doubles the variance of a stable process. In pharma terms: a well-meaning operator who tweaks the press every time the tablet weight wanders is actively making your batches less consistent. The fix is training, not a new chart.
Tampering
Adjust on every signal, in-control or not
Variance inflates. Distribution widens. Cpk drops. Operators feel productive; the process gets worse.
Improvement
Adjust only on special-cause signals; reduce common-cause via process redesign
Variance shrinks. Distribution narrows. Cpk climbs. Sustainable, defensible, auditor-friendly.
The Regulatory Anchors — Where SPC Is Expected, Not Optional
Three documents make SPC a regulatory expectation in pharma, not a nice-to-have. Auditors will reference at least one of these when reviewing your CPV evidence. Knowing where each anchor points speeds up your inspection prep.
FDA Process Validation Guidance (2011)
Stage 3 — Continued Process Verification
Calls explicitly for ongoing data collection and statistical evaluation to detect undesired variability. Control charts and capability indices are named as appropriate tools.
ICH Q9 — Quality Risk Management
Statistical tools section
Lists control charts and process capability among the statistical possibilities for risk-based decision-making. Reinforces SPC as part of the quality risk toolkit.
ICH Q10 — Pharmaceutical Quality System
Process performance & product quality monitoring
Requires a system to monitor process performance and product quality. SPC is the standard means of demonstrating this monitoring is statistically valid.
21 CFR 211.110
In-process testing & control
Requires control procedures to monitor output and validate process performance. SPC is the operational mechanism most QA systems use to satisfy this requirement.
Common SPC Failure Modes in Pharma — And How to Catch Them
These are the SPC implementation mistakes that show up most often in pharma audits and internal CPV reviews. Each has a structural fix that prevents recurrence.
Wrong chart for the data type
Map data type (continuous vs attribute, subgroup size) to the correct chart. Document the choice in the SPC plan.
Control limits set from spec limits
Control limits come from process variation, not specifications. They describe what the process does, not what it should do.
Running SPC on out-of-control data
Stabilize first, chart second. Remove special causes before computing limits or capability.
Operator tampering on common-cause noise
Train operators on the eight rules. Only act on a flagged signal. Document non-actions.
Ignoring autocorrelation
Pharma time series often autocorrelate (e.g. stability data). Use EWMA or CUSUM where standard Shewhart charts misfire.
No periodic limit refresh
After process improvements, recompute limits on the new state. Stale limits hide real variability shifts.
Frequently Asked Questions
Is SPC mandatory under GMP?
SPC is not named verbatim as mandatory in 21 CFR Part 211, but the requirements for in-process control, process performance monitoring, and Stage 3 Continued Process Verification under FDA's Process Validation guidance are routinely satisfied through SPC. ICH Q9 and Q10 explicitly list control charts and capability analysis as appropriate statistical tools. Auditors expect to see SPC or an equivalent statistical methodology in any modern CPV program.
How does SPC differ from capability analysis?
SPC monitors process stability — is the process behaving consistently over time? Capability analysis quantifies process performance — is the process producing output within specifications, with what margin? The two are sequential: SPC stabilizes the process first, then capability measures how well the stabilized process performs. Running capability analysis on an unstable process produces invalid Cpk and Ppk values.
Should every CQA be on a control chart?
Every critical quality attribute identified in your control strategy should be monitored statistically. Whether each gets its own dedicated chart depends on data frequency and patient risk. High-frequency, high-risk attributes (tablet weight, fill volume) earn live charts. Lower-frequency attributes (dissolution, finished assay) are typically tracked on I–MR charts and trended quarterly through CPV.
Do all eight Western Electric rules need to fire alarms?
No. Most pharma SPC implementations enable Rules 1–4 for active alarms and use Rules 5–8 for periodic CPV review. Enabling all eight at once produces false alarms that desensitize operators. The right configuration is documented in your SPC plan and matched to the risk profile of each CQA.
What software is most common for pharma SPC?
Industry surveys consistently rank Minitab as the most widely used SPC tool in pharma (around 44% of surveyed sites), followed by Statgraphics and integrated LIMS-based statistical modules. Excel remains common for ad-hoc and CPV-stage analyses despite its limitations on advanced rule detection and autocorrelated data. Modern pharma plants increasingly run live SPC integrated with MES and LIMS for continuous data flow.
How do I handle non-normal pharma data?
Many pharma measurements (impurity levels, particulates, deviation counts) are non-normal by nature. Three options: transform the data (Box-Cox or Johnson), use a chart designed for non-normal data (Poisson- or negative-binomial-based attribute charts for counts), or apply Shewhart-style charts to the transformed data. Document the choice and rationale in the SPC plan. Auditors object to assuming normality without verifying it.
Variability Is the Mother of Every OOS Investigation
Set Up the Right SPC on Your Real Lines — In 30 Minutes
Bring your unit operation list, your current CQA-to-chart map, and 30 batches of any attribute that has been giving you trouble. We will walk the Western Electric rules on your real data, identify the special causes hiding in plain sight, and lay out the variability-reduction path.
8
Western Electric rules applied
5
Step variability reduction workflow
4
Regulatory anchors covered
CPV
Stage 3 audit-ready output