Your line reports 95% yield. Your line does not have 95% yield. The number on the board counts reworked units as good ones and buries every re-inspection, quiet fix, and touch-up loop that happens between stations — the "hidden factory" that traditional final-yield reporting was never designed to reveal. The math is brutal: five process steps at a comfortable 95% First Pass Yield each roll up to a true Rolled Throughput Yield of just 77.4%. That gap — nearly a fifth of your throughput — is capacity you are paying for and never shipping. iFactory FPY and RTY tracking captures pass/fail at every step in real time, exposes the stations that quietly drag yield down, and puts the true chain-level number in front of you — on-prem, live in 6 to 12 weeks.
iFactory Quality Analytics
See Your Real First Pass Yield, By Line, Shift, and Product
Track FPY and RTY at every process step in real time, uncover the hidden factory of rework, and pinpoint the stations dragging yield down — running on a single on-prem server.
95%
FPY benchmark for excellent
77.4%
RTY when 5 steps run at 95%
15-25%
revenue lost to poor quality
6-12wk
to go-live, on-prem
Three Numbers. Only One Tells the Truth.
Every plant reports "yield" — but the word covers three very different metrics, and only one of them is honest. Final yield is the number that makes the report look clean. FPY is the number each individual station earns. RTY is the number that reveals what your chain actually delivers, first time, without a hand touching it twice.
The comfortable one
Final Yield
Good units out / units in
Counts reworked units as good output. Looks strong on the dashboard. Hides every rework loop, re-inspection, and quiet touch-up along the way — the reason the hidden factory stays hidden.
The station one
First Pass Yield
Units that pass first try / units in
Measured at a single process step. Excludes rework — a unit only counts if it passed clean on the first attempt. This is the honest number for each station, but it doesn't yet tell you what the chain delivers.
The truthful one
Rolled Throughput Yield
FPY1 x FPY2 x FPY3 x ... x FPYn
The probability that a unit passes every step cleanly, with no rework anywhere. The gap between Final Yield and RTY is roughly the size of your hidden factory — capacity consumed by defects that never appear on the report.
The Hidden Factory Math
Here's why RTY breaks the illusion. A five-step process where each station runs at 95% FPY — every operator, every supervisor, every dashboard looks excellent. Multiply the yields together and the chain-level truth appears: only 77.4% of units flow through untouched. The remaining 22.6% got reworked, re-inspected, or scrapped somewhere along the line. That's the hidden factory, one multiplication away.
x
x
x
x
=
Real RTY
77.4%
chain truth
Where Yield Actually Drops
Low FPY is never a single cause — it is the visible symptom of interacting failures upstream. The stations that quietly bleed yield tend to fail in one of four patterns, and each leaves a different fingerprint in the data.
Process Drift
A parameter — torque, temperature, pressure, feed rate — slides outside spec over a shift as tools wear or ambient conditions shift. Morning runs pass. Afternoon runs fail. Nothing looks broken.
Operator Variance
The same station runs at 98% for one operator and 91% for another. Training gaps and unclear work instructions surface as station-level FPY that swings with the shift roster.
Material Inconsistency
A supplier lot arrives slightly out of tolerance. FPY drops the day the lot enters production and recovers when it clears — a signal invisible without pass/fail data tagged by batch.
Equipment Degradation
A fixture loses calibration, a spindle bearing wears, a sensor drifts. The station keeps running, but defect rate climbs slowly enough that only chain-level RTY makes it visible.
Want to see which of these patterns is dragging your line's RTY down right now? Book a demo and we'll walk your yield chain step by step.
What Live FPY Tracking Actually Shows
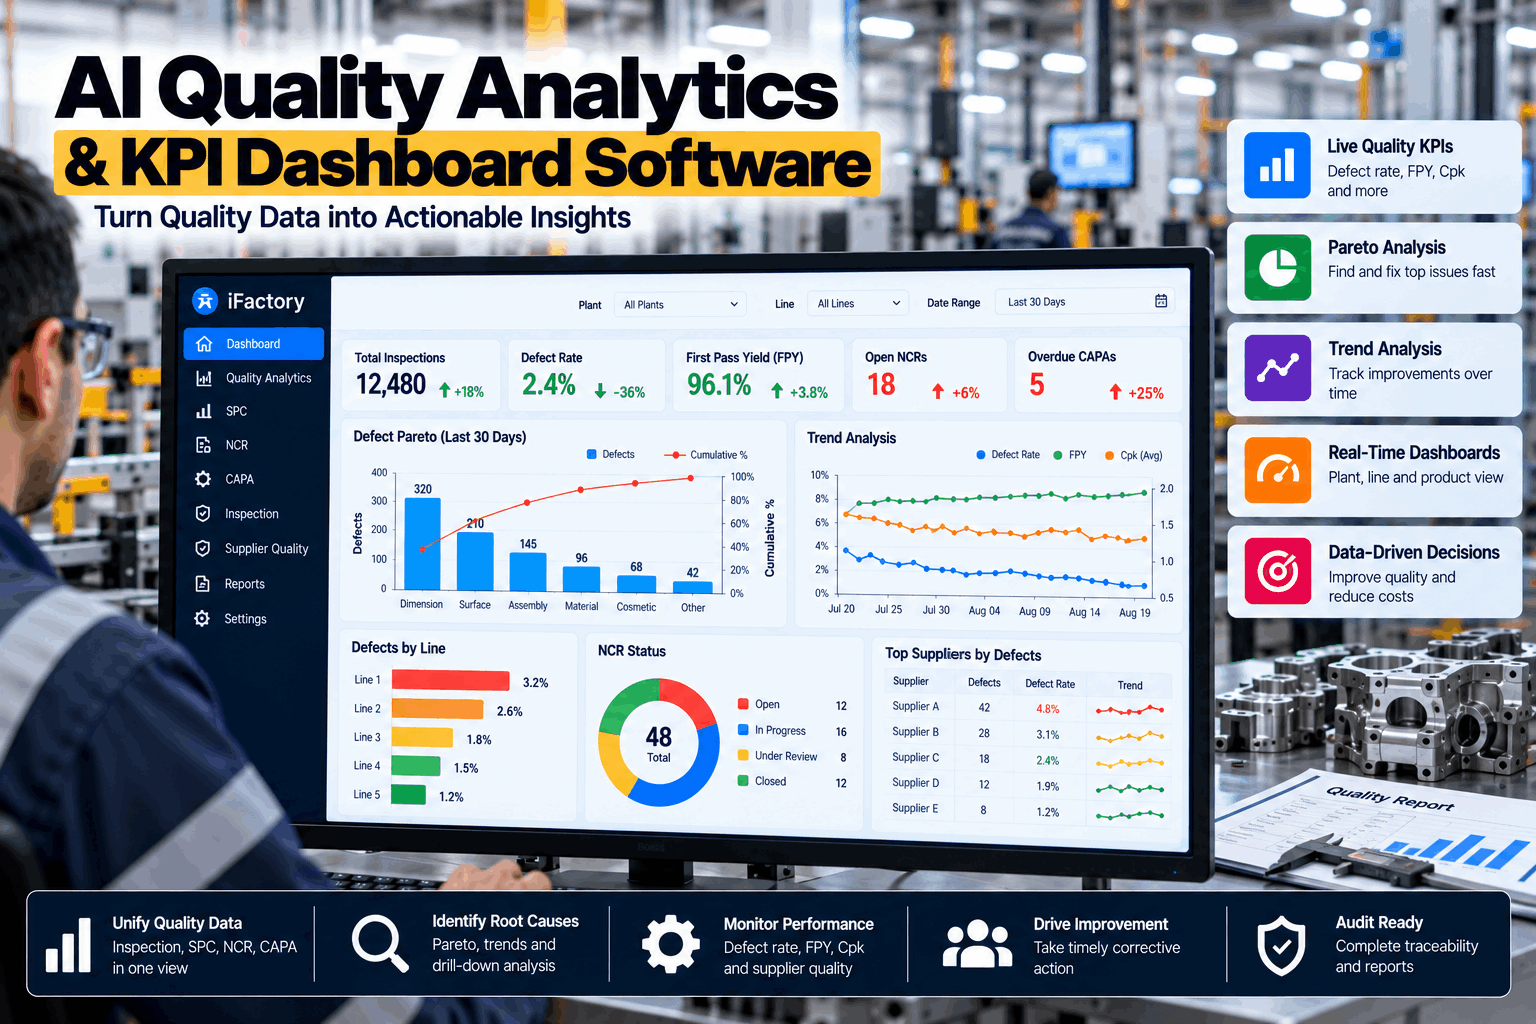
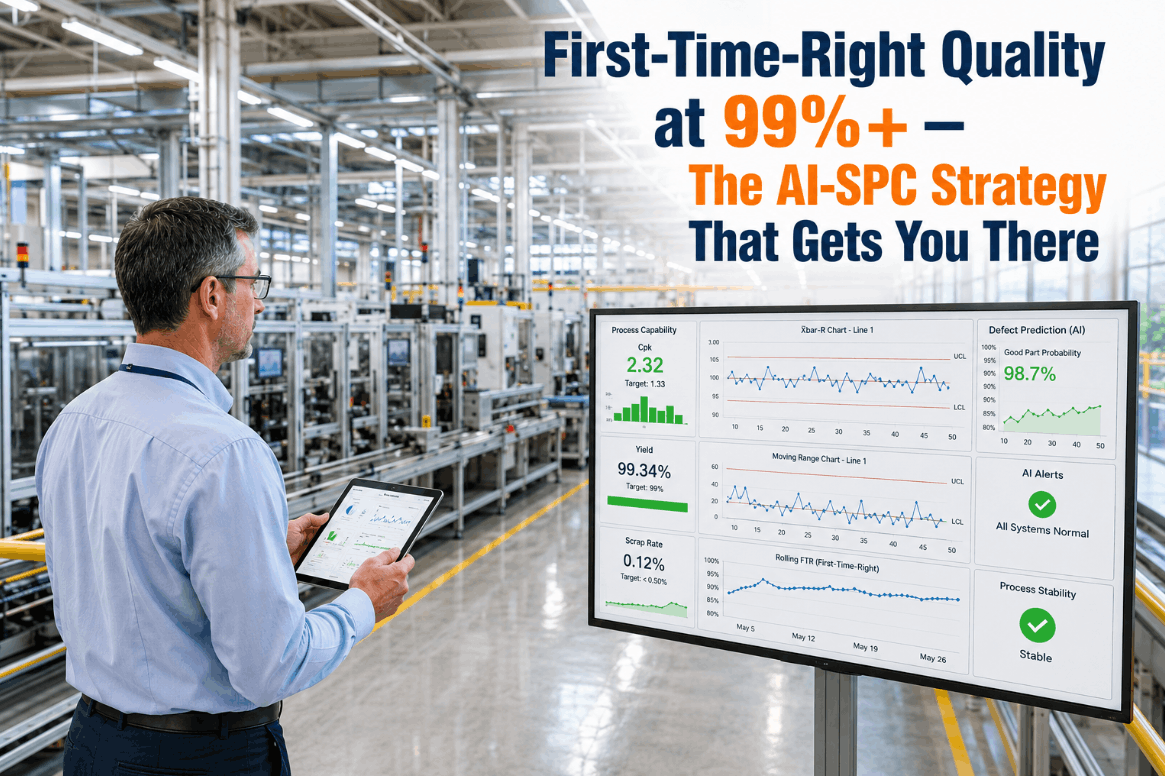
iFactory captures pass/fail automatically at every process step — including the rework that plants usually fix quietly and never log. The result is a live yield picture broken down by line, shift, product, and station, with the drops flagged the moment they appear instead of surfacing in a monthly report.
FPY by Station, Live
Every station's first-pass rate updated in real time, so a drift from 97% to 92% surfaces in hours, not at end of month.
True RTY, Chain-Level
The multiplied chain yield calculated automatically — the honest number that final yield reports were never designed to show.
Slice by Line, Shift, Product
Yield broken down by every dimension that matters, so operator, batch, and product-mix effects become obvious rather than hypothetical.
Rework Captured, Not Hidden
Quiet rework loops that never get logged in ERP are captured at the source — the dark data that made your hidden factory hidden.
From Yield Drop to Root Cause
Seeing the drop is half the value. Closing the loop is the other half. iFactory moves you from "FPY on Station 3 fell to 89% this shift" to a specific, actionable cause — so the fix lands before the next shift compounds the loss.
1
Detect the Drop
Station FPY slides below its baseline — a warning fires on the board the moment the trend crosses threshold, not after shift-end.
2
Slice the Data
Automatic breakdown by shift, operator, material lot, and product tells you whether the drop is a person, a batch, a machine, or a mix.
3
Pinpoint the Cause
Correlation across process parameters — torque, temperature, cycle time — surfaces the specific variable that shifted with the yield.
4
Confirm Recovery
Live FPY confirms the fix worked — yield returns to baseline and RTY climbs back, verified rather than assumed.
The Cost You Are Already Paying
The reason FPY matters is money. Total cost of poor quality — scrap, rework, warranty, inspection labor — commonly runs 15 to 25% of annual revenue in manufacturing, most of it buried in overhead where it never shows up as a line item. Every point of RTY you recover translates directly to margin.
15-25%
of revenue
typical range for total cost of poor quality in manufacturing
Hidden
in overhead
rework labor spread across all units, invisible in the P&L
Dark
unlogged rework
quiet fixes at the station that never reach ERP or the quality system
99.99966%
Six Sigma target
the FPY equivalent of 3.4 defects per million opportunities
Why AI Beats the Spreadsheet
Most plants still track FPY in a workbook filled in at shift end — a snapshot, late, incomplete, and dependent on whoever remembered to log the rework. Continuous, automated pass/fail capture is a different discipline: it turns yield from a monthly report into a live control.
Spreadsheet FPY
A Filed Report
Logged at shift end from memory and paper tally
Quiet rework fixes never make it into the numbers
Slicing by operator or lot means rebuilding the file
Drops surface days after the cause is gone
iFactory AI FPY tracking
A Live Signal
Pass/fail captured automatically at every step
Rework logged at the source — no more dark data
Slice by line, shift, product, operator in one click
Drops flagged the shift they happen, not the month after
On-Prem AI, Live in 6 to 12 Weeks
Quality data, defect codes, and yield history are core operational IP. The iFactory AI runs on a pre-configured edge server on-premise, with all processing inside your firewall and no external egress required to operate. It ships racked and ready with the software pre-loaded — and a structured deployment puts it live on your line in a single quarter.
1
Rack the edge server
A pre-configured edge AI server slots into your plant, shipped pre-validated with the FPY and RTY software pre-loaded.
2
Connect station data
Read-only links to inspection points, station PLCs, and quality gates let the AI learn each step's true baseline yield.
3
Yield board goes live
FPY, RTY, and root-cause breakdowns run on-prem inside your firewall — your quality data never leaves the building.
What Live Yield Tracking Delivers
Capturing FPY continuously converts directly into less scrap, less rework, and margin recovered from the hidden factory. These reflect outcomes manufacturers report after moving from spreadsheet tracking to continuous, step-level FPY and RTY measurement.
3-8pt
RTY recovery
chain-level yield gain typical within the first two quarters
Live
Drop detection
FPY drops surfaced in-shift, before the next batch compounds them
Less
Scrap and rework
defects prevented at the station instead of caught downstream
98%+
World-class target
the FPY band world-class discrete manufacturers hold, kept in view
Curious what your true RTY looks like once rework is captured? Talk to our quality team and benchmark your line against live FPY tracking.
Frequently Asked Questions
What's the difference between FPY and Rolled Throughput Yield?
FPY measures a single process step — the percentage of units that pass that station the first time, with no rework. RTY measures the whole chain — the probability a unit passes every step cleanly, calculated by multiplying each station's FPY together. Five stations at 95% FPY look excellent individually, but the RTY is only 77.4%. RTY is the number that exposes the hidden factory.
Why does final yield look higher than our real yield?
Final yield divides good units out by units in — and it counts reworked units as good output. That means every quiet touch-up and re-inspection loop gets absorbed into the number, making the report look clean. FPY and RTY exclude rework by design, which is why the gap between final yield and RTY is roughly the size of your hidden factory — capacity consumed by defects that final yield was never designed to reveal.
What's a good FPY benchmark for our industry?
General benchmarks put 95 to 99% in the "excellent" band and 85 to 95% in "good." Pharmaceutical and semiconductor targets sit at 99%+; consumer electronics and PCB producers aim for 95 to 97%; complex aerospace assemblies may class 96% as world-class. The right target depends on product complexity and customer requirements — the more useful discipline is benchmarking against your own historical performance and closing the gap between your final yield and your RTY.
Can we track FPY properly in a spreadsheet?
You can log it, but the picture will be incomplete. Spreadsheets rely on shift-end memory and paper tallies, which means quiet rework fixes rarely get recorded — the dark data that keeps your hidden factory hidden. Automated pass/fail capture at every step records first-pass results and rework at the source, which is what makes RTY real rather than theoretical, and what lets you slice yield by shift, operator, lot, and product in seconds.
Does our quality data leave the plant, and how long to deploy?
No data leaves. The AI runs on a pre-configured edge server on-premise, with all processing inside your firewall and no external egress, and the integration is read-only. The server ships racked and ready with software pre-loaded, and a structured deployment puts the live FPY and RTY board on your line in 6 to 12 weeks. The fastest way to see fit is a demo on your own process steps — book one and bring your station list and current yield report.
Find the Yield You Are Already Losing.
See Your Real FPY and RTY, Step by Step
Bring your station list and current yield report. We'll show live FPY at every step, the true RTY your chain delivers, and the exact stations dragging yield down — all on an on-prem server, live in 6 to 12 weeks.
Rework
captured, not hidden