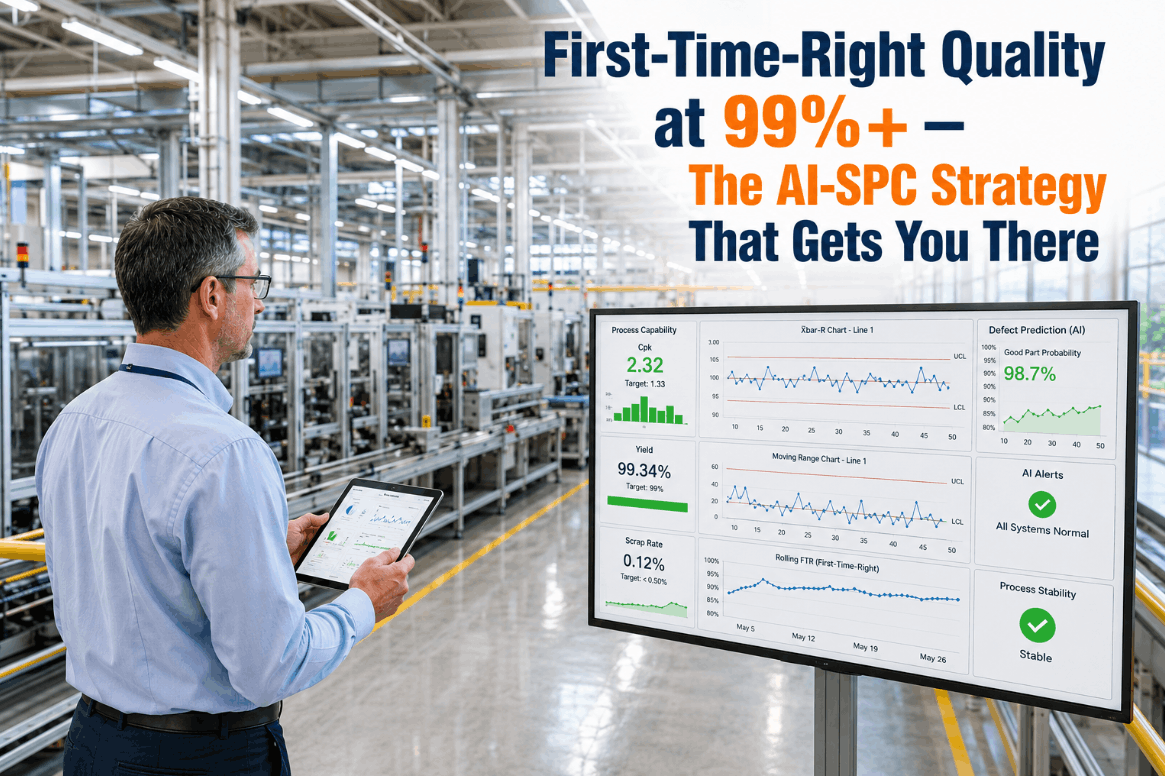
First-Time-Right Quality at 99%+ — The AI-SPC Strategy That Gets You There
By Henry Green on June 5, 2026
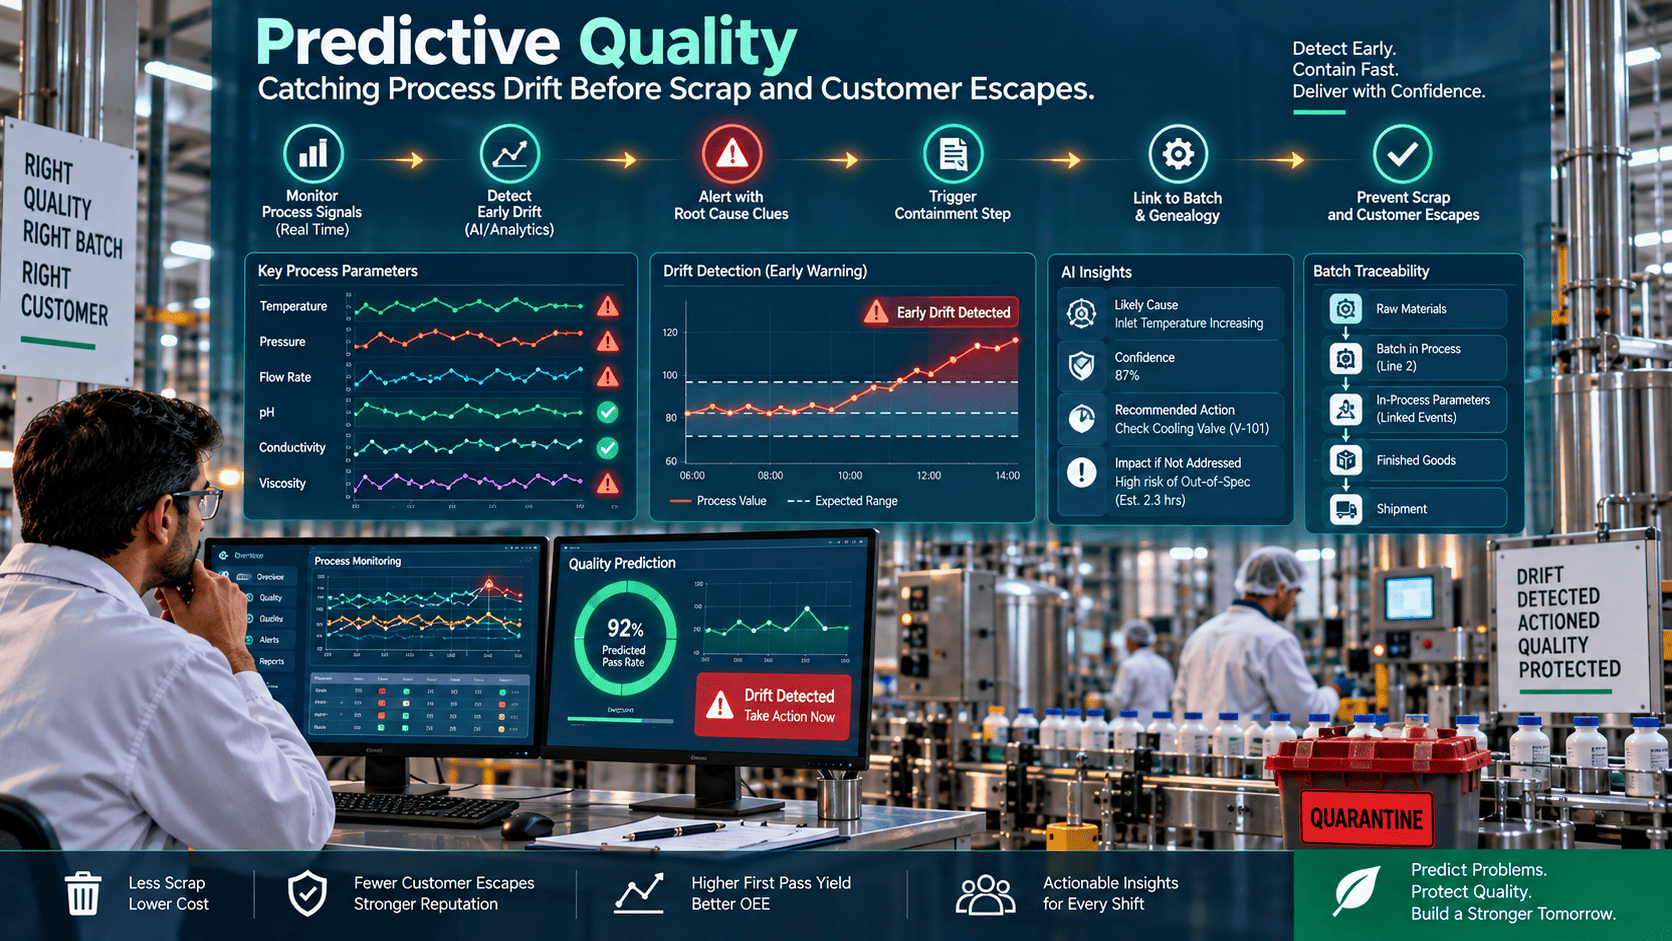
End-of-line inspection doesn't prevent defects—it just finds them after you've already paid to make them. For VP Quality leaders in U.S. manufacturing, the shift to First-Time-Right (FTR) quality isn't a vision statement; it's an operational imperative backed by measurable cost reduction, scrap elimination, and warranty avoidance. Achieving 99%+ FTR requires a closed-loop system that catches process drift before the part is finished—not after it reaches the CMM or, worse, the customer. iFactory's Live SPC combined with AI Vision, sensor fusion, and Copilot CAPA delivers exactly that: a real-time quality intelligence layer that converts reactive inspection into predictive, in-process quality control. To see how iFactory closes the FTR gap in your plant, Book a Demo with our quality engineering team today.
IN-PROCESS QUALITY INTELLIGENCE
Still Finding Defects at Final Inspection? That's Already Too Late.
iFactory's Live SPC + AI Vision closes the FTR gap by catching process drift in real time—before the nonconformance becomes a scrap event, a rework cost, or a warranty claim.
68%of scrap costs in discrete manufacturing are generated by defects not caught in-process
$1.8MAverage annual rework and scrap cost in a mid-size U.S. precision parts facility
12×Cost multiplier from in-process defect to customer warranty claim (ITT Cost of Quality)
99.2%FTR rates achievable with closed-loop AI-SPC on critical process parameters
Why Your Current Inspection Model Is a Cost Recovery Strategy, Not a Quality Strategy
The Fundamental Flaw in End-of-Line Quality Control
Every quality organization running end-of-line inspection is operating a sophisticated cost-discovery process, not a defect-prevention process. By the time a CMM flags an out-of-tolerance bore or a functional tester catches a failed assembly, the labor, material, energy, and machine time are already consumed. In a high-volume discrete manufacturing environment—automotive, aerospace, industrial equipment—this inspection model systematically delays corrective action by hours or shifts, allowing the same root cause to generate hundreds of nonconforming units before anyone acts.
First-Time-Right quality reframes the entire strategy: the goal is not to detect defects faster at the end, but to eliminate the conditions that generate defects at all. That requires process-level intelligence—specifically, the ability to monitor Statistical Process Control signals, sensor fusion data, and vision-based dimensional checks simultaneously, in real time, at the machine level. iFactory's platform was built for exactly this architecture. Book a Demo to see how it maps to your production environment.
The 5 Root Causes of Low FTR Rates in U.S. Manufacturing Plants
Diagnosing the Quality Gap Before the Next Scrap Event
01
SPC Running on Sampling, Not Continuous Data
Traditional SPC relies on periodic sample pulls—every 10th part, every 30 minutes. Process drift that occurs between samples goes undetected until a control chart signals out of control, often after the damage is done. iFactory's Live SPC ingests 100% of part data from sensors, gauges, and vision systems, delivering control signals on every unit rather than on a statistical proxy of production.
02
No Correlation Between Process Parameters and Quality Outcomes
Most quality systems record what failed but not why the process drifted to produce the failure. Without correlating upstream process variables—spindle load, coolant temperature, tool wear index—to downstream dimensional outcomes, CAPA becomes guesswork. iFactory's sensor fusion layer maps these correlations automatically, surfacing the leading indicators that predict a nonconformance before it occurs.
03
Manual Visual Inspection at Scale
Human visual inspection introduces a known detection inconsistency of 15–25% on surface and cosmetic defects, even with well-trained inspectors. At production speeds exceeding 200 units per hour, this inconsistency becomes structurally embedded in your FTR rate. iFactory's AI Vision module deploys trained defect-detection models on your existing camera infrastructure, achieving consistent detection at line speed without slowing throughput.
04
CAPA That Lives in a Document, Not in the Process
Most CAPA systems are documentation workflows—they record that a corrective action was assigned, not that it actually changed the process. iFactory's Copilot CAPA closes this loop by verifying, through real-time data, whether the corrective action resolved the process variation that caused the defect. If the signal recurs, the system escalates automatically rather than waiting for the next audit cycle.
05
FTR Metrics Calculated Weekly, Not in Real Time
If your FTR rate is calculated from MES or ERP data on a weekly or monthly reporting cycle, you are managing a lagging indicator. By the time a 94% FTR rate appears on a dashboard, the shift or cell that produced it has moved on. iFactory tracks FTR by cell, by shift, by part number, and by operator in real time—enabling proactive intervention rather than retrospective analysis.
The Closed-Loop FTR Architecture: How iFactory Builds the System
Four Layers That Convert Reactive Quality Into Predictive Prevention
Achieving consistent 99%+ FTR is not a single-point solution—it is an architectural outcome that requires four integrated layers working in sequence. Platforms that address only one layer (inspection only, or SPC only) capture a fraction of the available quality improvement. iFactory's platform is designed as a closed loop: each layer feeds the next, and the system continuously improves as production data accumulates.
Layer 1
Live SPC on 100% of Production
Continuous control charting on every unit using sensor data, in-gauge measurement, and CMM feedback. Western Electric rules and AI-enhanced pattern detection trigger alerts before Cpk drops below 1.33.
Layer 2
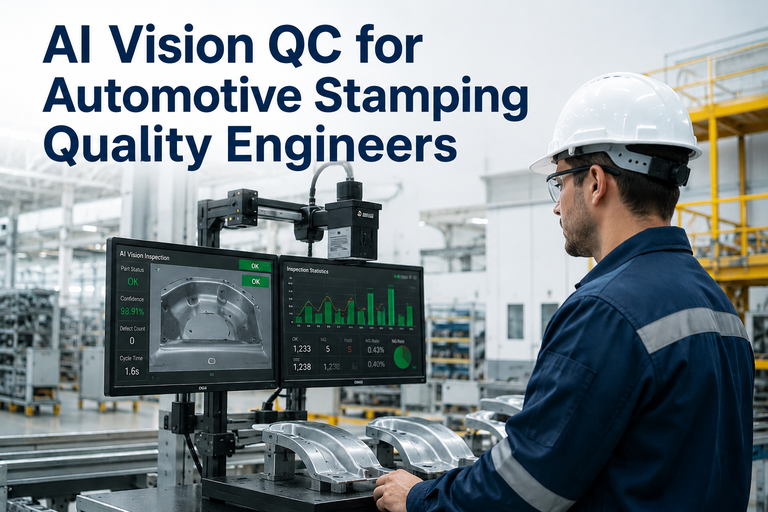
AI Vision for Surface & Dimensional Inspection
Deep learning models trained on your part families detect surface defects, dimensional deviations, and assembly errors at line speed. Consistent, operator-independent detection with full traceability to unit serial number.
Layer 3
Sensor Fusion for Process Correlation
Multi-variate correlation engine maps upstream process variables (tooling, temperature, vibration, feed rates) to downstream quality outcomes. Identifies the leading indicators that predict a defect 3–8 process steps before it manifests.
Layer 4
Copilot CAPA with Verified Closure
AI-guided CAPA that auto-generates root cause hypotheses from process data, assigns corrective actions, and verifies closure through live process monitoring—not paperwork. The loop is only closed when the data confirms it.
FTR Cost of Quality: What Your Defect Rate Is Actually Costing
The Financial Case for Moving From Inspection to Prevention
Quality professionals know the Cost of Quality (CoQ) framework, but the internal cost multipliers are often underestimated in standard CoQ analyses. The table below models the annualized cost exposure for a mid-volume discrete manufacturer at different FTR rates—and the recoverable value that moves to profit when FTR improves.
FTR Rate
Scrap & Rework Cost
Inspection Labor Cost
Warranty & Field Cost
Annualized CoQ
92% (Baseline)
$940K – $1.3M
$280K – $420K
$310K – $580K
$1.5M – $2.3M
95% (Improved)
$510K – $740K
$200K – $310K
$180K – $320K
$890K – $1.37M
97% (Advanced)
$240K – $380K
$140K – $210K
$90K – $160K
$470K – $750K
99%+ (AI-SPC Target)
$60K – $120K
$80K – $130K
$30K – $65K
$170K – $315K
The delta between a 92% FTR baseline and a 99%+ AI-SPC outcome represents $1.2M–$2.0M in recoverable annual cost for a typical mid-volume plant. The investment in a closed-loop FTR platform pays back within the first year in most deployments. Book a Demo to model the specific CoQ recovery for your facility.
The 5-Step Roadmap to 99%+ FTR
Step 01
Establish Your FTR Baseline by Cell and Part Number
Before any technology deployment, calculate actual FTR at the cell level—not plant average. Most VP Quality teams discover that 20% of their part numbers or cells generate 80% of their scrap and rework costs. Prioritize those first.
Step 02
Deploy Live SPC on Critical-to-Quality Parameters
Identify the 3–5 process parameters most correlated with your top defect modes. iFactory connects to your existing sensors and gauges to run continuous SPC on these parameters, generating control signals in real time rather than on the next sampling interval.
Step 03
Integrate AI Vision at High-Escape-Risk Inspection Points
Replace manual visual inspection at your highest-escape-risk stations with iFactory AI Vision. Trained models run inference on every unit at line speed, logging results to a centralized quality record with part traceability and defect imaging.
Step 04
Enable Sensor Fusion to Identify Predictive Leading Indicators
Connect iFactory's sensor fusion engine to your upstream process data. Over 2–4 weeks, the AI builds correlation models between process variables and quality outcomes—surfacing the leading indicators that allow quality engineers to intervene before defect conditions materialize.
Step 05
Close the Loop with Copilot CAPA and Verified Closure
Activate Copilot CAPA on your highest-frequency defect types. The system auto-generates corrective action recommendations, tracks implementation, and verifies through live process data that the root cause has been resolved. Book a Demo to walk through this roadmap for your facility.
FTR vs. Traditional Quality Models: A Direct Comparison
Understanding the Structural Difference in Quality Architecture
Traditional Inspection Model
Defects found after production is complete
SPC on sampling intervals (10th part, 30 min)
Human visual inspection with 15–25% escape rate
CAPA as documentation workflow only
FTR reported weekly from ERP/MES lag data
No process-to-quality correlation
iFactory Closed-Loop FTR
Process drift caught before the unit is finished
Live SPC on 100% of production, every unit
AI Vision at line speed with consistent detection
Copilot CAPA with data-verified closure
Real-time FTR by cell, shift, and part number
Predictive leading indicators via sensor fusion
"We were running 93% FTR on our high-volume precision components line—which we thought was acceptable until we modeled what the remaining 7% was actually costing us annually. After deploying iFactory's Live SPC and AI Vision on our three highest-scrap cells, we reached 98.6% FTR within five months. The Copilot CAPA system is what made the difference: it doesn't just tell you what failed, it tells you what process changed to cause the failure and confirms when you've actually fixed it."
VP QualityPrecision Components Manufacturer, Midwest U.S.
Conclusion: First-Time-Right Is a System, Not a Goal
For VP Quality leaders under pressure to reduce scrap, eliminate rework, and protect customer quality commitments, the path to 99%+ FTR requires more than better inspection—it requires a fundamentally different architecture. The closed-loop model that iFactory delivers—Live SPC on every unit, AI Vision at line speed, sensor fusion for predictive correlation, and Copilot CAPA with verified closure—converts quality management from a cost-detection function into a cost-prevention function. The financial and operational case is clear: the recoverable value of moving from a 92% to 99%+ FTR rate exceeds the platform investment in the majority of deployments within the first year. The next scrap event on your highest-cost cell is the last argument you need to act. Book a Demo with iFactory's quality engineering team and start with a targeted FTR audit of your top three defect-generating cells.
Frequently Asked Questions
What is First-Time-Right (FTR) quality and how is it measured?
FTR is the percentage of units that pass all quality requirements on the first production attempt, without rework or reinspection. It is calculated as (Units Produced − Rework − Scrap) ÷ Units Produced, and should be tracked at the cell level in real time, not as a plant-wide lagging average.
How does Live SPC differ from traditional SPC in a manufacturing context?
Traditional SPC uses sample-based data collected at intervals; Live SPC ingests 100% of production data from sensors and gauges continuously, generating control signals on every unit and catching process drift far earlier than sampling-based systems allow.
Can iFactory integrate with our existing quality management system or MES?
Yes. iFactory integrates with major MES, ERP, and QMS platforms through standard APIs and OPC-UA connections, augmenting your existing systems with real-time SPC and AI-driven quality intelligence rather than replacing them.
How long does it take to train an AI Vision model on our specific parts?
Most AI Vision models are production-ready within 2–4 weeks of image data collection, depending on part complexity and defect variety. iFactory's model training pipeline accelerates this with transfer learning from a broad manufacturing defect library.
What is Copilot CAPA and how does it differ from our current CAPA workflow?
Copilot CAPA uses process data to auto-generate root cause hypotheses and recommended corrective actions, and then verifies closure through live monitoring—eliminating the gap between a CAPA being "documented as closed" and the process actually being corrected.
RECOVER YOUR QUALITY MARGINS
Get a Real-Time FTR Audit for Your Highest-Scrap Cells
Our quality engineering team will benchmark your current FTR by cell, map your top three defect-generating process parameters, and deliver a structured ROI analysis showing exactly how much scrap and rework cost is recoverable with closed-loop AI-SPC.