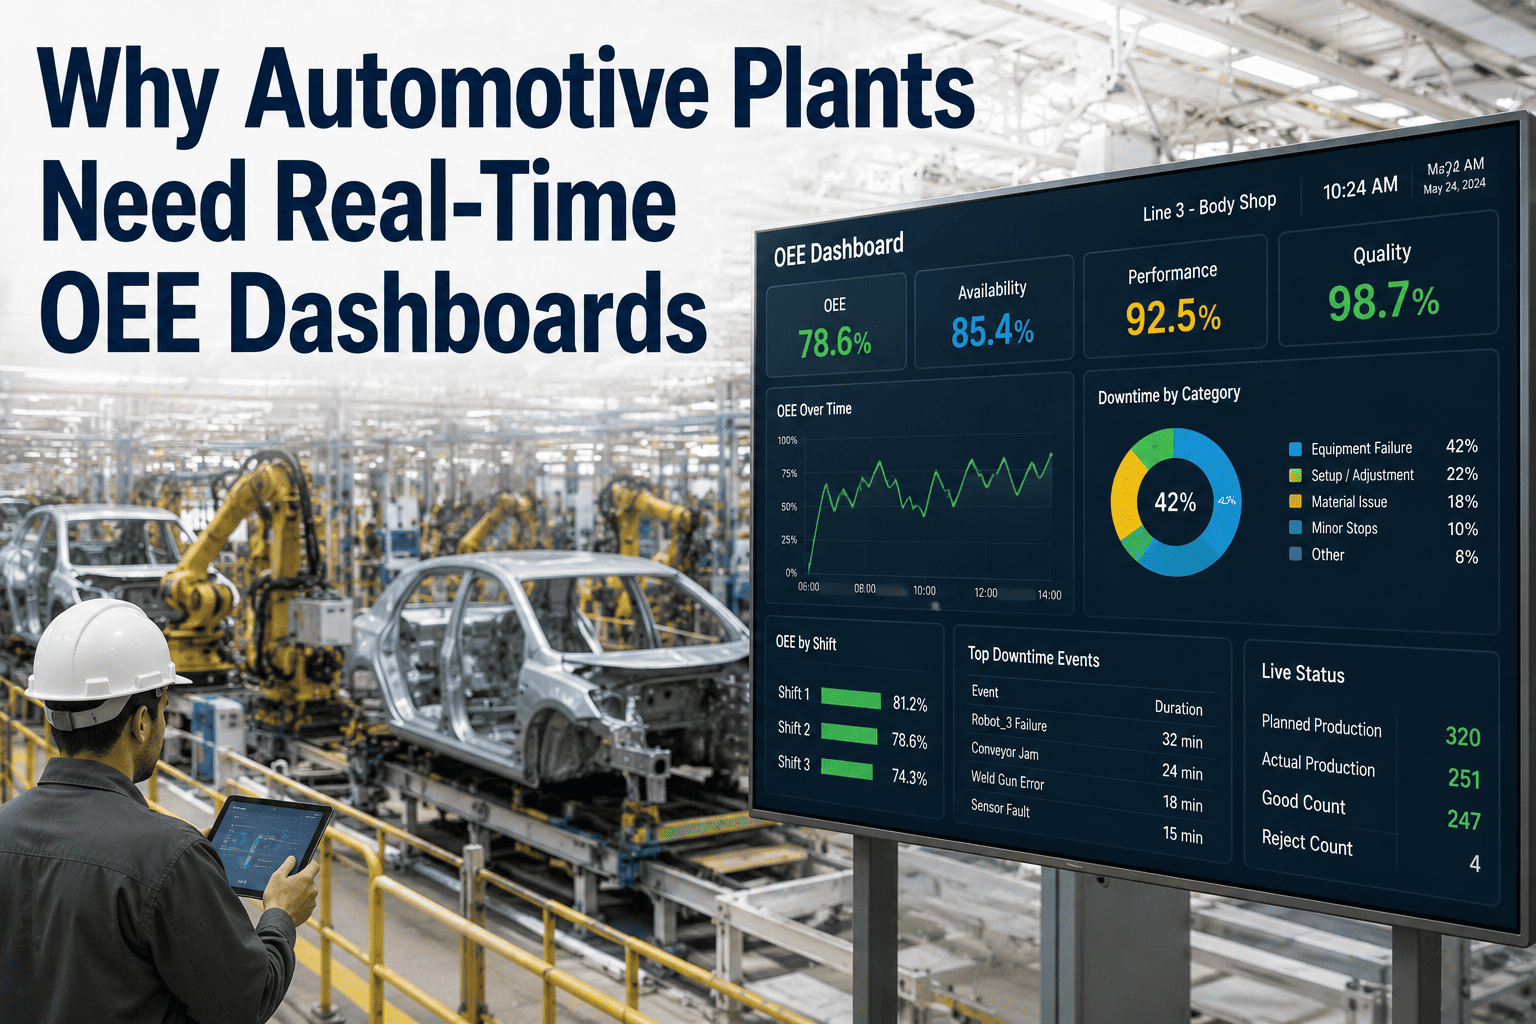
Every offshore platform knows what it produced yesterday. Far fewer can say, hour by hour, what it could have produced, where the difference went and which fix would return the most barrels. That gap is deferment, and on most assets it is rebuilt each morning from a spreadsheet, a shift log and memory. iFactory's OEE Analytics Suite calculates production availability, unit performance and quality against the platform's potential in real time, assigns every lost barrel to a cause, and ranks those causes so reliability spend goes where it recovers most. To see it on your own production data, book a platform review.
Real-Time OEE for Offshore Platforms: Every Deferred Barrel With a Cause Against It
iFactory reads the historian, metering and trip logs, compares actual production with potential every hour, and splits the shortfall into availability, performance and quality losses — by well, by system and by cause. The result is a deferment record nobody has to assemble by hand.
- Actual against potential, hour by hour
- Deferment coded to wells, plant and export
- Causes ranked by barrels and value
OEE Offshore Is Production Efficiency Under Another Name
Manufacturing measures OEE; upstream measures production efficiency — actual production divided by what the asset could have produced. They are the same idea. Regulators such as the North Sea Transition Authority assess it with a four-choke model: the potential of the wells, the plant, the export route and the market, with the smallest setting the limit. OEE adds a second cut through the same losses: was the system down, was it running below rate, or did the product fail to reach sales? Used together they say where a barrel was lost and what kind of loss it was. Our upstream specialists can map both to the way your asset reports today.
One Month on One Platform: Where 312,000 Barrels Went
Take an illustrative platform with a potential of 50,000 boe a day. Over a 30-day month that is 1.5 million boe. Three trips cost 43.2 hours, so availability is 94.0%. While on line the platform runs at 86.0% of potential, held back by a derated export compressor, four wells waiting for intervention and a shortage of lift gas. Of what is produced, 98.0% reaches sales; the rest is flared on restart or recycled as off-spec. OEE is 79.2%, and 311,652 boe are deferred — about $20 million at an illustrative $65 a barrel. The daily report shows the total. The value is in the split. To build this picture from your own data, book a deferment session.
How this compares: 71% of deferment in this example arises in the plant, close to the 73% the NSTA reported for the UK basin in 2025, where turnarounds and gas processing equipment were the main contributors. Wells are the second source. At the end of 2025 the UKCS had 558 shut-in wells out of 2,298, and bringing 56 of them back added 16 million boe in the year.
See One Platform's Deferment Coded in Six Weeks
Choose one asset. We connect its historian, metering and trip logs, agree the potential with your production engineers, replay three months of history and switch on the hourly calculation — so the next morning meeting starts with causes, not totals.
Getting the Potential Right
An efficiency figure is only as honest as its denominator. The NSTA's guidance distinguishes structural potential — the lowest of the four chokes — from economic potential, which is what the operator could achieve with interventions, repairs and maintenance that pay for themselves. Set the potential too low and the platform looks excellent while barrels stay in the ground. Our production engineers can review how potential is set on your asset.
Well potential
Taken from the latest valid well test for each well, including wells that are shut in but could flow. A shut-in well is a loss, not a zero.
Plant capacity
What separation, compression, water handling and power can process with all equipment in service — not what is running this week.
Export and market
Pipeline, tanker and terminal limits, and nominations. These are real constraints, and they are reported separately so they do not hide plant losses.
Revised on a schedule
Potential changes with reservoir decline, new wells and modifications. Each revision is dated and approved, so a step in efficiency can be told from a step in the denominator.
Deferment Coding: Every Barrel Gets a Cause
The calculation is the easy part. The discipline is in attribution: within a day of a shortfall, someone who knows the platform agrees what caused it. iFactory proposes the attribution from the data — a compressor trip at 03:40 and a fall in export gas a minute later belong together — and the production engineer confirms or corrects it. To see the coding structure against your own loss categories, book a coding workshop.
ISO 20815, reissued in June 2026, sets out production assurance as a managed activity across the life of an asset, and ISO 14224 gives the equipment boundaries and failure coding used for reliability data. Coding deferment to the same equipment classes means the production loss record and the maintenance record describe the same events.
From Deferment to a Ranked Reliability Budget
Reliability budgets offshore are constrained by more than money. Bed space, vessel availability, weather windows and the next planned shutdown decide what can be done and when. Ranking causes by the barrels they cost each month, and noting what each fix needs, turns a list of complaints into a plan. One caution: deferred production is mostly produced later, not lost for good, so the value is in timing and in the share that never returns — flared gas, and barrels pushed beyond the end of field life. Our reliability team can help value your own causes on that basis.
What the AI Adds Offshore
A platform produces more data than its small crew can read, and the onshore team sees it late. iFactory's models run on a GPU server at the asset or in the onshore operations centre, so they keep working when the link to shore is slow, and they do the first pass of the attribution that otherwise waits for the morning meeting.
- Proposes the cause. A shortfall is matched to the trips, restrictions and well events that coincide with it, for an engineer to confirm.
- Finds repeats. The same machine, the same trip initiator, the same conditions — grouped as one problem, with its total in barrels.
- Warns early. Machines drifting from their normal behaviour are flagged before the trip that would become next month's largest cause.
- Answers in plain language. Offshore and onshore staff ask about today's shortfall and get the split and the evidence.
Daily Report, Production Accounting and Real-Time OEE Compared
Most assets already have two of these. The daily report is fast and unstructured; production accounting is accurate and late. Real-time OEE sits between them and feeds both.
Delivered as a Turnkey AI System — Hardware and Software Together
iFactory ships as a complete bundle: a pre-configured NVIDIA AI server, racked and ready, with the OEE Analytics Suite and AI models pre-loaded. Rack it, plug in power and Ethernet, and the AI is live on your network — production data stays on your own infrastructure, in the platform equipment room or the onshore operations centre. Our team handles cabling, network setup, read-only connections to your DCS, PLC, SCADA and historian, links to metering and production accounting, operator training and 24×7 remote monitoring. For a scoped proposal, book a deployment call.
Ship, network and data
Server delivered and racked. Historian, metering and trip logs connected. Potential agreed per well and system. Three months of history loaded.
Model training and pilot
Models trained on the asset's own history. Hourly OEE and proposed deferment coding run alongside the daily report and are reconciled with accounting.
Go-live and training
Dashboards live offshore and onshore. Production, maintenance and reliability teams trained. Cause ranking handed over to the asset's planning cycle.
Frequently Asked Questions
How is OEE defined for an offshore platform?
As availability times performance times quality, measured against the platform's production potential. Availability is time on line, performance is rate against potential while on line, and quality is the share of production that reaches sales. With potential set the same way, the result matches production efficiency.
What is deferment?
The difference between what an asset could have produced and what it did. It is called deferment because most of the hydrocarbons remain in the reservoir to be produced later. It is still a cost: revenue arrives later, flared gas is gone, and barrels pushed past the end of field life are never recovered.
What is a good production efficiency?
The UK regulator's target for its basin is 80%, and the 2025 average there was 76%. Individual assets vary widely with age and design. McKinsey has reported a typical figure near 77% and a mature North Sea platform reaching 95% in a pilot. Your own trend matters more than any average.
Who sets the production potential?
Your production and reservoir engineers. iFactory holds the agreed potential for each well and system, applies it hour by hour, and records every revision with its date and approver. It does not decide the figure.
Does this replace our production accounting system?
No. Production accounting remains the record for allocation, sales and reporting. Real-time OEE gives an early, structured view of the same production, and is reconciled with the accounting figures once they are final.
Does it work with limited connectivity offshore?
The models run on a server on your own network, at the asset or onshore, so the calculation does not depend on a link to an outside cloud. Where the server sits is decided with your team during scoping, taking space, power and communications into account.
How long does deployment take, and what do we need to provide?
A typical asset is live in 6–12 weeks. You provide rack space, power, an Ethernet connection, read access to the historian, metering and trip logs, current well tests and potential, and a production engineer for the pilot. iFactory supplies the pre-configured NVIDIA AI server, software, integration and training. To scope your asset, contact our project team.
Know Where Every Barrel Went, the Same Day
One turnkey system — NVIDIA AI server, OEE Analytics Suite, integration and training — delivered and live inside 12 weeks. Start with the asset whose deferment is hardest to explain.
- 1What was our potential yesterday, and what did we make?
- 2How much was downtime, how much was rate?
- 3Which choke: wells, plant, export or market?
- 4Which cause has cost the most this month?
- 5Which fix returns the most barrels soonest?