Why Food and Beverage Plants Need Real-Time OEE Dashboards
By David Cook on June 1, 2026
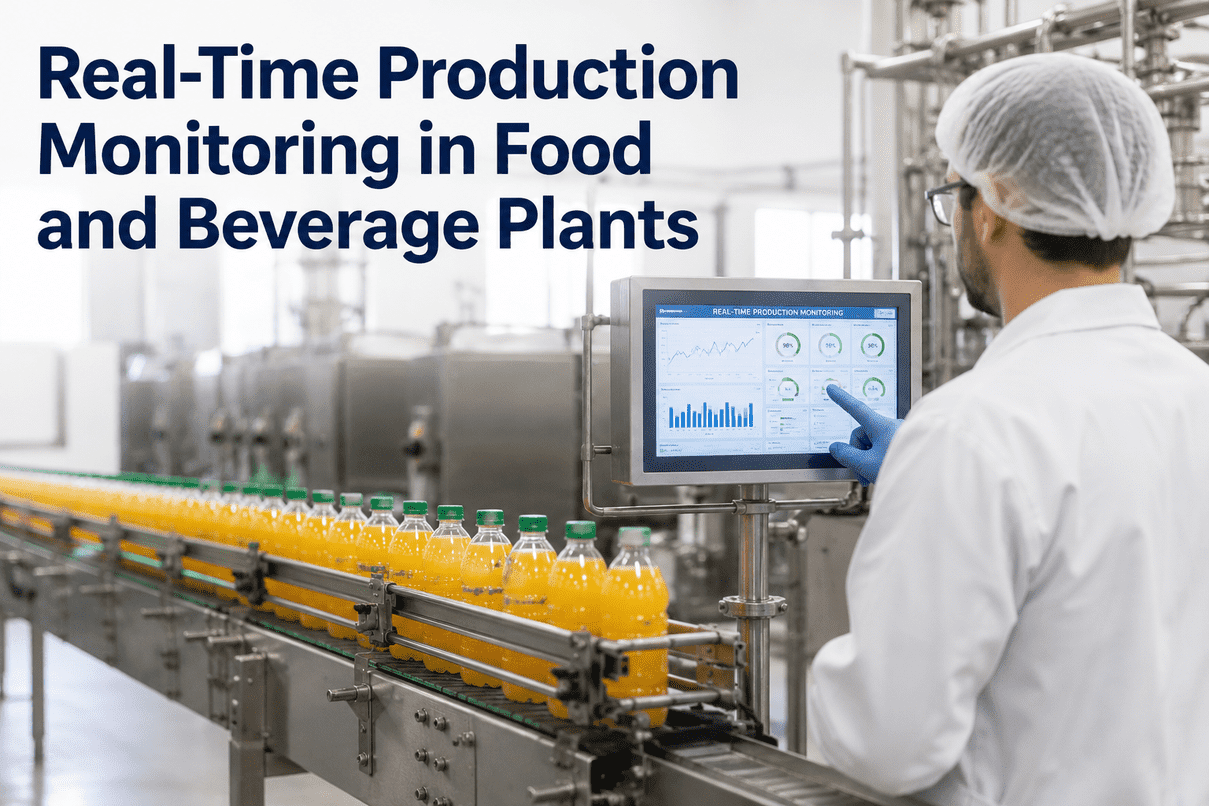
Here is the uncomfortable truth about the OEE number on most food and beverage plant reports: it is wrong, and it is wrong in a predictable direction. When a plant switches from spreadsheets and operator clipboards to automated, real-time capture, the displayed OEE does not go up — it drops, often by 8 to 12 points and sometimes 15 to 25. Production did not get worse overnight. Measurement got accurate for the first time. The classic example is a beverage bottler that believed its line stopped about five times a week; the moment real-time monitoring went live, the actual count was over 75 stops a day. The reason is structural to food and beverage: a filling or packaging line running at over 1,000 units a minute throws off micro-stops every few minutes — a label misfeed, a cap jam, a date-printer fault, a bottle tip-over, each lasting 20 to 90 seconds. The human eye cannot catch them at line speed, and a clipboard filled out at end of shift never records them. Yet those micro-stops, plus chronic under-speeding and CIP overrun, are the single biggest gap between an average F&B line at 55 to 65% and a world-class one at 82 to 85%. HKScan proved what closing that visibility gap is worth: by putting a live screen at every packaging machine, its OEE rose 20% in six months. This page shows why spreadsheet OEE always loses, and what a real-time dashboard changes.
Real-Time OEE · Food & Beverage
Spreadsheet OEE Is Always Wrong by Month-End
Manual OEE overstates reality by 8-25 points because it can't see the micro-stops that flood a high-speed food line. iFactory captures every sub-30-second loss live and turns it into a number you can actually act on this shift.
Sources: HKScan / Evocon packaging case · G&J Pepsi real-time monitoring · VDMA world-class OEE benchmark · Industry OEE benchmarking 2024-2026 · iFactory Deployment Data 2026
Why the Month-End Number Lies
Spreadsheet OEE is not slightly off — it is systematically inflated, every time, in the same direction. Operators log what they remember at end of shift, after a long day, in a rush. The micro-stops that clear in seconds never make the sheet. Cycle-time assumptions are optimistic. The result is a best-case OEE that looks healthy on the monthly report and hides the two-plus hours of lost production per shift that actually separate a 65% line from a 75% one.
5/wk
What the clipboard said
A beverage bottler's manual logs recorded roughly five line stops per week. Decisions were made on that picture for years.
Real-time on
75/day
What the sensors saw
Automated capture revealed over 75 stops a day — roughly 375 a week. The line was stopping every few minutes, invisible to everyone.
The Losses a Clipboard Cannot See
OEE breaks into the Six Big Losses across three pillars — Availability, Performance, Quality. In food and beverage, the losses that quietly destroy the number live in Performance, where manual tracking is structurally blind. These are the events that happen faster than a human can write them down.
Availability
Breakdowns
Equipment failures that halt the line
CIP & changeover overrun
Clean-in-place running past its standard window becomes hidden availability loss
Performance · the blind spot
Micro-stops
Cap jams, label misfeeds, tip-overs — 20-90s each, the #1 hidden loss on filling lines
Reduced speed
Chronic under-speeding from material variation, invisible in any manual log
Quality
Start-up rejects
Scrap produced ramping back up after a changeover
Defects
Off-spec product pulled from the line
Curious how many hours per shift your line is losing to invisible micro-stops? Book a 30-minute OEE assessment and we'll show you the gap on your data.
Expect Your OEE to Drop First — That's the Point
The strongest sign that real-time monitoring is working is counterintuitive: in the first week or two, your displayed OEE falls. Manual systems were quietly inflating the number; automated capture finally counts the micro-stops, short downtimes, and optimistic cycle times. That lower figure is not bad news — it is your first honest baseline, and the only place real improvement can start. HKScan's journey is exactly this: an accurate baseline, weekly downtime meetings on real data, and a 20% climb over six months.
Displayed OEE: Manual Estimate → Real-Time Truth → Real Gains
F&B world-class: 85%HKScan: +20% / 6 mo
Illustrative trajectory consistent with the HKScan pattern: accurate baseline first, then sustained gains from weekly data-driven downtime reviews.
Spreadsheet OEE vs Real-Time Dashboard
The gap is not effort — operators logging by hand work hard. It is that a once-a-day manual process cannot keep pace with a line that loses time every few minutes. Here is the same food line, measured both ways.
Capability
Spreadsheet / Clipboard
iFactory Real-Time Dashboard
Micro-stop capture
Misses ~100% of sub-30s events
Every stop logged to a 1-second timestamp
When you see the number
After month-end, too late to act
Live, refreshed every 30-60 seconds
Loss categorization
Inconsistent, depends on the operator
Auto-tagged to the Six Big Losses
Breakdown by SKU / shift / crew
Manual re-sorting, rarely done
One click, machine / crew / shift / product
CIP overrun handling
Lumped in or ignored, masks true cost
Standard CIP excluded, overrun flagged live
Operator burden
Hours of forms after the shift
Sensor captures data, operator just tags reasons
The HKScan Pattern — Live Screens, Weekly Reviews, +20%
HKScan, a century-old Nordic food producer with roughly 7,000 employees, ran its packaging lines on paper. Operators noted issues during the day and filled out forms after hours — tired, rushed, and unable to recall stops that had happened hours earlier. Switching to live tracking at every packaging machine changed both the data and the culture.
Before
Data capturePaper forms, end of shift
Micro-stops seenNone
Decisions based onGuesswork & assumptions
Analysis by machine/shiftNot possible
Issues forgotten by the time they were written down.
Live OEE screens
After · 6 Months
Data captureAutomatic, real-time
Packaging OEE+20% average
Decisions based onActual data, live
Analysis by machine/shiftMachine, crew, shift, SKU
Weekly downtime meetings on real data became the new standard.
What a Real-Time Dashboard Returns
+8-12 pts
OEE gain typical in year one
100%
Micro-stops captured, none missed
2+ hrs
Hidden production found per shift
Live
Intervene this shift, not next month
Frequently Asked Questions
Why does our OEE drop when we switch to real-time tracking?
Because your manual number was systematically inflated, usually by 8 to 12 points and sometimes 15 to 25. Spreadsheets miss micro-stops under 30 seconds, undercount short downtimes, and assume optimistic cycle times. When automated capture counts everything, the first accurate baseline looks worse — but that dip is the signal the system is working. It is the only honest starting point for real improvement, and it is exactly the pattern HKScan followed before climbing 20%. Book a demo to see your true baseline.
What's a realistic OEE target for a food and beverage line?
World-class in F&B is typically 82 to 85%, achievable on dedicated high-volume lines like beverage bottling but structurally harder on high-mix ready-meal operations. Industry average sits at 55 to 65%. The more productive goal than chasing a single benchmark is honest measurement first, then a sustained climb — many plants gain 8 to 12 points in year one purely from eliminating the micro-stops and speed losses that manual logs never captured.
How does the dashboard capture micro-stops on a fast line?
iFactory connects directly to your existing PLCs and sensors via standard protocols and logs every machine state change — running, idle, stopped, fault — to a one-second timestamp. A micro-stop that clears in four seconds is captured automatically, where manual tracking misses 100% of them. On a filling line running over 1,000 units a minute, those 20-to-90-second cap jams, label misfeeds, and printer faults are the single largest hidden loss, and seeing them is the whole game. Ask support about connecting your line.
How is CIP handled so it doesn't distort our OEE?
Clean-in-place is a fact of food and beverage life, so the standard CIP duration for each line and product is defined as planned downtime and excluded from availability loss. Any time exceeding that standard — a CIP overrun — is recorded as an availability loss and flagged in real time. This stops CIP from either masking true losses or being unfairly counted against the line, which is a common way manual OEE gets distorted.
Will operators with low IT literacy be able to use it?
Yes — this was HKScan's exact concern before deployment, and it dissolved quickly. The sensors capture production data automatically, so operators are not entering numbers; they simply tag a reason when a stop occurs, on a touchscreen at the machine. The interface is built for the shop floor, and live feedback at the line tends to engage operators rather than burden them, because they finally see the impact of the issues they raise.
Your Real OEE Is Lower Than Your Report Says
See the Micro-Stops Your Spreadsheet Has Been Hiding
Book a 30-minute session with an OEE specialist. We'll connect to a sample line, surface the micro-stops and speed losses your manual system misses, and show you the honest baseline and the realistic climb — the same path that took HKScan up 20% in six months.