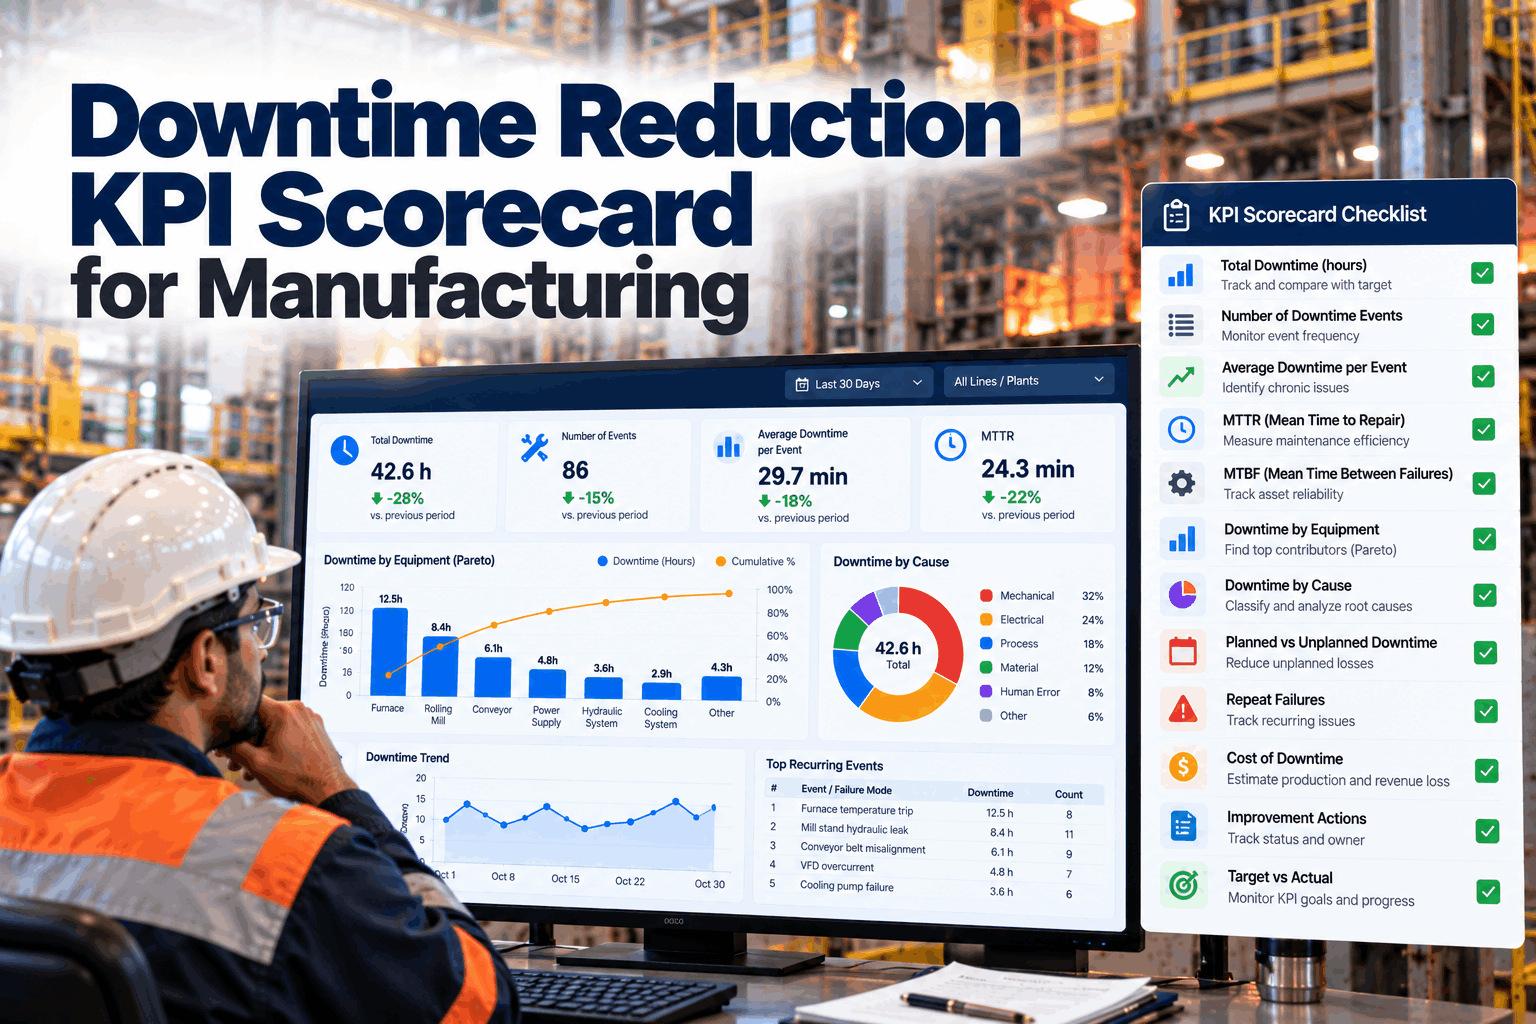
Most manufacturing plants track downtime, but far fewer can say whether it is actually getting better. Numbers sit in different reports, each line defines a stop differently, and the monthly figure arrives too late to act on. A downtime reduction KPI scorecard fixes this by putting a small set of agreed measures on one page, with clear definitions, owners, targets and a regular review. This guide covers which KPIs to include, how to calculate them, a worked example and a step-by-step setup checklist. Build yours in a scorecard session.
Downtime Reduction KPI Scorecard for Manufacturing
Ten KPIs on one page, split into results and the habits that drive them. Clear formulas, named owners, honest targets and a review rhythm that turns numbers into action.
- Lagging and leading downtime KPIs, with formulas
- A worked MTBF, MTTR and availability example
- A 20-point scorecard setup checklist
Why Downtime Numbers Often Fail to Drive Change
Plenty of data, little agreement, slow feedback.
Downtime reduction is a long game. Results come from many small fixes, better maintenance habits and faster response. Without a scorecard, those gains are hard to see and easy to argue about. Teams debate whose number is right instead of what to do next, and the people closest to the problem, operators and technicians, rarely see the numbers at all. A good scorecard settles the definitions once, shows results next to the habits that drive them and makes the next action obvious. Our reliability team can review your current reports.
Different definitions
Each line counts stops and repair time its own way.
Late numbers
Monthly reports arrive after the chance to act has passed.
Only results
Lagging measures show the damage, not what to change.
No owner
KPIs drift when nobody is answerable for them.
The Ten KPIs for a Downtime Scorecard
Five results, four habits and one data check.
The grid below lists a balanced starting set. Lagging KPIs show whether downtime is falling. Leading KPIs show whether the work that prevents downtime is being done. The data quality KPI tells you how far to trust the rest. Adjust the list to your plant with our reliability engineers.
If availability is falling while PM compliance is also falling, the cause is probably maintenance capacity. If availability falls while PM compliance stays high, the PMs may be the wrong tasks. The pair tells you far more than either number alone.
A Worked Example: MTBF, MTTR and Availability
Three numbers from the same month of data.
Take one line with 600 hours of operating time in a month, 8 failures and 24 hours of total repair time. The calculation below shows how the three core reliability KPIs connect. Figures are illustrative. Run the same maths on your own data with our analysts.
Raise MTBF
Fewer failures through better PMs, condition monitoring and root cause fixes.
Cut MTTR
Faster response, kitted spares, clear job plans and trained technicians.
Track both
Availability alone cannot tell you which of the two is moving.
Repair time often hides waiting. Break it into time to respond, time to diagnose, time waiting for parts and hands-on repair time. In many plants the waiting parts are larger than the repair itself, and they are usually easier to fix.
Build a Scorecard Your Team Trusts
Machine data, reason codes and work orders connected once, so every KPI is calculated the same way on every line, every day.
Downtime Scorecard Setup Checklist
Twenty checks in five groups, from definitions to review.
Tick each item as you set up your scorecard. Groups A and B are the foundation. If they are weak, the numbers in the rest of the scorecard will be argued about rather than acted on. Our implementation team can help with any group.
Definitions agreed
Every number on the scorecard should mean the same thing on every line and every shift.
Data sources connected
A scorecard filled by hand at month end is late and easy to argue with.
KPIs chosen and balanced
Mix results with the habits that drive them, so the team sees problems before they show in the results.
Baselines and targets set
Targets should come from your own data, not from someone else's plant.
Review rhythm in place
A scorecard only works if someone looks at it and acts on it.
Setting Targets That Drive Improvement
Your own baseline is the best starting point.
Published benchmarks vary widely by industry, process and how each plant defines its terms, so they are a poor basis for targets. Start from at least three months of your own data, set a realistic improvement and review it each quarter. When a target is hit for three months in a row, raise it. When a target is missed for three months, look at the leading KPIs before blaming the team. A missed availability target with low PM compliance usually points to a capacity or planning problem that the team cannot fix by working harder. Agree targets in a target-setting call.
Good targets
- Based on your own baseline
- One owner and one date each
- Reviewed every quarter
- Linked to a specific improvement plan
Weak targets
- Copied from another plant or article
- Set once and never revisited
- So far off they feel impossible
- No plan for how they will be reached
Turning the Scorecard into Action
Every off-target KPI needs a next step.
The scorecard is the start of the conversation, not the end. In each review, look at the KPIs that are off target, find the biggest driver with a downtime Pareto and agree one action with an owner and date. Then check at the next review whether it moved the number. Keep a short action log beside the scorecard, so anyone can see what was tried, what worked and what did not, and the same idea is not tried twice. Practise the routine in a coaching call.
Scorecard Mistakes to Avoid
Most scorecards fail from too much or too little.
The common problems are scorecards with too many KPIs, numbers no one trusts and reviews that end without action. A short scorecard review can spot them.
What works
- Ten KPIs or fewer, on one page
- Same definitions on every line
- Leading KPIs next to results
- An action for every miss
What fails
- Thirty KPIs nobody reads
- Numbers typed in at month end
- Only lagging results
- Reviews that end without actions
How iFactory Builds Your Downtime Scorecard
Live KPIs from machine data, on your own network.
iFactory reads machine states from PLCs and SCADA, links them to reason codes, work orders and the production plan, and calculates every scorecard KPI the same way on every line. It runs on an on-prem AI server inside your plant, and the AI explains what is driving each off-target KPI. Fit questions go to our solutions team.
Automatic capture
Stops and run time read from machines.
Live KPIs
Availability, MTBF, MTTR and more, every shift.
Leading measures
PM and schedule compliance from your CMMS.
Data quality
Downtime coded as other flagged by line.
AI explanations
What is driving each off-target KPI.
Owners and actions
Every miss linked to an owner and date.
Results depend on your data, definitions and review habits. We measure each KPI and its trend on your own data during the pilot, rather than promising a general figure.
Turnkey AI: Delivered, Connected and Live in 6–12 Weeks
You do not build this. It arrives ready.
iFactory ships as a pre-configured NVIDIA AI server with the software pre-loaded, racked and ready. Rack it, plug in power and Ethernet, and the AI is live on your network. Our team handles cabling, network setup, PLC, SCADA, DCS and CMMS integration, PLC, CMMS and plan links, operator training and 24×7 remote monitoring. Data stays on your network. For a scope matched to your plant, request a turnkey quote.
Ship, network and data
Server installed. Machine states, reason codes, CMMS and production plan connected.
Model training and pilot
KPI definitions agreed. Scorecard runs beside your current reports for one line.
Go-live and training
Scorecard live for all lines. Teams trained on the review routine. 24×7 monitoring begins.
Frequently Asked Questions
What is a downtime reduction KPI scorecard?
It is a one-page view of the measures that show whether downtime is falling and whether the work that prevents it is being done, with definitions, owners and targets for each.
Which KPIs should it include?
A balanced set: availability, unplanned downtime, MTBF, MTTR and downtime cost as results, plus PM compliance, planned work share, schedule compliance and repeat failures as leading measures, and one data quality check.
What is the difference between leading and lagging KPIs?
Lagging KPIs show results after they happen, such as availability. Leading KPIs track the habits that drive those results, such as PM compliance, so you can act before results slip.
How do we calculate availability from MTBF and MTTR?
Availability equals MTBF divided by the sum of MTBF and MTTR. With 75 hours MTBF and 3 hours MTTR, availability is about 96.2 percent.
How should we set targets?
Use at least three months of your own data as a baseline, set a realistic improvement and review it each quarter. Published benchmarks rarely match your definitions.
How often should the scorecard be reviewed?
Daily for availability and top causes, weekly for trends and leading KPIs, and monthly for cost and progress against targets.
Should micro-stops be on the scorecard?
Yes, if your lines have many short stops. Track them as a separate count or minutes figure, because they rarely appear in MTBF but can take a large share of availability on fast lines.
Can the scorecard be filled automatically?
Yes. Machine states, work orders and production plans can feed every KPI, so the numbers are ready without manual entry.
How do we start?
Start with one line. A 6-week pilot connects your data, agrees definitions and runs the scorecard beside your current reports. To plan it, contact our team.
See Every Downtime KPI on One Page
In thirty minutes we review your current downtime reports and sketch a ten-KPI scorecard for one line, with definitions and owners. You keep the sketch either way.
- 1Your current downtime reports
- 2Three months of downtime data for one line
- 3PM compliance from your CMMS
- 4How each line defines a stop
- 5The KPI people argue about most