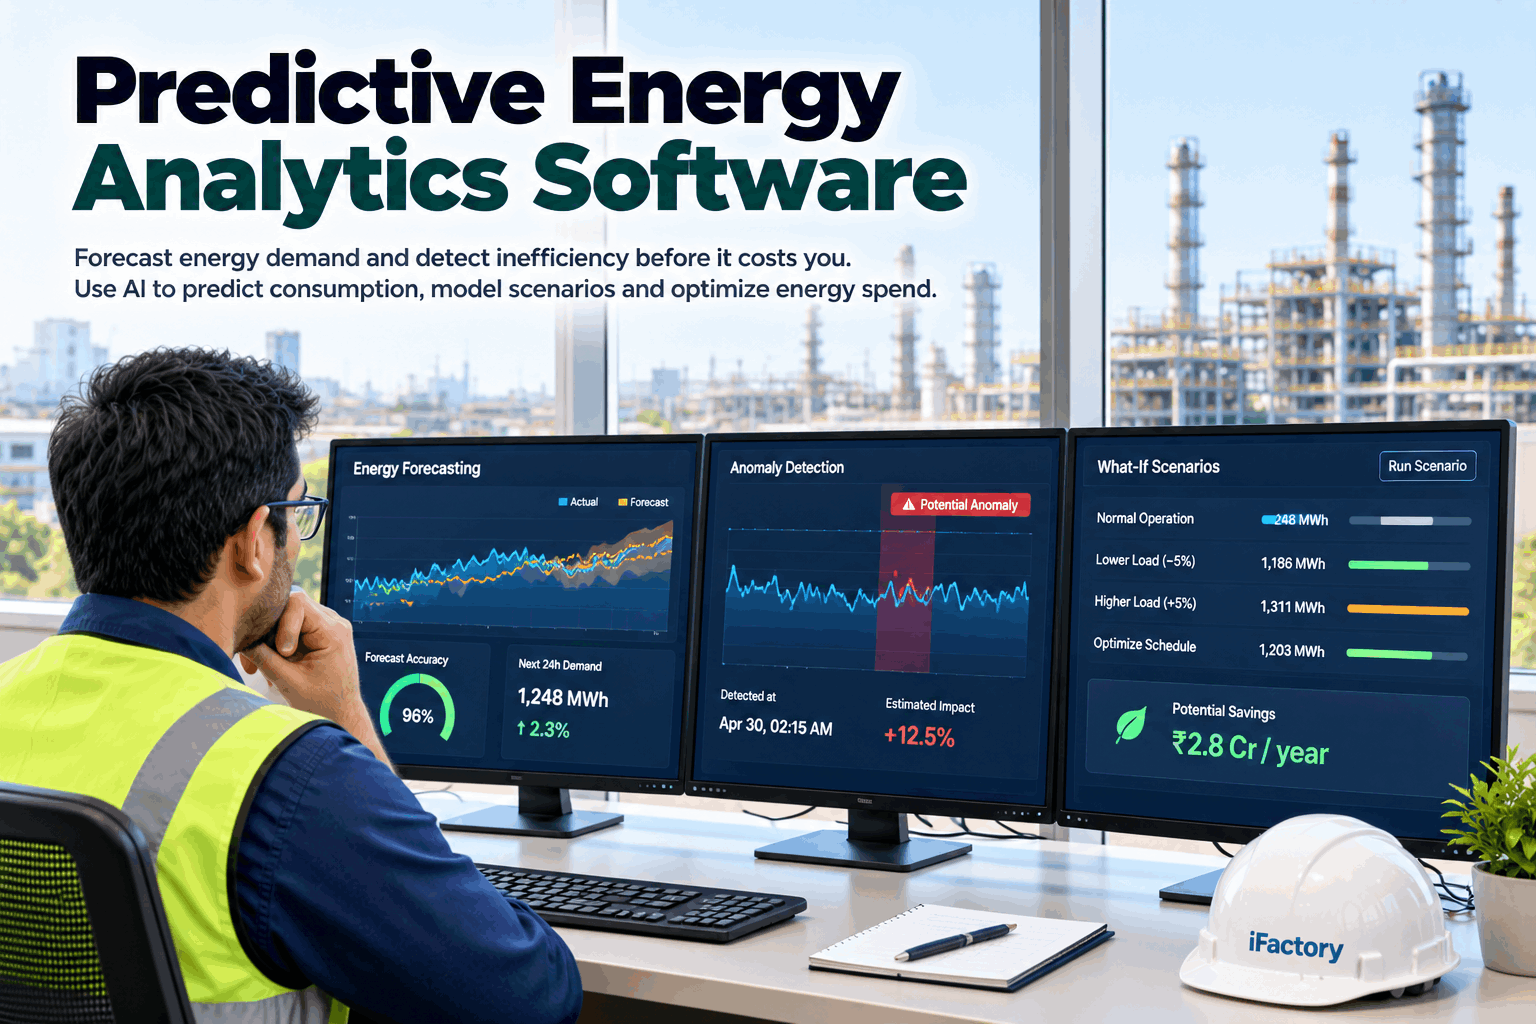
Most energy reports only look backwards. They tell you what last month cost, long after anything could be done about it. Predictive analytics looks forward: what tomorrow will use, where today is drifting from normal, and what a change would do before you make it. iFactory's AI Anomaly Detection does all three from your own meters. To try it on your plant, book a forecast demo.
Predictive Energy Analytics Software
Forecast tomorrow's energy and peak demand, catch equipment drifting from its normal pattern, and test changes before you make them, all from the meters you already have.
- How an energy forecast is built, and how to check it
- How AI spots drift weeks before a bill would show it
- Scenarios that answer "what if" before you spend
How to read it
- The shaded band is where use should fall, given the plan and the weather.
- The dashed line is the forecast. The solid line is what happened.
- From 18:00 the plant stayed busy when it should have wound down.
- The dots mark hours outside the band. Together they raise one alert, not four.
All day the plant stayed inside its expected range. From 18:00 it did not wind down as it should. That is the kind of pattern a monthly bill hides and a model catches the same evening.
Three Jobs for Predictive Energy Analytics
Forecast what is coming. Detect what is wrong. Test what you might change.
"Predictive" covers three different jobs, and each answers a different question. All three rest on the same thing: a model that knows what your plant should use for a given output, shift pattern and weather. Build that model well once, and it serves all three jobs. Our support team can show which of the three your data supports today.
Forecast
How much energy, and how high a peak, tomorrow and next week. For buying power and planning production.
Detect
Where today differs from what the model expects. For catching waste and failing equipment early.
Test
What a new shift pattern, line or tariff would do. For deciding before you spend.
How the Forecast Is Built, and How to Check It
A forecast you cannot check is only a guess.
The model learns from your own history: how energy has moved with output, shifts, weekdays, holidays and outside temperature. Tomorrow's forecast then uses tomorrow's production plan and weather forecast. Just as important, it reports its own accuracy every day, so you always know how far to trust it. To see a forecast on your own data, book a forecast session.
What goes in
- At least a year of meter history, more is better
- Production counts or plan, by line and product
- Shift patterns, weekends and holidays
- Outside temperature, past and forecast
- Tariffs, including time-of-day rates and demand charges
How accuracy is shown
- Typical error. How far forecasts landed from actual, in percent.
- Bias. Whether the model runs high or low on average.
- Range. The band actual use should fall in on most days.
- Track record. Accuracy for the last 30 and 90 days, always visible.
Three ways to model energy, in plain words
Simple baseline
Energy as a fixed base plus a share for each unit made and each degree of heat or cold. Easy to explain and check.
Machine learning
Learns more complex patterns, such as how products, shifts and weather interact. Often more accurate, and checked the same way.
Asset models
One model per compressor, chiller or furnace, built from its own history. Best for spotting drift in a single machine.
ASHRAE Guideline 14, widely used for energy savings verification, sets limits for how far an hourly energy model may stray from measured data: under 30% on CV(RMSE) and under 10% on NMBE. They are a useful floor. A plant model that cannot meet them should not be used to judge savings.
Tomorrow, Planned
A forecast only earns its keep when it changes a real decision. Here, a peak warning moves one start time and keeps the month's demand charge down.
AI Anomaly Detection: Catching Drift Early
Equipment rarely fails at once. It drifts, and the drift costs energy first.
Each significant asset gets its own model of normal use, given what it is doing at the time. When real use moves away from that model and stays away, the platform flags it. Short blips are ignored. Persistent drift is ranked by what it costs, so the team sees the few that matter, not hundreds of alarms. Models keep learning as equipment and production change. Ask our analytics team which assets on your site would gain most.
Slow drift
A compressor using a little more each week. Often a leak, a fouled cooler or a worn part.
Step change
A sudden, lasting rise after maintenance or a setting change.
Running off schedule
Equipment on when the line is stopped, or not winding down after a shift.
Out of season
Heating or cooling behaving as if the weather were different.
Peak building
Loads lining up toward a new monthly peak, warned in time to act.
Meter fault
A reading that is impossible, flat or missing, flagged so it is not mistaken for savings.
An alert system that fires every hour is soon ignored. Alerts here need to persist for a set time, are grouped by asset, and arrive ranked by estimated cost per day. The aim is a short daily list that someone can actually work through.
What each alert contains
- The asset, and how far it is from its model
- How long the drift has lasted
- Estimated cost per day if nothing changes
- Similar past cases, and what fixed them
What it does not do
- Change any setting on its own
- Alert on single readings that recover quickly
- Count a meter fault as a saving
- Hide how confident it is
Scenario Modelling: Test Before You Change
The same model that forecasts tomorrow can answer "what if".
Changing a shift pattern, adding a line or moving to a new tariff all change energy use, and the effect is hard to guess. The model can run the change on paper first, using your real history and your real tariff, and show the effect on energy, peak and cost. To try a scenario of your own, book a scenario session.
Plants that buy electricity in advance, or on contracts with volume bands, pay for getting the forecast wrong. A forecast built from the production plan, with an honest range, lets the buyer commit closer to real need, and see the risk on either side.
Scenarios are estimates built on your history. They are a strong guide for decisions, not a guarantee, and the platform shows the uncertainty with each one.
From Prediction to Saving
A prediction saves nothing until someone acts on it.
The value comes from closing the loop: an alert reaches the right person, the cause is fixed, and the saving is measured against the model. The platform tracks each step, so a team can show what its work saved. It runs on a server inside your network, so production plans and energy data never leave the site. Our integration team can confirm what your systems already provide.
The loop, step by step
- Drift or peak flagged, with cost per day
- Sent to the owner of that asset or area
- Cause found and fixed
- Saving measured against the model, not guessed
What it connects to
- Meters, sub-meters and control systems
- Production plan and counts from MES or ERP
- Weather forecast for your site
- Your maintenance system, for work requests
Once a fix is made, the asset's real use is compared with what its model says it would have used without the fix. That gap is the measured saving, adjusted for output and weather. It is the same idea used in formal savings verification, and it gives numbers a finance team can trust.
One model, three users
- Energy manager. Forecasts, peak warnings and savings tracked.
- Maintenance lead. Assets drifting from normal, ranked by cost.
- Plant manager. Scenarios for shifts, lines and tariffs.
The platform advises. Your team decides what to change.
Turnkey AI: Delivered, Connected and Live in 6–12 Weeks
You do not build this. It arrives ready.
iFactory ships as a pre-configured NVIDIA AI server, racked and ready, with the software pre-loaded. Rack it, plug in power and Ethernet, and the AI is live on your network.
Our team handles cabling, network setup, PLC and SCADA integration, operator training and 24×7 remote monitoring. The server sits inside your own network, so energy and production data stay on site. For a scope matched to your plant, request a turnkey quote.
Ship, network and data
Server installed. Meters, production data and weather connected. At least a year of history loaded.
Model training and pilot
Plant and asset models trained and checked against held-back data. First forecasts and alerts reviewed with your team.
Go-live and training
Daily forecasts, alerts and scenarios live. Users trained. 24×7 remote monitoring begins.
Frequently Asked Questions
What is predictive energy analytics?
Using models of how a plant uses energy to forecast future use, detect when equipment drifts from normal, and test changes before making them. It turns energy data from a record of the past into a tool for planning. In a factory that means fewer surprises on the power bill, earlier warning of failing equipment, and better-informed decisions on shifts, lines and tariffs.
How accurate are the forecasts?
It depends on your data and how steady your production is. The platform shows its own error and bias for the last 30 and 90 days, so accuracy is never assumed. Plants with good production data and a year or more of history usually get the most reliable results.
How much history do we need?
A year is a good minimum, so the model sees every season. Less can work for plants with little weather effect. More history, and more detailed production data, both improve forecasts and anomaly detection. If production data is only monthly, the platform can start with that and get sharper as better data is connected.
How is anomaly detection different from alarms?
An alarm fires when a value crosses a fixed limit. Anomaly detection compares each asset with its own expected use for the current conditions, so it can catch a small, steady drift long before any fixed limit is reached. The two work well together: alarms protect equipment, while anomaly detection protects the energy bill.
Can it lower our demand charges?
It can warn when a new monthly peak is likely, early enough to move flexible loads. Whether that saves money depends on your tariff and which loads can move. The platform shows the likely saving before you act, and records what was actually avoided afterwards, so the benefit is clear at the end of each month.
Does it change equipment settings?
No. It forecasts, detects and models. People decide what to change, and work requests go to your maintenance system for the usual approval. Control of plant equipment stays exactly where it is today.
How long does it take to go live?
Six to twelve weeks from delivery. We need a place for the server with power and Ethernet, read access to meters and production data, and a year of history if you have it. To check your set-up first, contact our team.
Bring a Year of Meter Data
In thirty minutes we fit a first model to your history, show how well it matches, and point out the days and assets that stand out. You keep the analysis whether or not you go further with iFactory.
- 1A year of hourly or 15-minute meter data
- 2Monthly or daily production for the same year
- 3Your shift pattern and holiday calendar
- 4Your electricity tariff, with demand charges
- 5Three assets you suspect use too much