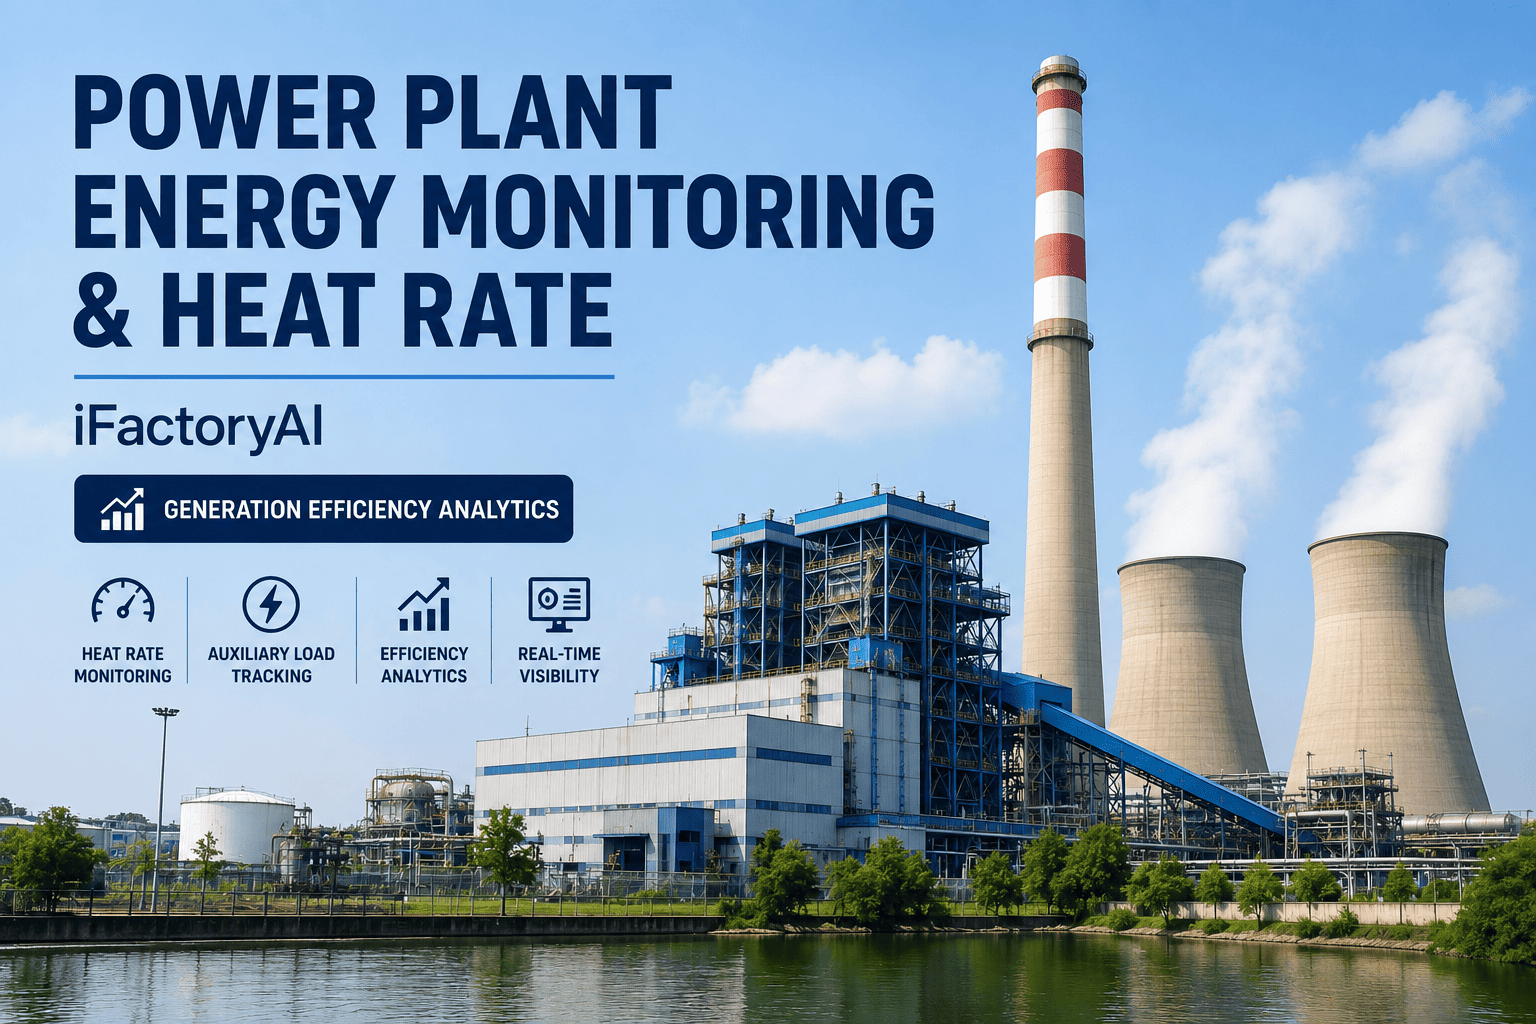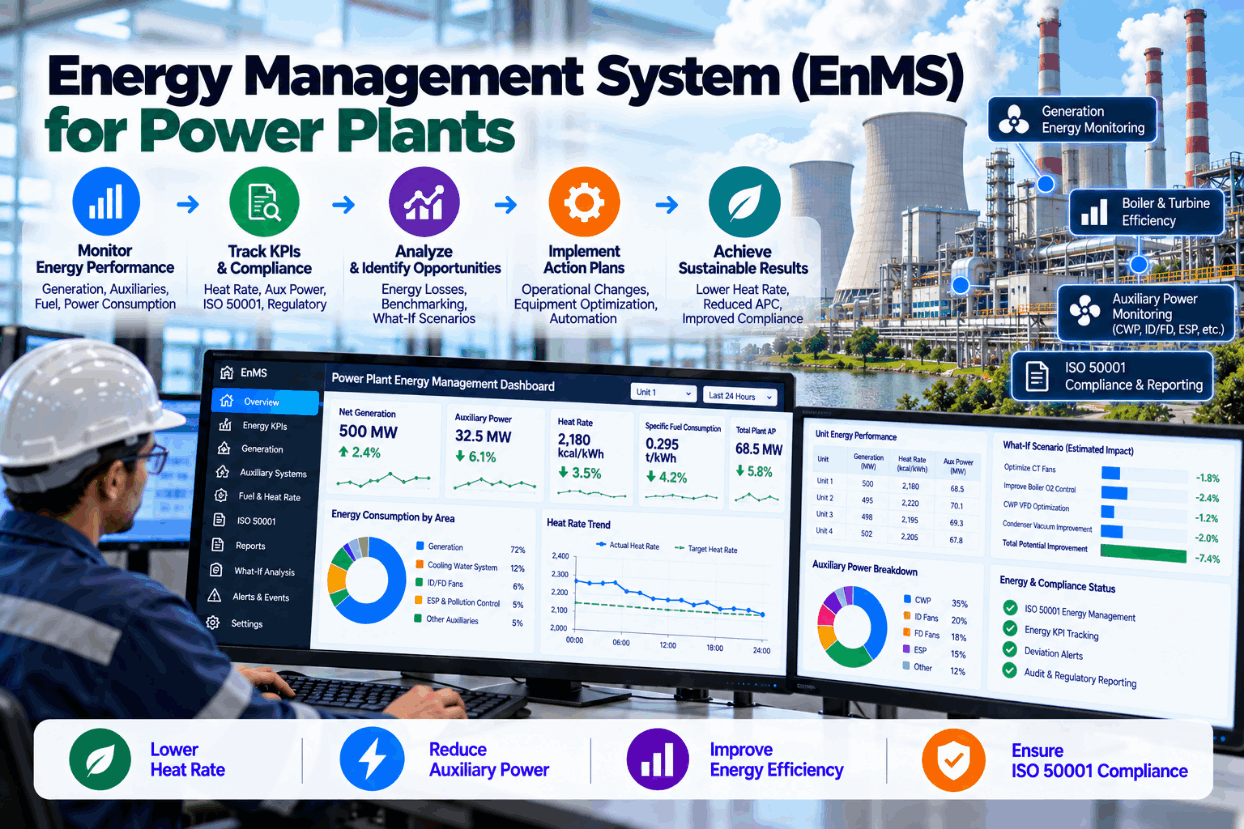
A power plant is an energy business, yet its own energy performance is often managed through monthly reports that arrive too late to change anything. Heat rate drifts, auxiliary power creeps up and nobody owns the gap until the next audit or regulatory filing. An energy management system aligned with ISO 50001 changes that by making energy performance a managed process: measured, normalized, owned and reviewed. This guide explains what ISO 50001 asks for, how to identify the significant energy uses in a power plant, how to build energy performance indicators and baselines that stand up to scrutiny, and how to deploy an EnMS across generation and auxiliary systems. To see a power plant EnMS in action, book a short walkthrough.
Energy Management System (EnMS) for Power Plants: Make Heat Rate and Auxiliary Power Accountable
ISO 50001-aligned energy reviews, normalized indicators and named owners for every significant energy use, from boiler and turbine to fans, pumps and mills.
Why Energy Performance Slips Without a System
Most plants track heat rate and auxiliary power. Fewer manage them. The difference is ownership and timing. When numbers arrive monthly, are not normalized for load and coal, and belong to nobody in particular, a slow drift looks like noise until it becomes a large loss.
India’s Perform, Achieve and Trade scheme shows both the potential and the difficulty. According to the Centre for Science and Environment’s review, 144 thermal power plants took part in the first cycle, with an energy saving target of 3.211 million tonnes of oil equivalent based on net heat rate. The sector achieved 3.06 MTOE across plants that completed verification, the only sector to fall short of its target in that cycle.
An EnMS will not make a plant efficient on its own. It makes sure someone notices, owns and acts on every significant loss. We can review your current energy reporting on a call.
What ISO 50001 Actually Requires
ISO 50001 is a management system standard. It does not set efficiency targets; it requires a structured way of improving energy performance, using the plan-do-check-act cycle.
Supporting standards help with the detail: ISO 50006 covers indicators and baselines, and ISO 50015 covers measurement and verification of savings. Our specialists can map your current practices to these requirements.
Finding the Significant Energy Uses in a Power Plant
In a thermal plant, the dominant energy use is obvious: fuel into the boiler. But the energy review must also look at where that energy is lost and where electricity is consumed internally.
Dry flue gas loss, unburnt carbon, moisture and radiation losses decide boiler efficiency.
Steam conditions, heater performance, condenser vacuum and turbine internal efficiency.
ID, FD and PA fans, often the largest auxiliary consumers, sensitive to air heater leakage.
Boiler feed pumps and cooling water pumps, sensitive to recirculation and staging.
Coal mills and handling systems, sensitive to coal hardness and mill condition.
Smaller individually, but often easy to improve.
Significant energy uses are then given specific indicators, owners and operating controls. For most thermal units, the list includes boiler efficiency, turbine heat rate, condenser performance, fan power and pump power. See a sample energy review in a demo.
Building EnPIs and Baselines That Hold Up
Raw numbers mislead. Heat rate rises at part load, auxiliary power share rises when output falls, and coal quality moves everything. Indicators must be normalized for the variables that drive them.
| Indicator | Normalize for | Owner |
|---|---|---|
| Station net heat rate | Load, ambient and cooling water temperature, coal quality | Station manager |
| Boiler efficiency | Coal quality, load, ambient temperature | Boiler engineer |
| Turbine cycle heat rate | Load, main and reheat steam conditions, backpressure | Turbine engineer |
| Auxiliary power percentage | Load, number of units running, ambient | Operations manager |
| Fan power per MW | Load, air heater condition, coal quality | Boiler engineer |
| Specific water consumption | Load, ambient, cycles of concentration | Chemistry lead |
Illustrative figures. The baseline model removes the effect of load and conditions, so what remains is performance.
Baselines need care when conditions change for good, such as a new coal source or a major overhaul. ISO 50001 expects the baseline to be adjusted in those cases, with the reason recorded.
Without normalization, a month of low load looks like poor performance and a cool month hides real losses. Baseline models are built from your own history during set-up.
Running the EnMS Month by Month
An EnMS works when its cycle is short enough to act on and regular enough to become habit.
Energy data collected automatically from DCS, historian and meters.
Indicators compared with baseline models, not raw history.
Deviations above thresholds assigned to named owners.
Owners investigate and raise actions with dates.
Weekly operations review and monthly management review.
Completed actions verified and baselines adjusted when conditions change.
Thresholds should be set with care. Too tight, and owners are flooded with alerts for normal variation; too loose, and real losses go unnoticed for weeks. A practical approach sets thresholds from the baseline model’s own error range, so an alert means the deviation is larger than the model can explain.
Daily or weekly indicators are what make the difference. Monthly review of monthly data is too slow for a unit whose air heater leakage is rising or whose condenser is fouling. Daily indicators with weekly owner reviews catch those within days.
Management review then looks at trends, actions and resources rather than raw numbers. We provide a review template with every rollout.
Deploying an EnMS Across Generation and Auxiliaries
A practical deployment builds the system in steps, starting where the value is highest.
Leadership sets the energy policy, names an energy manager and agrees resources.
Map energy flows, identify significant uses and estimate improvement potential.
Build normalized EnPIs for each significant use and agree baseline periods.
Assign owners, thresholds and response times.
Set operating criteria, such as oxygen targets and pump staging rules, for significant uses.
Run internal audits and, if desired, seek ISO 50001 certification.
Operators need to be part of the system, not just its audience. Simple energy criteria in shift routines, such as oxygen targets and pump staging rules, turn the EnMS into daily practice.
Certification is optional; the discipline is what delivers results. Many plants run an ISO 50001-aligned system for a year before deciding to certify, once the data and routines are proven.
Where the plant is a designated consumer under India’s Energy Conservation Act, the same data supports PAT reporting and audits. Our team can align the two.
EnMS Readiness Checklist for Power Plants
Use this checklist to judge how ready your plant is for a working EnMS.
Metering gaps on auxiliary loads are the most common blocker. We identify them during a short site review.
What an EnMS Delivers
An EnMS pays through faster detection and consistent follow-through rather than a single project.
The PAT experience shows why this matters: targets based on heat rate need sustained, verified performance over years, not one-off fixes. An EnMS is the routine that sustains it.
A pilot on one unit usually shows enough early wins to justify station-wide rollout. Ask our advisors how others have phased it.
How iFactory Delivers a Power Plant EnMS
DCS, historian and meter data collected and checked.
Indicators normalized for load, ambient and coal.
Deviations routed to named owners with context.
Actions, dates and verified savings in one place.
Weekly and monthly reviews ready without manual work.
PAT, audit and emissions reporting from the same data.
It works with your existing DCS, historian and reporting tools. Bring a year of data and we will show your EnPIs normalized in a session.
Put Every Significant Energy Use Under an Owner
Start with one unit. We run the energy review, build normalized indicators and baselines, assign owners and show daily deviations and weekly review packs through the pilot.
Auxiliary power consumption up 0.4 points this month against the normalized baseline. Largest contributor: ID fans on unit 1 after an air heater washing delay.
An Energy Deviation Routed to Its Owner
This exchange shows how a station energy manager might use iFactory.
iFactory ships as a pre-configured NVIDIA AI server, racked and ready with the energy management analytics models loaded. Rack it, plug in power and Ethernet, and the AI is live on your network. Our scope covers sensors and data connections across boilers, turbines, auxiliaries and station metering, DCS, PLC/SCADA, historian and ERP integration, cabling and network setup, operator and quality team training, and 24×7 remote monitoring.
Server installed, DCS and historian links live, historical operating, performance and maintenance data loaded.
Models calibrated on your own unit data, then run in advisory mode on one unit with your operations and performance engineers reviewing every output.
Rollout to the agreed units under your change management, operator and engineer training, and 24×7 remote monitoring in place.
Software, server and integration come as one package. For pricing on your station, contact our sales team.
Frequently Asked Questions
A structured process, typically aligned with ISO 50001, for measuring, normalizing, owning and improving energy performance across the boiler, turbine cycle and auxiliary systems.
No. It requires a system for continual improvement of energy performance, including an energy review, indicators, baselines, objectives and management review. Targets are set by the organization.
Typically boiler combustion, the turbine cycle including condenser, draft fans, boiler feed and cooling water pumps, and coal mills and handling.
Heat rate and auxiliary power change with load, ambient conditions and coal quality. Normalizing removes those effects so real performance changes are visible.
PAT sets heat rate based targets for designated consumers. An EnMS provides the data, routines and verification that help plants meet and prove those targets.
A first unit can typically be running within a 6–12 week rollout, with the rest of the station following in stages. Plan it with our team.
Make Energy Performance Someone’s Job, Every Day
iFactory runs the data side of your EnMS: normalized indicators, owner alerts and review packs that keep heat rate and auxiliary power under control between audits.
Illustrative. EnPIs are normalized for load, ambient and coal quality before comparison.