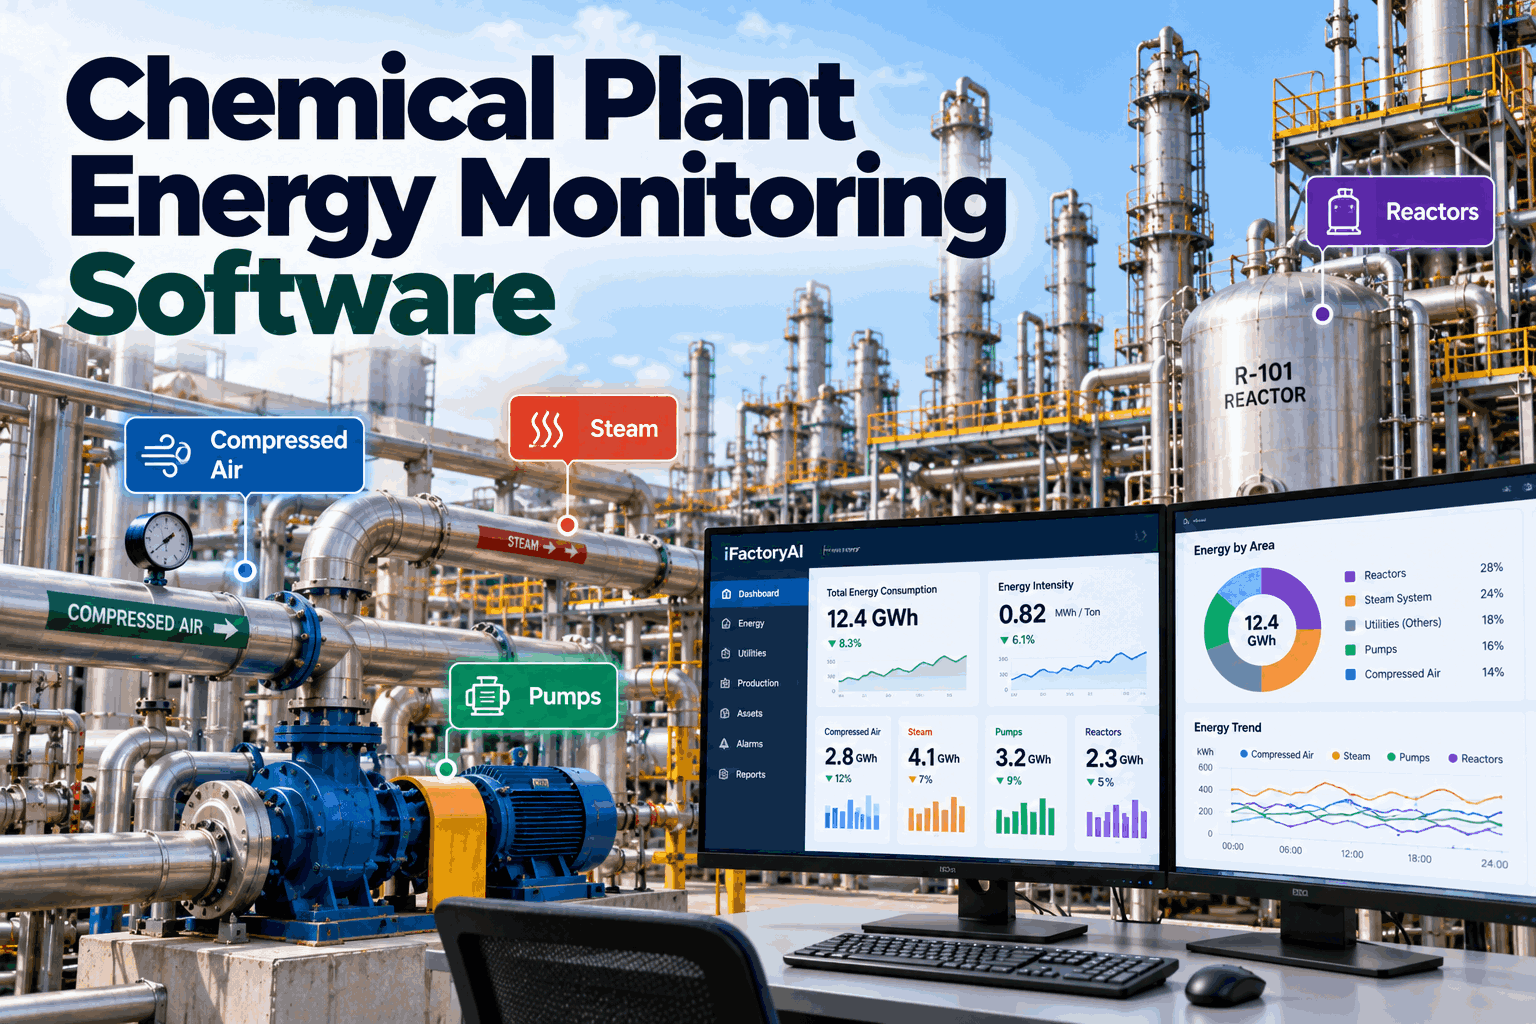
Ask a chemical plant what it spent on energy last month and you will get a utility bill and a plant-wide total. That figure hides almost everything that matters. One compressor loads and unloads all night with no production, a steam header loses condensate through failed traps, a pump runs throttled against a valve, and a reactor jacket heats longer than the recipe needs. Real-time energy monitoring shows compressed air, steam, cooling water, pumps and reactors as they use energy, so waste is found in days instead of at the next audit. See it in an energy monitoring demo.
Chemical Plant Energy Monitoring with Real-Time AI
Live energy use for compressed air, steam, pumps and reactors across the whole plant. AI separates real process demand from leaks, trap failures and idle running, and names the biggest source of waste each day.
- Why one plant-wide energy figure finds nothing
- Where compressed air, steam, pumps and reactors lose energy
- Specific energy per tonne, with a worked example
Why Monthly Energy Reports Miss the Waste
A plant total cannot say which unit, utility or hour lost the energy.
Chemical plants are energy intensive, and most of the energy is spent in utilities that nobody watches closely: air compressors, steam headers, cooling circuits and pump sets. A monthly total mixes real process demand with leaks, failed traps and equipment running with nothing to do. By the time the bill arrives, the cause is gone from memory. Our energy specialists can review how you track utilities today.
Plant totals
One large number hides the unit at fault.
Bills and rounds
Meter readings taken by hand, days apart.
No output link
Energy not compared with what was produced.
Found too late
Leaks and traps seen at the next audit.
Specific Energy: A Worked Example
Energy only means something next to what the plant made.
Take one process unit over a day. It makes 2,250 tonnes of product and uses 5,400 tonnes of steam. The standard for this product is 2.10 tonnes of steam per tonne. Dividing by output turns a utility total into a number that can be compared across days, units and products. All figures are illustrative. Run the numbers for your units in a working session.
Different grades and recipes need different amounts of heat, cooling and air. A single plant-wide standard makes demanding products look wasteful and hides real losses on easy ones. Hold a specific energy standard for each product and operating mode.
Where Each Utility Loses Energy
Every utility wastes energy in its own way.
Process teams already know these losses. The gap is seeing them continuously, with a number attached, instead of finding them in a yearly survey. Map your meters and losses with our implementation team.
A reactor that needs steam is not wasting it. Waste is energy used beyond what the recipe and output require. Comparing use with production state is what lets the system tell the two apart.
Compressed Air: Leaks and Idle Demand
Air is one of the costliest utilities, and one of the least watched.
Compressed air is expensive to make, and a large share of what is made can leak out through couplings, hoses and valves. The clearest sign is air demand that continues when production stops. Tracking flow and compressor power by area, against production state, shows which unit leaks and when compressors run unloaded. Review your air system with our utilities team.
Off-shift demand
Air still flowing when the unit is stopped.
Idle compressors
Machines running with no air delivered.
Set point creep
Header pressure higher than any user needs.
Poor staging
Too many compressors sharing a small load.
Steam Systems and Trap Failures
A failed trap wastes steam every hour it stays unnoticed.
Steam is generated, distributed, used and returned as condensate. Energy is lost at each step: leaking or blowing traps, lost condensate, uninsulated lines and flash steam sent to atmosphere. Monitoring steam flow by header and unit, with trap condition signals where fitted, turns these into a ranked repair list. Plan steam monitoring with our steam systems team.
Generate
Boiler fuel against steam made.
Distribute
Header pressure and line losses.
Use
Steam per unit, per recipe step.
Trap
Failed or blowing traps flagged.
Return
Condensate recovered against steam used.
See Every Utility's Energy While the Plant Is Running
Compressed air, steam, pumps and reactors in one live view, with the biggest source of waste named every day.
Pumps and Reactors: Energy Beyond What the Process Needs
Process equipment can quietly use more than the recipe requires.
A pump that throttles its output through a valve spends power to waste it. A reactor that heats longer than needed or overshoots its jacket temperature spends steam and then cooling water to correct it. Neither shows up as a fault, so neither is repaired. Comparing energy per batch and per pump duty against the best result for the same product shows the gap. Check your equipment data with our process team.
Which pumps are throttled?
Power drawn against flow delivered and valve position.
Which batches overheat?
Heat-up time, overshoot and hold length by recipe step.
Where does cooling fight heating?
Chilled and cooling water used while steam is also running.
AI That Names the Biggest Source of Waste
Not just a chart, but what to check first.
The AI compares each utility with production state and with the same product on earlier days. It separates real demand from waste, ranks the sources by cost and points to likely causes, such as a leaking line, a stuck-open drain or a pump set to the wrong duty. Ask our AI team how it works on your data.
Energy Monitoring Mistakes to Avoid
Energy data is easy to collect and easy to misread.
These are common problems when chemical plants start monitoring utilities. A short readiness review can avoid them.
What works
- Energy compared with output and product
- Sub-meters by unit and utility
- Waste separated from process demand
- Ranked actions with a cost attached
What fails
- One plant total, once a month
- One standard for every product
- Meters that are never checked
- Alerts with no owner or action
How iFactory Runs Utility Energy Monitoring
Plant-wide energy visibility, on your own network.
iFactory reads utility meters, process states and production data, calculates specific energy for every unit and product, separates waste from demand and names the biggest source each day. It runs on an on-prem AI server inside your plant. Fit questions go to our solutions team.
Live utility energy
Air, steam, water and power per unit.
Specific energy
Energy per tonne, by product and mode.
Waste detection
Leaks, traps and idle running flagged.
Per-product standards
Fair comparison across grades.
Ranked actions
The biggest source of waste named daily.
On-prem
Plant data stays in the plant.
The figures on this page are worked examples. Your own energy use depends on your products, equipment and practices, and we measure it on your data during the pilot.
Turnkey AI: Delivered, Connected and Live in 6–12 Weeks
You do not build this. It arrives ready.
iFactory ships as a pre-configured NVIDIA AI server with the software pre-loaded, racked and ready. Rack it, plug in power and Ethernet, and the AI is live on your network. Our team handles cabling, network setup, PLC, SCADA, DCS and CMMS integration, energy meter connections, operator training and 24×7 remote monitoring. Data stays on your network. For a scope matched to your plant, request a turnkey quote.
Ship, network and data
Server installed. Utility meters, process states and production data connected.
Model training and pilot
Baselines and product standards set. Live energy monitoring runs on a few units.
Go-live and training
Plant-wide monitoring live with ranked actions. Teams trained. 24×7 monitoring begins.
Frequently Asked Questions
What should a chemical plant monitor first?
Start with the utilities that cost the most and are watched the least, usually compressed air and steam, then add pumps, cooling water and reactors.
How do you tell waste from real process demand?
By comparing energy use with production state and output. Use beyond what the recipe and product require is treated as waste.
What is specific energy?
Energy used divided by product made, such as tonnes of steam per tonne of product. It allows fair comparison across days, units and products.
Can it find compressed air leaks?
It shows air demand continuing when production is stopped and which area it comes from, so leak teams know where to look first.
Does it monitor steam traps?
Where trap condition signals or steam flow data exist, failed traps are flagged and ranked. Where they do not, steam use against output shows the loss.
Do we need new meters?
Not always. Existing meters, PLC and SCADA data are used first. Sub-meters can be added where a unit or utility is not measured.
Does it work with batch and continuous plants?
Yes. Batch plants are measured per recipe step and batch, and continuous plants per unit and product over time.
Where is the data stored?
On the on-prem server inside your plant, shown on dashboards and displays on your network.
How do we start?
Start with a few units. A 6-week pilot connects meters, sets baselines and runs live energy monitoring. To plan it, contact our team.
Find Your Plant's Biggest Energy Losses This Week
In thirty minutes we look at your current energy tracking and utility data, and show what live monitoring would reveal. You keep the notes either way.
- 1Your utility list and meters
- 2Last three monthly energy reports
- 3Production output by product
- 4Compressor and boiler details
- 5The unit you suspect wastes the most