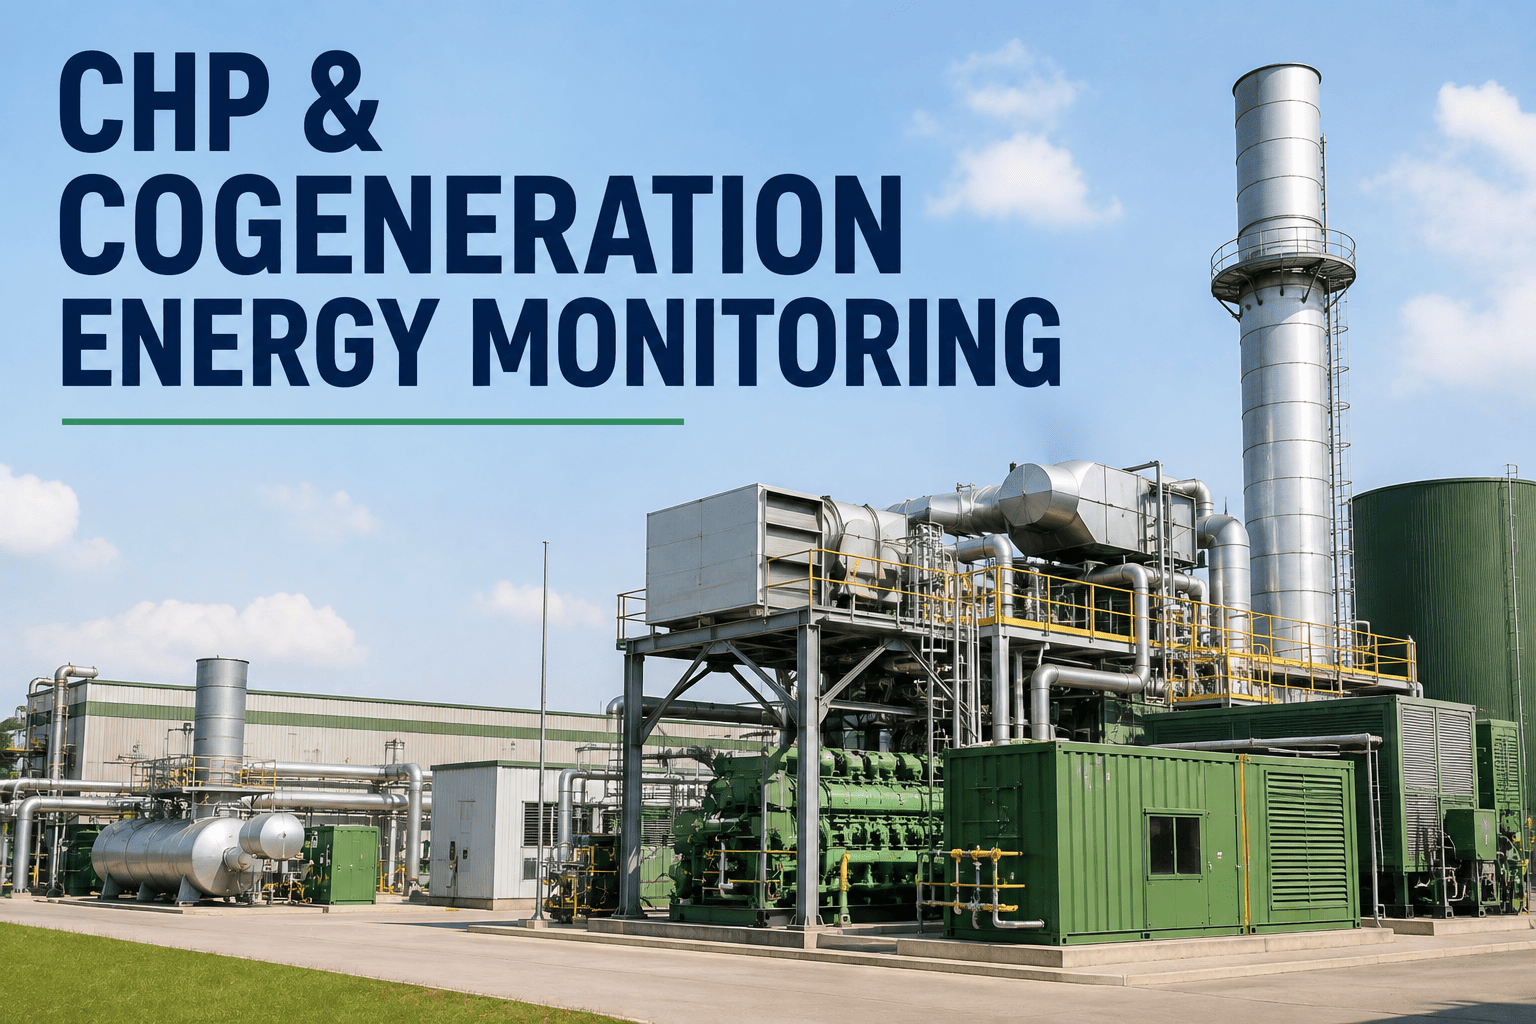
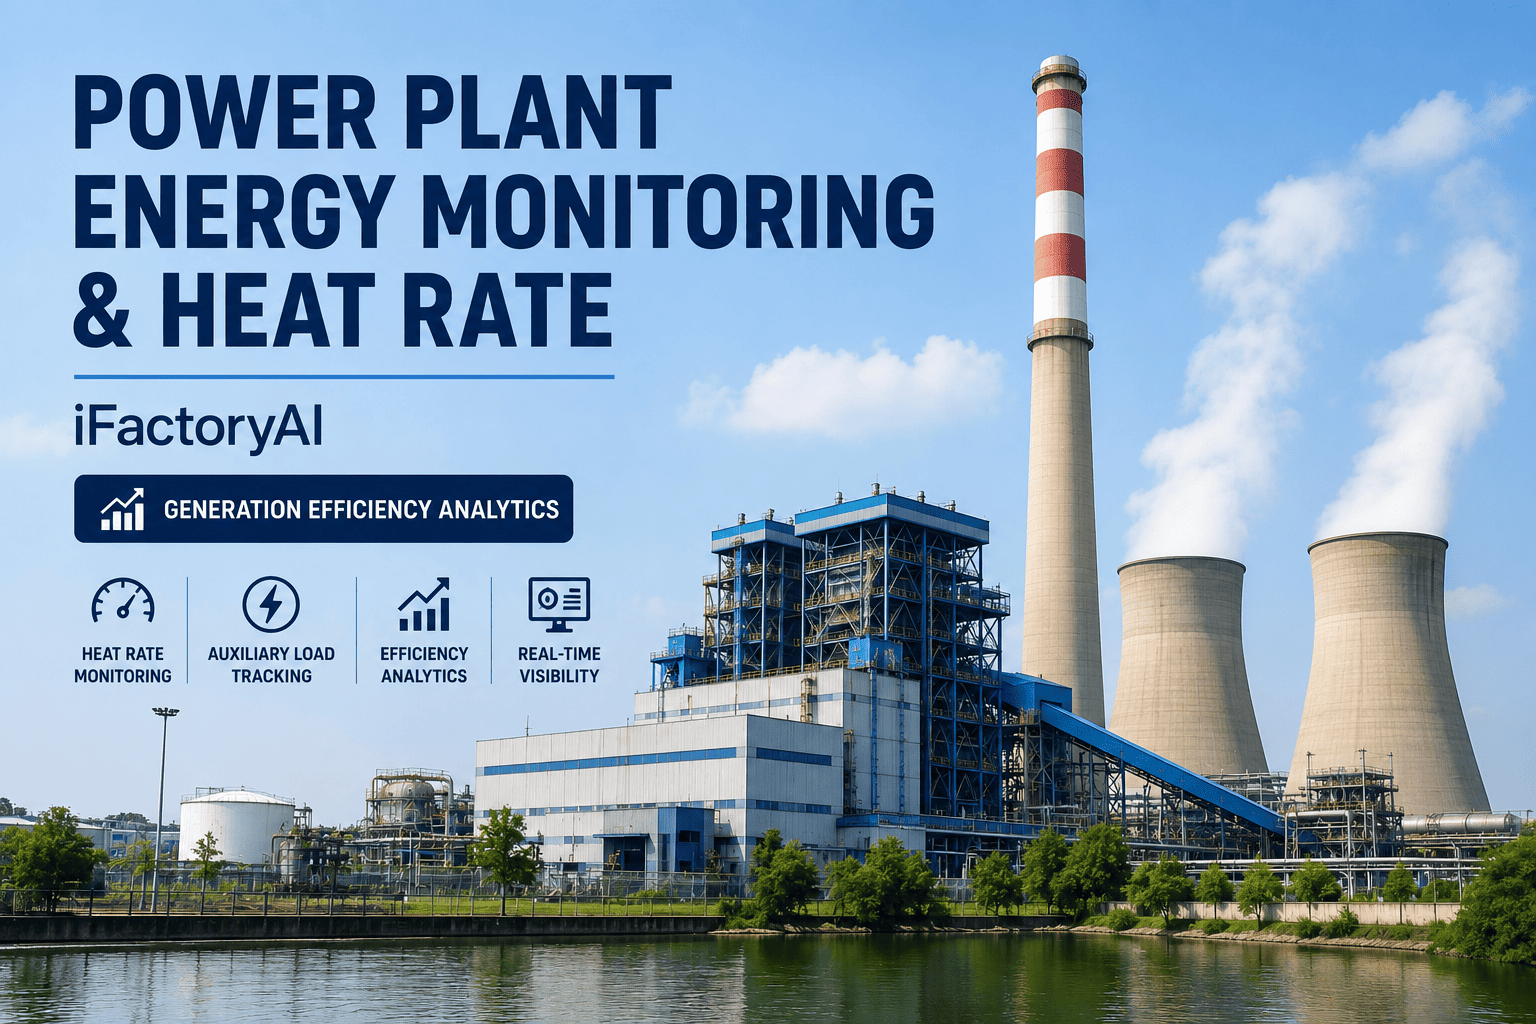
A conventional grid power plant burns fuel at 33% electrical efficiency. The other 67% goes up the stack as waste heat. A boiler on the same site burns more fuel at 80% thermal efficiency to make the hot water and steam the plant actually needs. Add them together and the total system runs about 45% — every unit of useful energy costs more than two units of fuel. A combined heat and power installation running well pushes that same math to 75-80% total efficiency, and the most modern CHP plants reach 90%. That is not a marginal improvement — it is a different economic universe. But CHP economics also live and die on the spark spread, the heat-to-power ratio, and the number of hours per year the load actually calls for both outputs at the same time. A CHP unit running 8,000 hours matched to a real thermal load is a very different asset from the same unit running 4,000 hours because the heat sink is undersized or the electric load doesn't overlap. The plants that capture the full 80% total system efficiency don't do it with a bigger unit — they do it with live visibility on electrical output, thermal utilization, and fuel input at the same time, with spark spread live on the dashboard so operators know every hour whether it's cheaper to run harder or coast. iFactory Generation Efficiency Analytics for CHP is built to run exactly that — total efficiency, effective electrical efficiency, FERC/PURPA compliance, and spark spread economics, all live and all on one screen.
iFactory Generation Efficiency Analytics for CHP
Watch Every Btu Twice — Electrical Output, Thermal Utilization, and Spark Spread Live
Total system efficiency, effective electrical efficiency, FERC/PURPA compliance, and real-time economics — for gas turbines, reciprocating engines, and trigeneration.
75-80%
CHP total efficiency
45%
separate heat + power
5,000+
annual run hours needed
The CHP Efficiency Story in One Diagram
Every kW of electricity has a real thermodynamic cost. The way CHP wins is by refusing to throw away the 60% of fuel energy that shows up as heat. This is what 100 units of fuel actually turn into, side by side.
Conventional: Separate Heat + Power
Fuel input154 units
Electricity from grid30 units
Heat from boiler45 units
Waste (stack + rejection)79 units
CHP / Cogeneration
Fuel input100 units
Electricity generated30 units
Useful thermal recovered45 units
Losses25 units
Total system efficiency
75%
Same 30 units electric and 45 units useful heat delivered — but CHP takes 100 units of fuel instead of 154. The 54-unit gap is where the payback comes from.
The Four Ways to Measure CHP Efficiency
"CHP efficiency" is not one number. Regulators, utilities, and operators all use different formulas, and using the wrong one for the wrong purpose is how CHP projects lose PURPA status or misprice their power sales. All four need to be tracked simultaneously.
Metric 1
Total System Efficiency
(Electric + Thermal) / Fuel
The headline number. Simple and intuitive — how much of the fuel became useful energy of any kind. Best benchmark: 75-80%.
Metric 2
FERC / PURPA Efficiency
(Electric + 0.5 × Thermal) / Fuel
Regulatory. PURPA qualifying facility status requires this to stay above a threshold — usually 42.5%. Losing it costs the tariff.
Metric 3
Effective Electrical Efficiency
Electric / (Fuel − Thermal/0.80)
Economic. Credits the CHP unit for thermal output at boiler-equivalent fuel value. Best-in-class CHP hits 50-70% on this — versus 33% for simple cycle.
Metric 4
Heat-to-Power Ratio
Thermal / Electric
Operational. Determines whether the CHP is sized right for the load. Gas turbine designs 0.5-2.0, reciprocating engines 1.0-2.5, back-pressure steam 4-10.
Want all four running live on your CHP unit? Book a demo — bring one month of fuel, electric, and thermal data.
Where CHP Efficiency Actually Leaks
CHP total efficiency is not lost in the prime mover — modern gas turbines and engines are already near their design point. It's lost in the parts nobody watches: thermal load mismatch, dumped heat, part-load operation, and hours run without a thermal customer.
01
Dumped thermal energy
-20 pts efficiency
Heat recovered from the exhaust but no customer wants it right now — so it goes to the cooling tower. Total efficiency crashes from 78% to 58%. Nobody sees it because electric output is normal.
02
Part-load penalty
-5 to -12 pts
Gas turbines and engines lose efficiency below 70% load. Running at 45% because the electric demand dropped costs 8 percentage points of electrical efficiency alone.
03
Heat-power mismatch
Lost hours
The unit sized for winter thermal load runs half-loaded all summer. Or the electric load never overlaps with the thermal load. Hours accumulate at 55% efficiency instead of 78%.
04
Boiler efficiency drift
-3 to -8 pts
HRSG fouling, deaerator issues, tube scaling — every point of HRSG efficiency loss hits total CHP efficiency directly. Rarely trended between overhauls.
05
Negative spark spread hours
Fuel > power price
Some hours it's cheaper to buy grid power than to burn gas. If you don't know it in real time, you keep running — burning margin instead of making it.
Spark Spread and the CHP Dispatch Decision
Spark spread is what makes CHP economic. It's the difference between what you sell (or offset) electricity for and what your fuel costs to make it — after crediting the thermal output. When spark spread is positive, run harder. When it's negative, coast. Most CHP operators find out after the month closes. Live spark spread turns it into a real-time decision.
POSITIVE SPARK
Run at Full Load
Grid electricity avoided or exported at $85/MWh
Fuel cost per MWh: $48 at current gas price
Thermal credit: $12/MWh from boiler avoidance
Net margin: $49/MWh — every MWh generated is money
Operator signal: push output, defer non-critical maintenance
NEGATIVE SPARK
Reduce or Idle
Grid electricity available at $42/MWh
Fuel cost per MWh: $58 at current gas price
Thermal credit: $12/MWh
Net margin: -$4/MWh — burning margin instead of making it
Operator signal: reduce to thermal-following, import grid electric
What the CHP Dashboard Should Say — All the Time
A CHP unit run well shows six numbers on one screen, live, all the time. Every one of them is a decision, not just a measurement.
Total system efficiency
76.4%
Target: 75-80%
Effective electrical efficiency
62.1%
Target: 50-70%
PURPA efficiency
54.3%
Threshold: >42.5%
Heat-to-power ratio
1.5
Design: 1.4-1.6
Thermal utilization
88%
Target: >85%
Live spark spread
+$37/MWh
Run at full load
How Peak Generation Analytics Runs the CHP Loop
Making CHP pay the full 80% back means running the electrical, thermal, and economic layers together — not as three separate reports.
01
Ingest All Three Streams
Fuel flow, electrical output, and thermal delivery captured live from PLC, DCS, or historian — every unit metered separately.
02
Compute Four Efficiencies
Total, effective electric, FERC/PURPA, and heat-to-power ratio — all recalculated every interval.
03
Overlay Economics
Live gas price, grid electric price, and thermal displacement value integrated to compute real-time spark spread.
04
Dispatch Recommendation
Load setpoint suggested per hour — run full, reduce, or idle — based on spark spread and thermal load forecast.
05
Verify & Audit
PURPA compliance verified continuously. Efficiency and margin tracked per shift, per crew, per month — the audit trail regulators need.
What Live CHP Analytics Deliver
CHP is one of the highest-leverage assets a facility can operate — but only if it's watched the way it deserves. These are the outcomes CHP operators typically see after moving from monthly efficiency reports to live dashboarding.
10-40%
Generation cost cut
vs. separate heat + grid electric
13-18%
GHG reduction
from higher fuel utilization
Live
PURPA compliance
tariff protection continuous
Zero
Negative-spark hours
by acting on real-time economics
Curious what live spark spread would have told you last month? Talk to our CHP team — we'll replay your history against real fuel and grid prices.
Frequently Asked Questions
Which efficiency number should we actually report?
All four — for different audiences. Total system efficiency is the headline for management and marketing. FERC/PURPA efficiency is what regulators care about because it determines qualifying facility status. Effective electrical efficiency is what your finance team needs for economic evaluation because it credits thermal output correctly. Heat-to-power ratio is what operators need because it tells them whether the unit is sized right for the current load. Live analytics track all four simultaneously so nobody has to pick.
How does spark spread work in practice?
Spark spread is the profit per MWh from generating on-site versus buying from the grid, after crediting thermal output. It's a live number: gas price × unit heat rate = fuel cost per MWh; grid electric price − fuel cost + thermal credit = spark spread. When it's positive, running more makes money. When negative, running costs you. Most CHP operators find out after month-end. Live spark spread means the operator sees it every hour — and can dispatch accordingly.
What about trigeneration — does this handle absorption chillers?
Yes. Trigeneration (combined cooling, heating, and power) adds the absorption chiller output to the useful thermal energy calculation. The efficiency math extends naturally: cooling output is credited at absorption COP × thermal input. The heat-to-power ratio effectively becomes (heat + cooling) ÷ power, which usually pushes total useful energy delivery and total system efficiency higher — often into the 85%+ range.
Does this help with PURPA compliance risk?
Directly. PURPA qualifying facility status requires (electric + 0.5 × thermal) / fuel ≥ 42.5% on a continuous basis, and thermal output must be at least 5% of total useful output. Losing QF status means losing the tariff advantage that made the CHP economic in the first place. Live PURPA efficiency tracking, with alerts before the threshold is breached, is compliance protection — not just reporting.
Can we see it running on our own CHP unit first?
Yes. Bring one CHP unit and one month of fuel, electric, and thermal data — plus your gas tariff and electric tariff. We'll compute all four efficiency metrics against actual operation, replay spark spread hour by hour, and show which hours would have called for a different dispatch. Book a demo and we'll walk it live on your numbers.
Stop leaving 30 points of efficiency on the table.
See Live CHP Analytics on Your Own Unit
Bring one CHP unit and 30 days of fuel, electric, and thermal data — plus your gas and electric tariffs. We'll compute total, effective, PURPA, and heat-to-power efficiency live, replay spark spread hour by hour, and show the dispatch decisions your operators would have made differently.
Spark spread
hour by hour