In a rolling mill, energy is the single largest operating cost after raw material — and it's almost entirely invisible until the monthly utility invoice lands, long after the waste occurred. The numbers are unforgiving: hot rolling runs 50 to 80 kWh per ton, cold rolling climbs to 150 to 300 kWh per ton under higher deformation forces, and reheat furnaces alone account for 40 to 60 percent of a mill's total energy. Yet most mills manage all of it off one plant-level meter that can't say which stand, which drive, or which furnace zone is bleeding. The recoverable margin is real and specific — misaligned rolls and worn bearings quietly add 3 to 9 percent to specific electrical energy per ton, clogged burners add 5 to 12 percent to furnace fuel, and none of it shows up as an alarm. The mills pulling ahead measure energy where it's consumed: submetered per equipment, tracked as kWh per ton against a baseline, with every deviation tied to a cause. That's the difference between paying the invoice and managing it. To see equipment submetering on your hot or cold mill, book a demo.
STEEL & METALS · ROLLING MILL ENERGY MONITORING
Measure Energy Where It's Consumed — Per Stand, Per Drive, Per Ton.
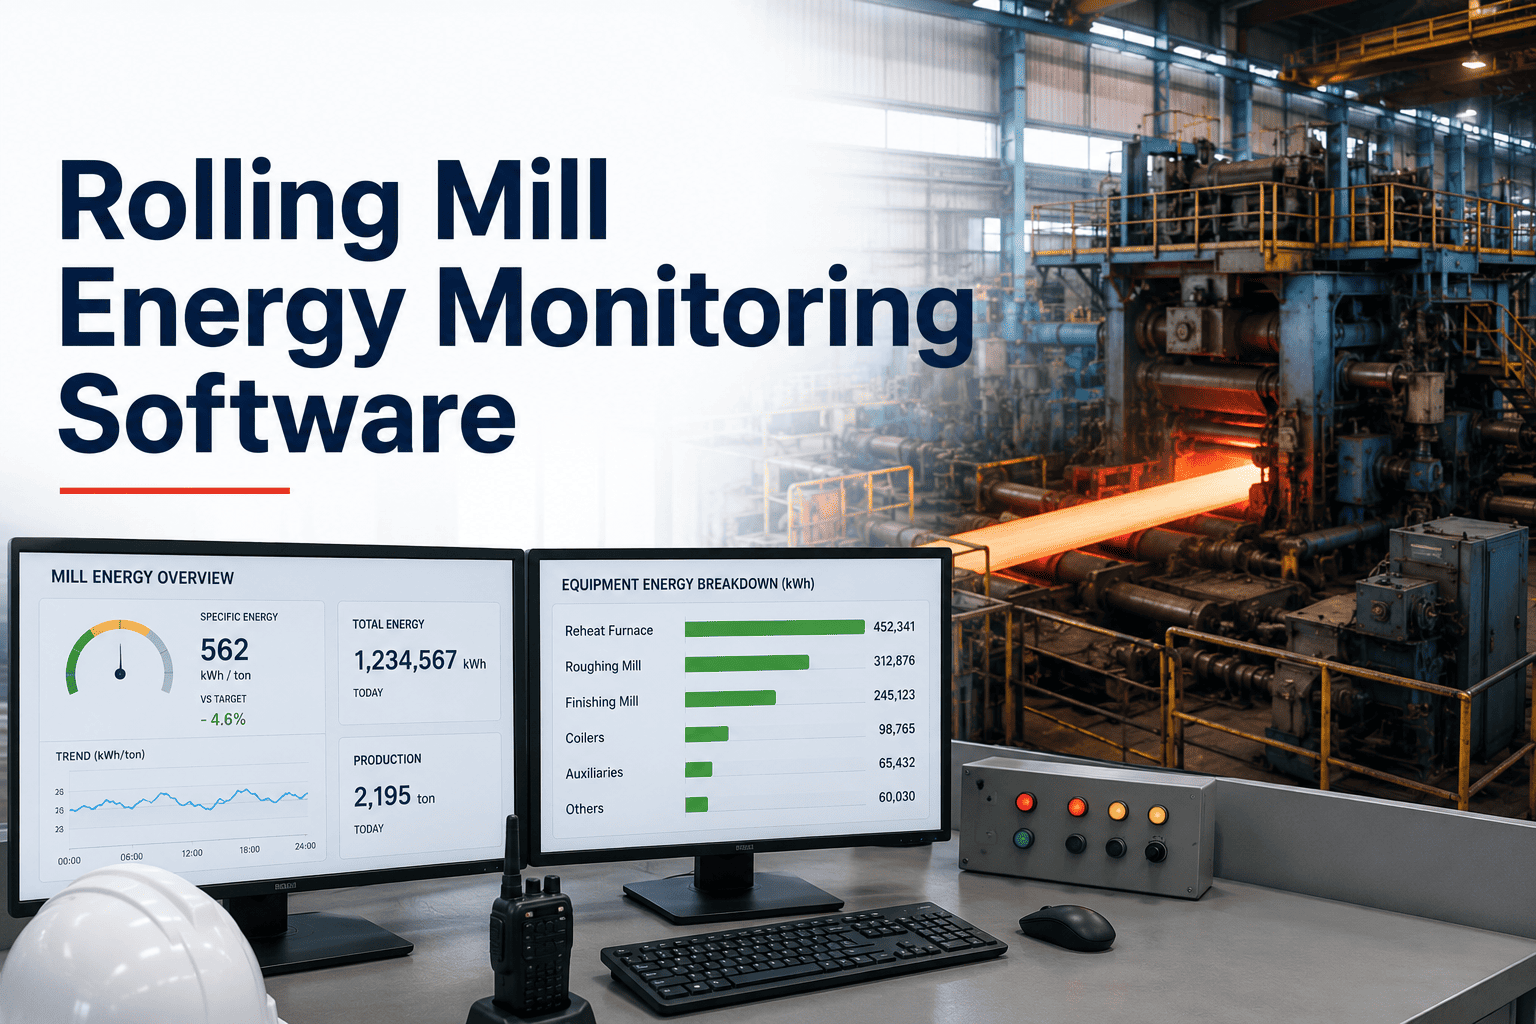
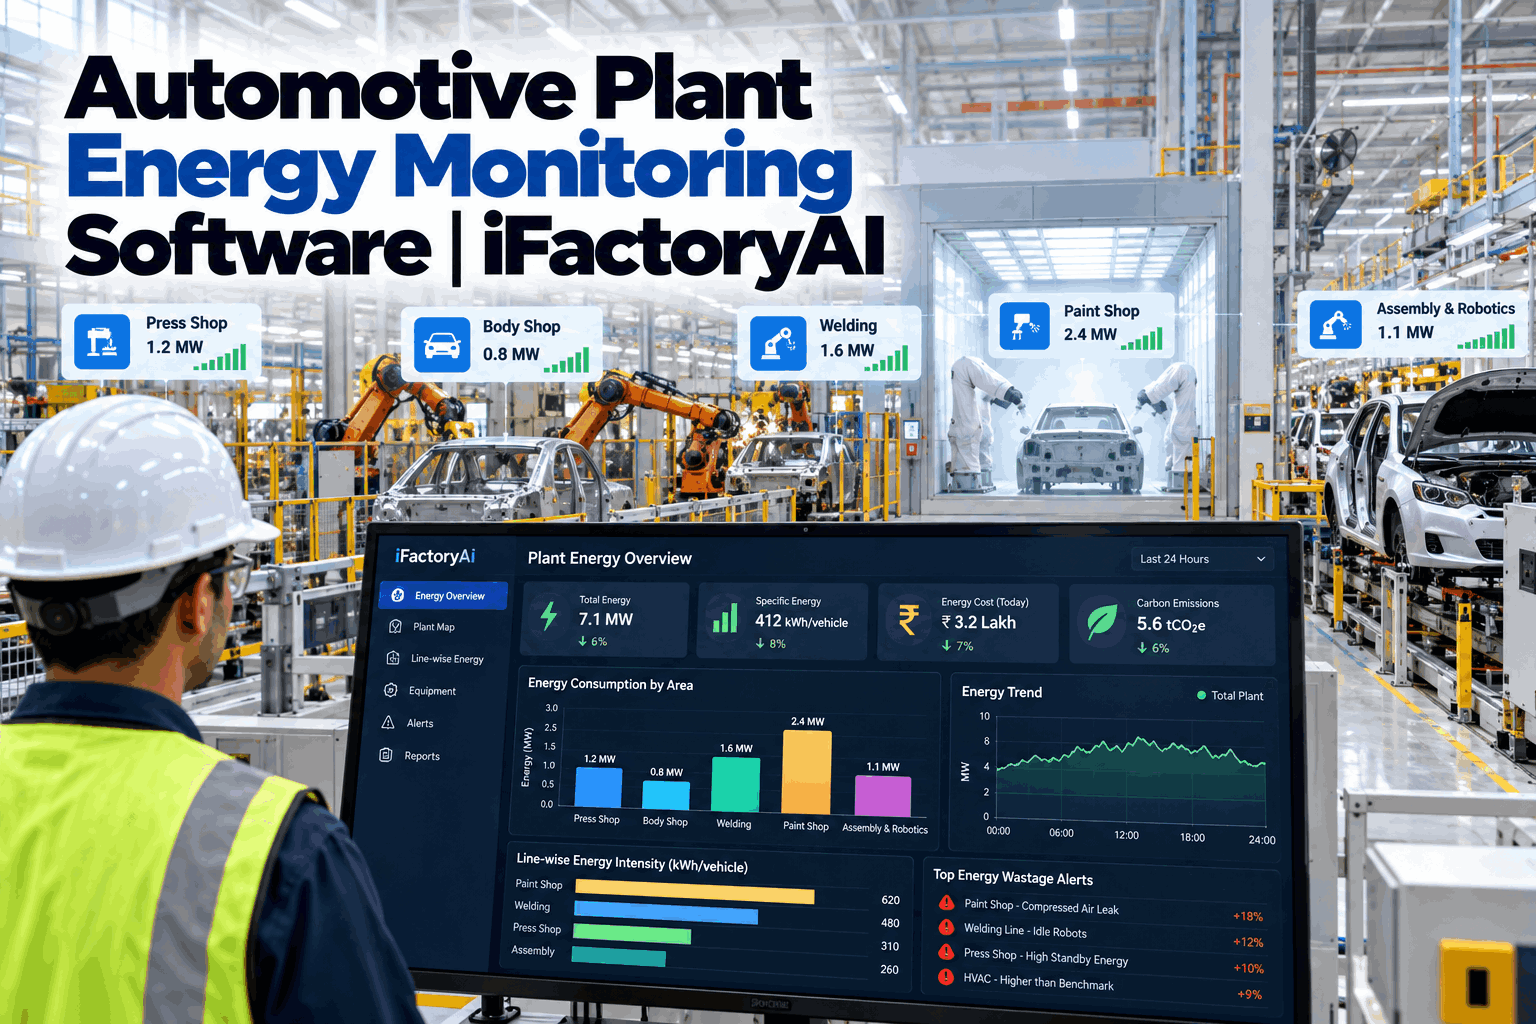
A plant-level meter can't tell you which mill stand is drifting or which furnace zone is over-firing. iFactory's equipment submetering tracks motor loads, reheat furnaces, and drive energy in real time as kWh per ton of rolled steel, surfacing the misaligned drive and the over-fired burner while they're still a few percent — not after they've moved the monthly bill.
50–80
kWh/ton for hot rolling — much higher for cold
40–60%
Of mill energy consumed by reheat furnaces alone
3–9%
Specific energy added per ton by misaligned drives
15–25%
Of total plant electricity used by rolling operations
Why Rolling Mill Energy Waste Stays Hidden
The energy penalty in a rolling mill is real, but it hides for a structural reason: the mill is measured as a whole while it wastes energy in parts. A single plant-level meter sums the reheat furnace, every mill-stand drive, the hydraulics, and the auxiliaries into one figure that can't be diagnosed — so an inefficiency at one stand or one burner zone disappears into the total until it's large enough to move the monthly bill. By then the waste is months old and untraceable. For a mill manager or energy engineer, the frustration is knowing the losses are there without any way to attribute them.
One Meter, Many Consumers
The reheat furnace, the roughing and finishing stands, the coilers, the hydraulics, the run-out cooling — each has its own energy signature, but a plant-level meter blends them into a single number. Drift at any one of them is invisible against the whole, so the specific asset driving the overconsumption can't be identified from the total alone.
The Invoice Arrives Too Late
Energy waste appears on the utility invoice long after the inefficiency happened — a misaligned drive has already wasted electricity on every ton for weeks before the bill reflects it. Managing energy off a monthly statement means always reacting to a cost that's already been fully incurred, never preventing it.
Maintenance Losses Are Silent
Misaligned rolls, worn bearings, and inadequate lubrication each raise specific electrical energy per ton by several percent, and clogged burners or degraded refractory add just as much to furnace fuel — all without tripping anything. These are slow, silent slopes that a spot check misses and only continuous, per-asset trending catches early.
The Meter and the Shift Report Disagree
Two identical coils, same grade and schedule, can run at very different energy per ton — and nobody knows why until the shift report, by which point many more have run. The gap between what the meter is doing right now and what the report shows later is exactly where the recoverable margin lives, per campaign and per crew.
Energy is typically 20 to 40 percent of steel production cost, and poor maintenance directly drives energy overconsumption — a mill with misaligned drives wastes electrical energy on every ton it rolls, and a reheat furnace with clogged burners burns more fuel per tonne than it should. The losses aren't mysterious; they're just unmeasured at the level where they occur.
Where the Energy Actually Goes
Optimizing a mill's energy starts with knowing how it divides, because the biggest lever isn't always where attention goes. Rolling mill energy splits into thermal (the reheat furnace, overwhelmingly) and electrical (the drives, dominated by the main motors), and each has its own waste modes and its own monitoring signature. These are the four consumers that equipment submetering has to resolve individually.
REHEAT FURNACE
Specific fuel consumption (GJ/t)
The single largest energy consumer in the mill, accounting for 40 to 60 percent of total consumption and burning 1.0 to 1.8 GJ per ton of steel reheated to bring billets and slabs to 1,150–1,250°C. The waste modes are well known: burner misalignment, air-fuel ratio drift, degraded recuperator performance, poor insulation, and scale buildup — each independently raising specific fuel consumption by 5 to 12 percent. Because heating a cold-charged billet costs orders of magnitude more than the deformation itself, furnace efficiency and hot-charging discipline dominate the mill's energy economics.
MAIN DRIVE MOTORS
Power per ton & non-work torque
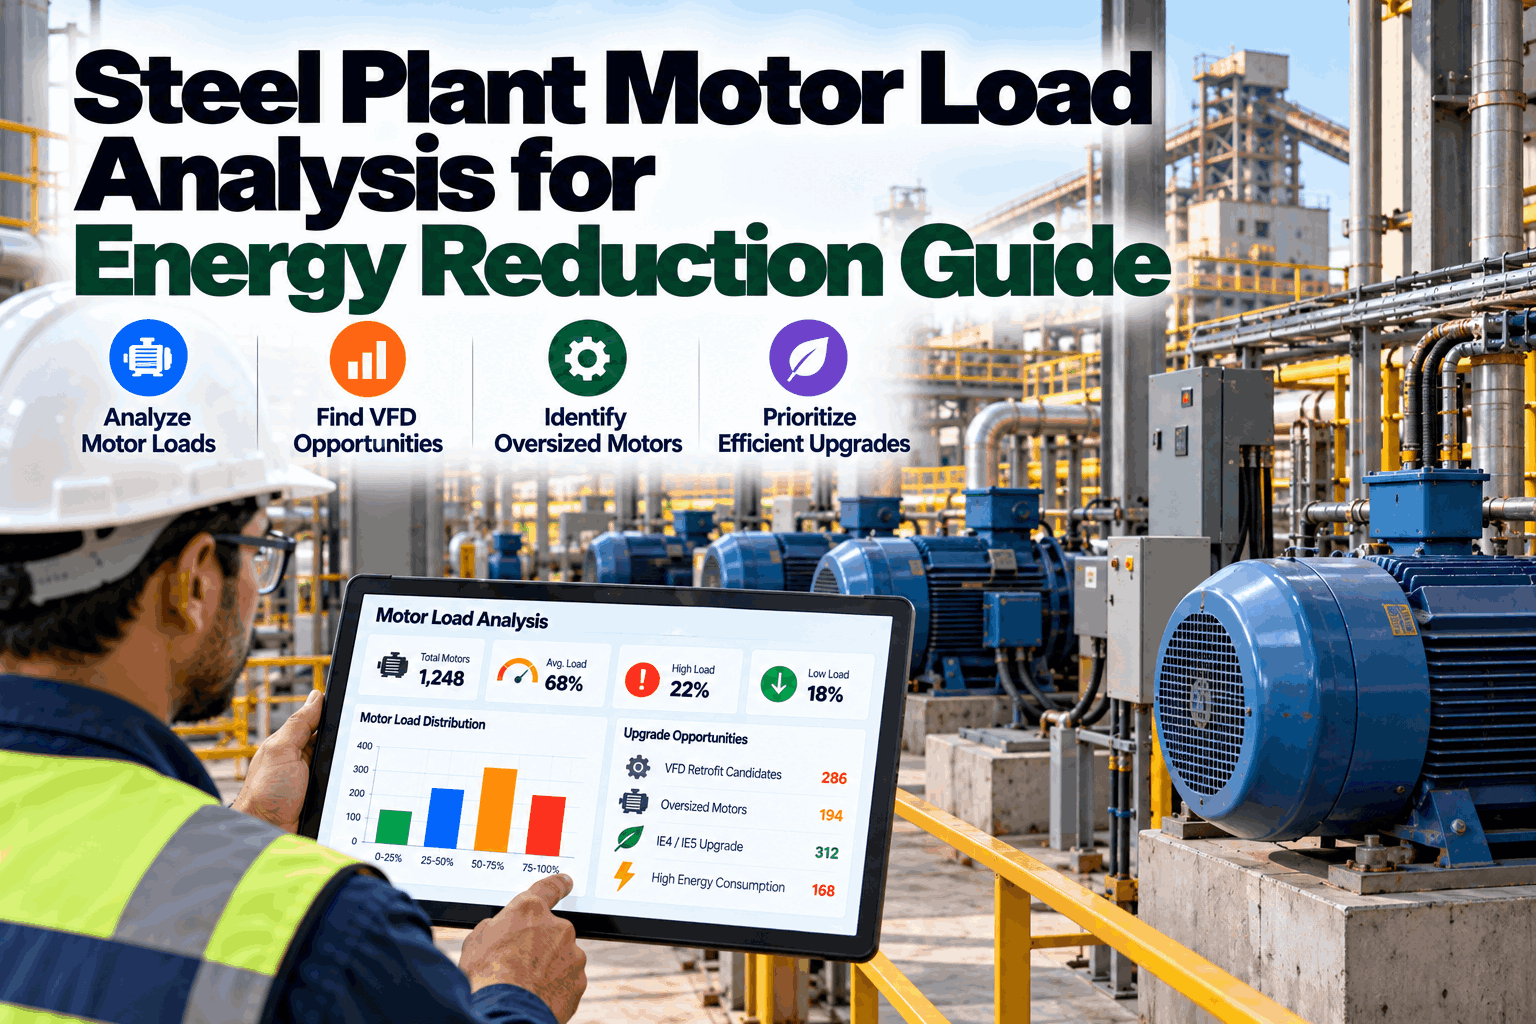
The main mill-stand drives are the dominant electrical load, and main-motor efficiency has the largest single impact on total power consumption — a difference that alone can move overall consumption by 5 to 8 kWh per ton. Analyzing the drive-motor electrical waveform isolates "non-work torque" — energy lost to friction, misalignment, and electrical losses rather than useful rolling — which points maintenance straight at the mechanical issue inflating the power-per-ton cost. Winding hotspots and harmonic losses add further recoverable draw.
COLD MILL DEFORMATION
kWh/ton vs reduction schedule
Cold rolling consumes far more per ton than hot — 150 to 300 kWh per ton — because deformation at ambient temperature demands much higher forces and tighter precision. Here the energy is tied directly to the reduction schedule and pass design, and pass-design inefficiency alone can raise energy use by 8 to 12 percent. Monitoring energy per ton against the reduction schedule reveals where the pass sequence is costing more than the target thickness requires.
AUXILIARIES & LOSSES
Yield, scale & idle draw
Hydraulics, cooling systems, pumps, compressed air, and run-out tables carry a meaningful share of the electrical load, and energy per ton is strongly linked to yield — poor oxidation control pushing scale loss above 3 percent means energy spent on steel that never becomes product. Idle and off-schedule draw, compressed-air leaks, and worn-impeller pump losses round out the auxiliaries, each small alone but material in aggregate across a running mill.
Find the kWh/Ton Hiding in Your Mill
Bring your mill configuration and a recent energy bill to the call. iFactory engineers will show how equipment submetering resolves the reheat furnace, the drive motors, and the auxiliaries into per-asset kWh/ton — and where the misaligned drive or over-fired burner is inflating your cost per rolled ton.
Equipment Submetering: Energy Per Ton, Per Asset
The core shift is from one plant meter to per-equipment measurement expressed in the unit that matters — kWh per ton of rolled steel, attributed to the specific asset that consumed it. That attribution is what turns energy from an undiagnosable total into a managed, asset-level metric, and it's what makes every downstream insight possible.
01
Meter Each Major Consumer Separately
The reheat furnace, each main drive, the coilers, and the auxiliary loads are submetered individually, so consumption is measured where it happens rather than summed into a plant total. Each asset becomes its own tracked energy consumer with its own signature, the precondition for attributing any deviation to a cause.
02
Express Everything as kWh/Ton
Raw kW draw means little without production context, so energy is normalized to kWh per ton against live throughput — the metric that links directly to production economics. A drive's power-per-ton and a furnace's GJ-per-ton become the currency of the whole program, comparable across shifts, grades, and campaigns.
03
Baseline Every Asset
Each asset's efficient kWh/ton is established as its documented baseline, so the system knows what "good" looks like for that specific drive or furnace under normal operation. Every future reading and every maintenance action is measured against this reference, making both drift and improvement visible and quantifiable.
04
Attribute the Deviation to a Cause
When an asset drifts above its baseline, the system flags which one and how much — the finishing-stand drive climbing from a bearing issue, burner zone three over-firing from air-fuel drift. The overconsumption is no longer a mystery in the monthly total but a specific, attributable, actionable signal.
The power of per-ton attribution is that it works at the resolution decisions are actually made — per asset, per shift, per campaign. When the same coil can run at very different energy per ton, only asset-level, real-time measurement can catch the difference while there's still something to do about it.
Every Energy Loss Has a Maintenance Root Cause
The deepest value of energy submetering in a rolling mill is that it connects consumption directly to equipment condition — because in a mill, energy waste and mechanical degradation are usually the same problem seen from two angles. A drive drawing above baseline isn't just an energy line item; it's a bearing, an alignment, or a lubrication issue announcing itself through the power meter.
DRIVE SIDE
Power Draw Reveals Mechanical Wear
Misaligned rolls, worn bearings, and inadequate lubrication each raise specific electrical energy per ton by 3 to 9 percent, and all of it is detectable from drive-current monitoring. The non-work-torque signature in the drive waveform points maintenance precisely at the friction or misalignment inflating the power-per-ton — so the energy signal becomes an early mechanical diagnostic, weeks before the wear would otherwise surface.
FURNACE SIDE
Fuel Rate Reveals Combustion Faults
Burner misalignment, air-fuel ratio drift, refractory degradation, and scale buildup each raise furnace fuel consumption by 5 to 12 percent, showing up as specific fuel consumption climbing above the zone's baseline. Trending GJ per ton per zone surfaces the burner block that needs cleaning or the recuperator that's underperforming — turning the fuel meter into a combustion-health monitor.
This is why energy monitoring and maintenance belong in one loop, not two. When an asset crosses its efficiency baseline, the system generates a maintenance work order with the energy data and probable cause attached, and after the fix, post-intervention consumption is measured against the pre-fault baseline to prove the saving — closing the gap between energy data and the corrective action that captures it, with a full audit trail for ESG reporting.
The Optimization Levers Submetering Unlocks
Once energy is resolved per asset and per ton, specific, proven levers become actionable — each one measurable against its baseline so the saving is verified, not assumed. These are the recurring wins that per-ton visibility surfaces in hot and cold rolling operations.
01
Reheat Furnace & Hot Charging
Optimizing furnace temperatures, tightening air-fuel ratios, and recovering waste heat can cut fuel consumption by 15 to 25 percent, and increasing hot charging avoids re-heating cold billets from ambient — the single most expensive energy step in the mill. Per-zone GJ/ton tracking is what makes these gains visible and defensible.
Main Motor & Drive Efficiency
02
Because main-motor efficiency has the largest impact on electrical consumption, correcting the alignment, bearing, and lubrication issues that non-work-torque analysis exposes recovers energy on every ton rolled. Regenerative drives that return braking energy to the grid add another lever the submeter can quantify.
03
Pass Design & Reduction Schedule
Improper pass design can raise energy use by 8 to 12 percent, so tracking kWh/ton against the reduction schedule reveals where the pass sequence costs more than the target thickness requires. In cold rolling especially, this is where a large share of the deformation energy is either well spent or wasted.
04
Yield, Scale & Downtime
Controlling oxidation to keep scale loss in check means less energy spent on steel that never ships, and predictive maintenance that reduces unplanned downtime cuts the energy waste of stops and restarts. Every point of yield and every avoided downtime event shows up directly in energy per shipped ton.
Turnkey, On-Premise, Works With Legacy Mills
Rolling mills run mixed generations of equipment and can't shut down for a control-system overhaul. iFactory is built to bridge that gap — instrumenting legacy stands without a multi-million-dollar automation replacement, running on-premise, and sitting on top of existing automation rather than replacing it.
1
Smart Sensors on Legacy Stands
Smart sensors install on older mill stands and connect through an edge gateway, bringing modern energy and condition analytics to legacy assets without a multi-million-dollar automation overhaul — so an aging mill gets per-asset visibility without being rebuilt.
2
Sits on Top of Existing Automation
The platform integrates with existing mill and furnace automation through standard connections like OPC-UA, Modbus, and historian links, reading drive current, furnace, and production data without replacing current control systems or interrupting the line.
3
Baselines in a Short Learning Phase
A standard mill deployment runs in a matter of weeks, including sensor installation, edge-gateway setup, and a learning phase where the system baselines the unique energy, vibration, and thermal characteristics of your specific rolling cycles — so the analytics fit your mill, not a generic template.
4
On-Premise, Work Orders Built In
The platform runs on-premise inside your network, and anomaly-triggered work orders route to maintenance with energy context attached, with post-fix verification quantifying each saving — connecting energy analytics to the maintenance workflow that actually captures the value.
What Changes for the Mill Team
Equipment submetering changes the mill team's relationship with energy from explaining last month's bill to managing this shift's consumption — and gives maintenance a new early-warning diagnostic in the power meter itself.
01
Every Asset Has a Power-Per-Ton Number
Instead of one plant bill, each furnace zone and drive carries its own kWh/ton against a baseline, so an over-firing burner or a drifting drive is a specific, attributable signal. The team diagnoses the exact asset instead of guessing at a total that never resolves.
02
The Power Meter Warns of Wear Early
Because rising drive energy signals a bearing, alignment, or lubrication problem, the team catches mechanical degradation through the energy signature weeks before it would surface as a fault — turning the submeter into a predictive-maintenance sensor as well as an energy one.
03
Savings Are Verified, Not Assumed
Post-intervention consumption measured against the pre-fault baseline gives every energy-related work order a proven saving in kWh/ton, turning maintenance from a cost argument into a documented ROI record — and generating the audit trail ESG reporting now demands.
04
Crews See Energy Per Campaign
With energy attributed per shift and per campaign, the team can see why two identical runs consumed differently and standardize toward the efficient practice — closing the gap between the real-time meter and the shift report where the recoverable margin has always lived.
Frequently Asked Questions
The questions steel mill managers and energy engineers ask most often when evaluating rolling mill energy monitoring.
We already have a plant energy meter. Why submeter individual equipment?
Because a plant meter tells you the mill spent more, not which asset caused it. The reheat furnace, every mill-stand drive, the coilers, and the auxiliaries each have their own energy signature, and a single total blends them so completely that drift at one stand or one burner zone is invisible until it's large enough to move the whole bill — by which point months of waste are spent and untraceable. Equipment submetering measures each major consumer separately and expresses it as kWh per ton, so an inefficient asset becomes a specific, attributable signal rather than a mystery in the aggregate. That attribution is the precondition for every saving, because you can't fix a loss you can't locate. To see per-asset resolution on your mill,
book a demo.
How does energy monitoring help with maintenance?
In a rolling mill, energy waste and mechanical degradation are usually the same problem seen two ways. Misaligned rolls, worn bearings, and inadequate lubrication each raise specific electrical energy per ton by 3 to 9 percent, and all of it is detectable from drive-current monitoring — so a drive drawing above its baseline is a mechanical issue announcing itself through the power meter, often weeks before it would surface as a fault. Analyzing the drive waveform isolates non-work torque, the energy lost to friction and misalignment, which points maintenance precisely at the mechanical cause. On the furnace side, rising specific fuel consumption flags burner or refractory problems the same way. When an asset crosses its baseline, the system generates a work order with the energy data and probable cause attached, so energy monitoring effectively doubles as an early-warning predictive-maintenance layer.
Will this work on our older mill, or do we need a full automation upgrade?
It's specifically designed to bridge the gap for legacy assets without a rip-and-replace. Smart sensors install on older mill stands and connect through an edge gateway, bringing modern per-asset energy and condition analytics to equipment that predates modern automation — no multi-million-dollar control-system overhaul required. Where automation does exist, the platform integrates through standard connections like OPC-UA, Modbus, and historian links, sitting on top of your current systems rather than replacing them. This means an aging mill can get kWh-per-ton visibility, non-work-torque diagnostics, and baseline tracking without being rebuilt, and the deployment doesn't interrupt the line. The result is modern energy intelligence on the mill you already run, at a fraction of the cost and disruption of an automation replacement.
What's a realistic energy saving, and how fast?
The levers are well documented and add up quickly once energy is visible per asset. Reheat furnace optimization and heat recovery can cut fuel 15 to 25 percent, correcting the drive issues that non-work-torque analysis exposes recovers several percent of electrical energy per ton, and better pass design saves another 8 to 12 percent where it applies. Real deployments have moved specific energy consumption substantially — one integrated steel operation cut specific consumption from over 400 to just above 300 kWh per ton within about a year. The exact result depends on your starting efficiency, mill configuration, and product mix, and because every saving is measured against a documented baseline, you get verified numbers rather than estimates. With energy often 20 to 40 percent of production cost, even modest percentage gains represent large absolute savings, which is why energy-optimization ROI on mills is frequently measured in months to a couple of years. Contact
iFactory support to size the opportunity for your operation.
Does our production and energy data leave the plant?
No — the platform runs on-premise inside your own network, so drive-current, furnace, and production data stays within your firewall rather than being sent to an external cloud. For a steel producer, operational data is competitively sensitive, and a sovereign, on-site architecture keeps it entirely in your control. The system connects to your existing automation and meters locally, runs its analytics on-premise, and routes anomaly-triggered work orders into your maintenance workflow without any dependency on external connectivity. This matters both for data security and for the resilience a continuous rolling operation demands — the monitoring keeps working regardless of internet availability, and nothing about your mill's energy profile, production rates, or process configuration leaves the building. Contact iFactory support to review the on-premise deployment against your site's IT and OT requirements.
STOP MANAGING MILL ENERGY OFF A MONTHLY INVOICE
Track Energy Per Stand, Per Furnace, Per Ton — and Cut Consumption Where It Hides.
Equipment submetering across reheat furnaces, main drives, and auxiliaries, normalized to kWh per rolled ton, baselined per asset, with non-work-torque diagnostics and verified savings — turnkey, on-premise, working with legacy mills through smart sensors. Turn energy from an untraceable monthly total into a managed, attributable, provable cost per ton.