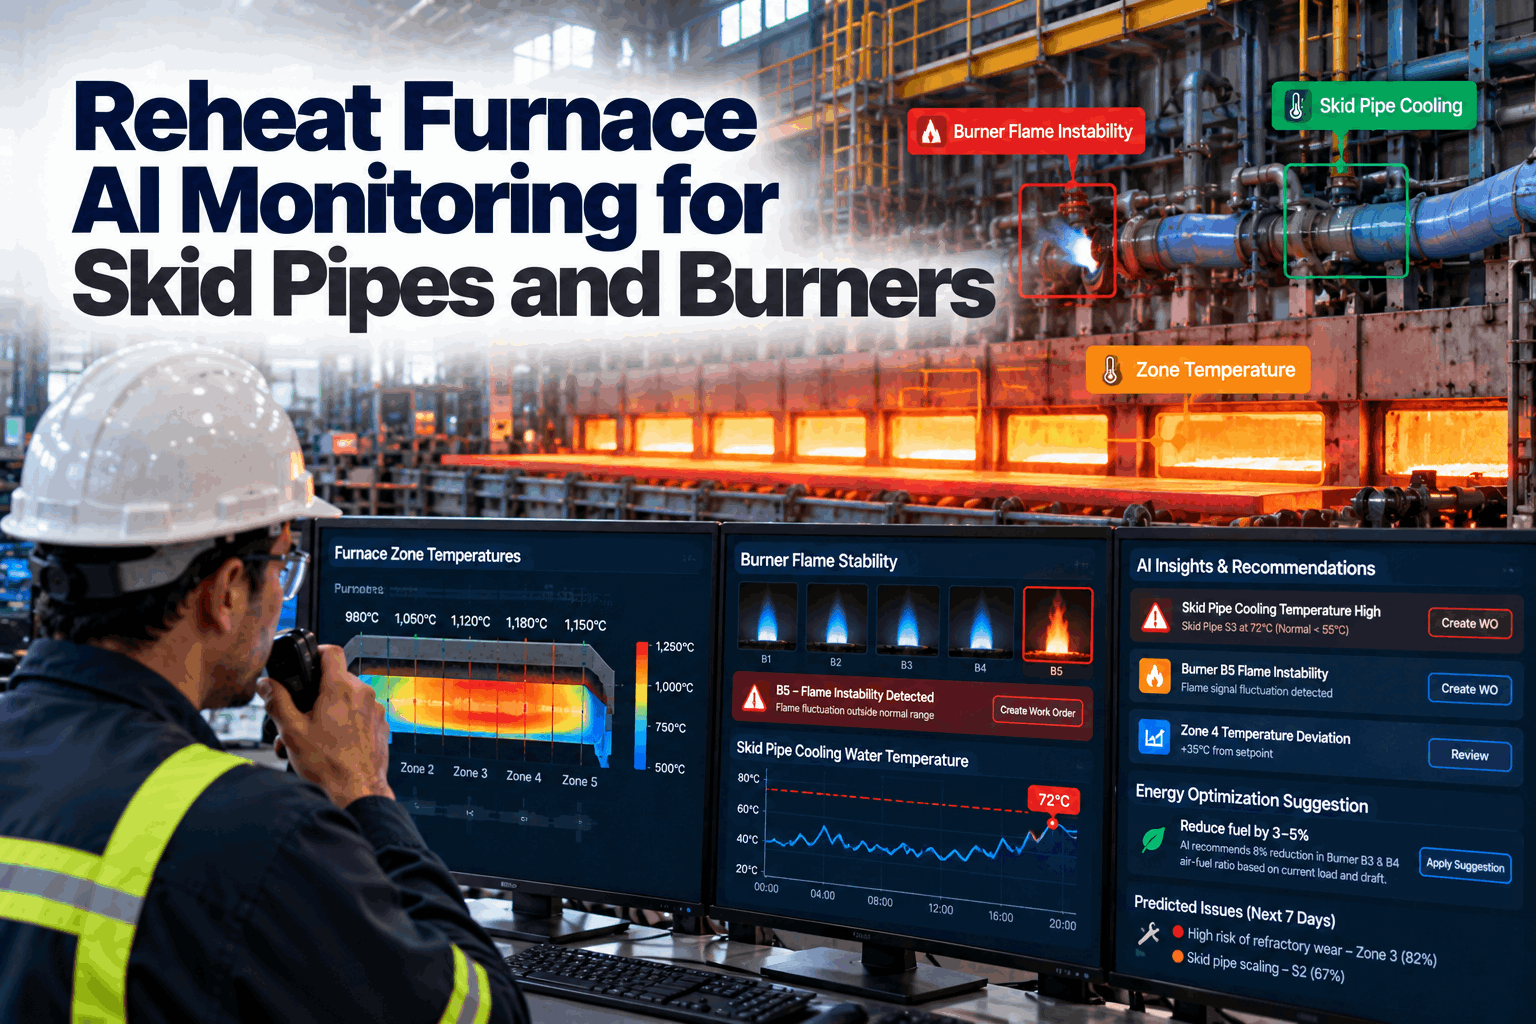
A reheat furnace rarely fails all at once. Skid insulation falls away a piece at a time, a burner flame starts to flicker, one zone runs a little cooler than the model says it should. Each change is small, but together they raise fuel per ton, leave skid marks on slabs and shorten the time to the next refractory repair. Reheat furnace AI monitoring watches skid pipe cooling, burner flame stability and zone temperatures against a thermal model of the furnace, so mills fix problems early, in planned stops. Start with a furnace review.
Reheat Furnace AI Monitoring for Skid Pipes and Burners
A thermal model of every zone compares expected and actual behaviour. Skid cooling, flame stability and zone temperatures are watched together, so small drifts become planned work instead of lost heat.
- What skid cooling water tells you about insulation
- Burner flame stability and combustion drift
- Zone models, anomalies and fuel per ton
Why Reheat Furnace Problems Hide for So Long
The furnace keeps heating slabs, so small losses go unnoticed.
A reheat furnace is controlled to deliver slabs at the right discharge temperature. When skid insulation is lost or a burner drifts, the control system simply fires harder to compensate. The slabs still come out hot enough, so nobody sees a problem, but the fuel bill rises, cooling water carries away more heat and the refractory works harder. By the time the drift is large enough to notice on a trend screen, the damage has often spread and the repair needs a longer outage than it would have a few weeks earlier. Our furnace specialists can review what your furnace data already shows.
Control masks drift
Firing rises to cover losses, so output looks normal.
Skid marks
Cold spots from skid contact cause rolling variation.
Burner wear
Tips and blocks degrade gradually.
Late repairs
Problems found at the next long outage, not the next stop.
Skid Pipe Cooling: What the Water Tells You
Every kilowatt the skid water carries away was meant for the steel.
Skid pipes support slabs through the hottest zones and are cooled by water. Their refractory insulation limits how much heat the water removes. When insulation cracks or falls away, the heat taken by that cooling circuit rises. Measuring flow and the temperature rise on each circuit gives a direct reading of heat load. A circuit whose heat load climbs at steady production is the clearest sign of insulation loss. Map your cooling circuits with our instrumentation team.
Skid heat load changes with throughput and furnace temperature. Compare each circuit with its own history at similar conditions, and with its neighbours, so a real insulation loss stands out from normal changes in production.
Burner Flame Stability and Combustion
A burner that drifts wastes fuel long before it trips.
Flame scanners, air and fuel flows, and flue gas oxygen together show how well each burner and zone is burning. A flickering flame signal, a creeping air to fuel ratio or rising excess oxygen point to worn burner tips, blocked air passages or control valve problems. Combustion safeguards on industrial furnaces, such as those covered by NFPA 86 in the US, stay in charge of safety. The AI only watches for drift and recommends corrective action. Review combustion data with our combustion team.
The Zone Thermal Model
Know what each zone should be doing, then see where it is not.
A thermal model of the furnace, often called a digital twin, predicts zone temperatures and fuel demand for the current slab mix, throughput and firing. Comparing the model with actual readings separates normal changes from real anomalies. When the slab mix or throughput changes, the model's expectations change with it, so the system does not raise false alarms every time the mill rolls a different product. A zone that needs more fuel than the model expects, or runs cooler for the same firing, has a problem worth finding. See a zone model in a live demo.
Predict
Expected zone temperatures and fuel.
Compare
Actual readings against the model.
Isolate
Skid, burner, wall or door as the cause.
Draft
Work order with evidence and timing.
Recommend
Burner trims for fuel per ton.
Find Furnace Losses Before the Fuel Bill Does
Skid cooling, burner stability and zone behaviour watched against a thermal model, with anomalies turned into planned work.
From Anomaly to Planned Repair
Most furnace repairs can wait for a short stop if you know about them early.
When the model finds an anomaly, the AI drafts a work order with the zone, the likely cause, the evidence and how fast the problem is growing. Planners can then fit skid insulation repair, burner work or door seal replacement into the next mill stop, instead of finding the damage during a long outage. Ask our planning team how work orders reach your CMMS.
Burner Trims and Fuel per Ton
Recommendations for the engineer, not hidden changes to the furnace.
The energy agent looks for burners and zones running with more excess air or uneven firing than they need, and recommends small trims to air to fuel ratio or zone balance. Each recommendation shows the expected effect on fuel per ton and the evidence behind it. Trims stay inside limits agreed with your combustion engineers, and any trim that does not deliver the expected result is reversed and noted, so the agent learns which changes work on your furnace. An engineer approves it before it is applied, and the result is tracked afterwards. Discuss approval rules with our energy team.
What the energy agent does
- Finds zones with excess air or uneven firing
- Recommends trims with expected savings
- Tracks fuel per ton before and after
- Flags recommendations that did not help
What it never does
- Bypass flame safeguards or interlocks
- Change settings without approval
- Override discharge temperature targets
- Act outside agreed trim limits
Skid Marks and Rolling Quality
Furnace health shows up in the mill, not just the fuel bill.
Where slabs rest on water-cooled skids, they stay cooler than the rest of the slab. These skid marks cause temperature variation along the length, which the rolling mill sees as changes in rolling force and can turn into thickness or width variation in the finished product. Lost skid insulation makes skid marks worse. Linking skid heat load with mill data helps teams see the connection. Explore mill links with our process team.
Skid heat load rises
Insulation loss on a circuit takes more heat from slabs at contact points.
Skid marks deepen
Larger temperature dips where the slab sat on the skid.
Force variation
Rolling force swings at regular intervals along the bar or strip.
Data a Reheat Furnace Model Needs
Most of it is already in your level 1 and level 2 systems.
Reheat furnaces are usually well instrumented. The work is in bringing the data together and adding a few sensors where gaps exist, such as flow and temperature on individual skid circuits. Check your instrument coverage with our engineering team.
Burner data
Fuel and air flows, flame signals, flue gas oxygen.
Zone temperatures
Thermocouples by zone and roof, furnace pressure.
Skid circuits
Flow and inlet and outlet temperature per circuit.
Slab tracking
Slab size, grade, charge and discharge temperature.
Reheat Furnace Monitoring Mistakes to Avoid
More data does not help if nobody can act on it.
These are common problems in furnace monitoring projects. A short readiness review can avoid them.
What works
- Heat load per skid circuit, not just total water
- Comparing zones with a model, not fixed limits
- Anomalies turned into planned work orders
- Engineer approval on every burner trim
What fails
- Alarms on raw temperatures only
- Ignoring changes in production mix
- Findings left for the annual outage
- Automatic changes to combustion settings
How iFactory Runs Reheat Furnace AI Monitoring
Predictive AI and Digital Twin, on your own network.
iFactory builds a thermal model of your furnace zones, compares expected and actual behaviour, turns anomalies into work orders and lets the energy agent recommend burner trims to cut fuel per ton. It runs on an on-prem AI server inside your mill and reads data from your level 1 and level 2 systems. Fit questions go to our solutions team.
Zone digital twin
Expected versus actual for every zone.
Skid heat load
Per circuit, against its own baseline.
Flame stability
Burner signals and combustion drift.
Automatic work orders
Anomalies drafted with evidence.
Energy agent
Burner trims recommended for approval.
Safe by design
Combustion safeguards never bypassed.
Results depend on your furnace design, instruments and operating practice. We measure skid heat loads, anomalies found and fuel per ton on your own data during the pilot, rather than promising a general figure.
Turnkey AI: Delivered, Connected and Live in 6–12 Weeks
You do not build this. It arrives ready.
iFactory ships as a pre-configured NVIDIA AI server with the software pre-loaded, racked and ready. Rack it, plug in power and Ethernet, and the AI is live on your network. Our team handles cabling, network setup, PLC, SCADA, DCS and CMMS integration, level 1 and level 2 links, operator training and 24×7 remote monitoring. Data stays on your network. For a scope matched to your plant, request a turnkey quote.
Ship, network and data
Server installed. Furnace, combustion, cooling and slab tracking data connected.
Model training and pilot
Zone model tuned to your furnace. Anomaly and trim rules tested with engineers.
Go-live and training
Monitoring live. Furnace and reliability teams trained. 24×7 monitoring begins.
Frequently Asked Questions
What is reheat furnace AI monitoring?
It is the use of AI and a thermal model to watch skid cooling, burner performance and zone temperatures, find anomalies early and recommend repairs or burner trims.
How does skid cooling show insulation loss?
The heat carried away by each skid cooling circuit rises when insulation is lost. Flow and temperature rise per circuit give a direct measure of that heat.
What is a furnace digital twin?
A thermal model that predicts zone temperatures and fuel demand for current conditions, so actual readings can be compared with what is expected.
Will the AI change our burner settings?
No. It recommends trims with their expected effect. An engineer approves before anything changes, and combustion safeguards are never bypassed.
Does it work on pusher and walking beam furnaces?
Yes. The model is built for your furnace type, zones and skid layout.
Can it help with skid marks?
Yes. By tracking heat load per skid circuit and linking it with mill rolling force, it shows when insulation loss is making skid marks worse and which circuit to repair.
Do we need new sensors?
Often only a few, such as flow and temperature on individual skid circuits. Most data already exists in level 1 and level 2 systems.
How are anomalies turned into work?
The AI drafts a work order with the zone, likely cause, evidence and suggested timing, and the planner fits it into the next stop.
How do we start?
Start with one furnace. A 6-week pilot connects your data, builds the zone model and runs anomaly detection beside your team. To plan it, contact our team.
See What Your Furnace Is Hiding
In thirty minutes we review your furnace data and skid cooling layout, and point out where losses are most likely. You keep the notes either way.
- 1Furnace zone and skid layout drawing
- 2A month of zone and fuel data
- 3Skid cooling flow and temperature data
- 4Fuel per ton trend for the past year
- 5Findings from the last furnace outage