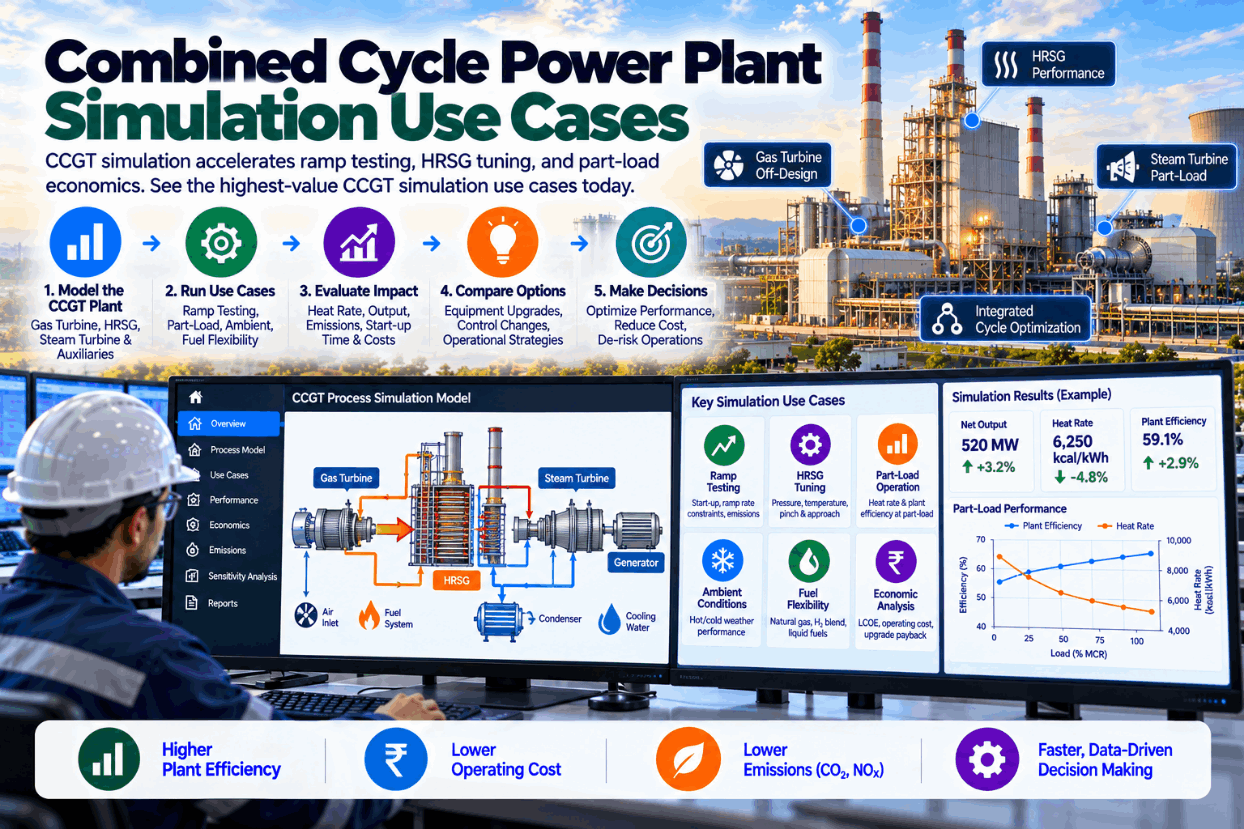
Combined cycle plants were designed for steady baseload running, and many now start, stop and ramp daily to balance renewables. That change puts new questions to operators and engineers: how fast can we ramp without damaging the heat recovery steam generator, when is it cheaper to run one gas turbine instead of two, is duct firing worth it this afternoon, what does inlet cooling deliver in summer? Simulation answers them without risking the plant. This guide covers the highest-value CCGT simulation use cases, HRSG thermal stress, part-load economics, ramp testing and how to choose between steady-state and dynamic models. To see CCGT simulation on your block, book a short walkthrough.
Combined Cycle Power Plant Simulation Use Cases: Ramps, HRSG Stress and Part-Load Economics
Gas turbine, HRSG and steam cycle modelled together, so faster starts, deeper turndown and summer output can be tested before they are tried on the plant.
Why Combined Cycle Operation Has Become Harder
Modern combined cycle plants are remarkably efficient. GE reported that its HA turbine technology reached over 64% efficiency in combined cycle by 2018, and efficient CCGTs emit around 450 g of CO2 per kWh, roughly half that of coal. But that efficiency is achieved at full load in steady operation. Much of the fleet now spends its time cycling, ramping and running at part load to follow demand and renewables.
Cycling puts stress on the heat recovery steam generator. Thick-walled drums and headers heat and cool with every start and ramp, and repeated thermal gradients cause fatigue cracking over time. Faster starts earn more in flexible markets but consume more life. Every operating choice becomes a trade-off between revenue, efficiency and component life.
Simulation lets teams explore those trade-offs on a model instead of the plant. We can discuss your operating profile on a call.
The Highest-Value CCGT Simulation Use Cases
These use cases deliver the most value in cycling combined cycle plants.
Shorter hot, warm and cold starts within stress and emissions limits.
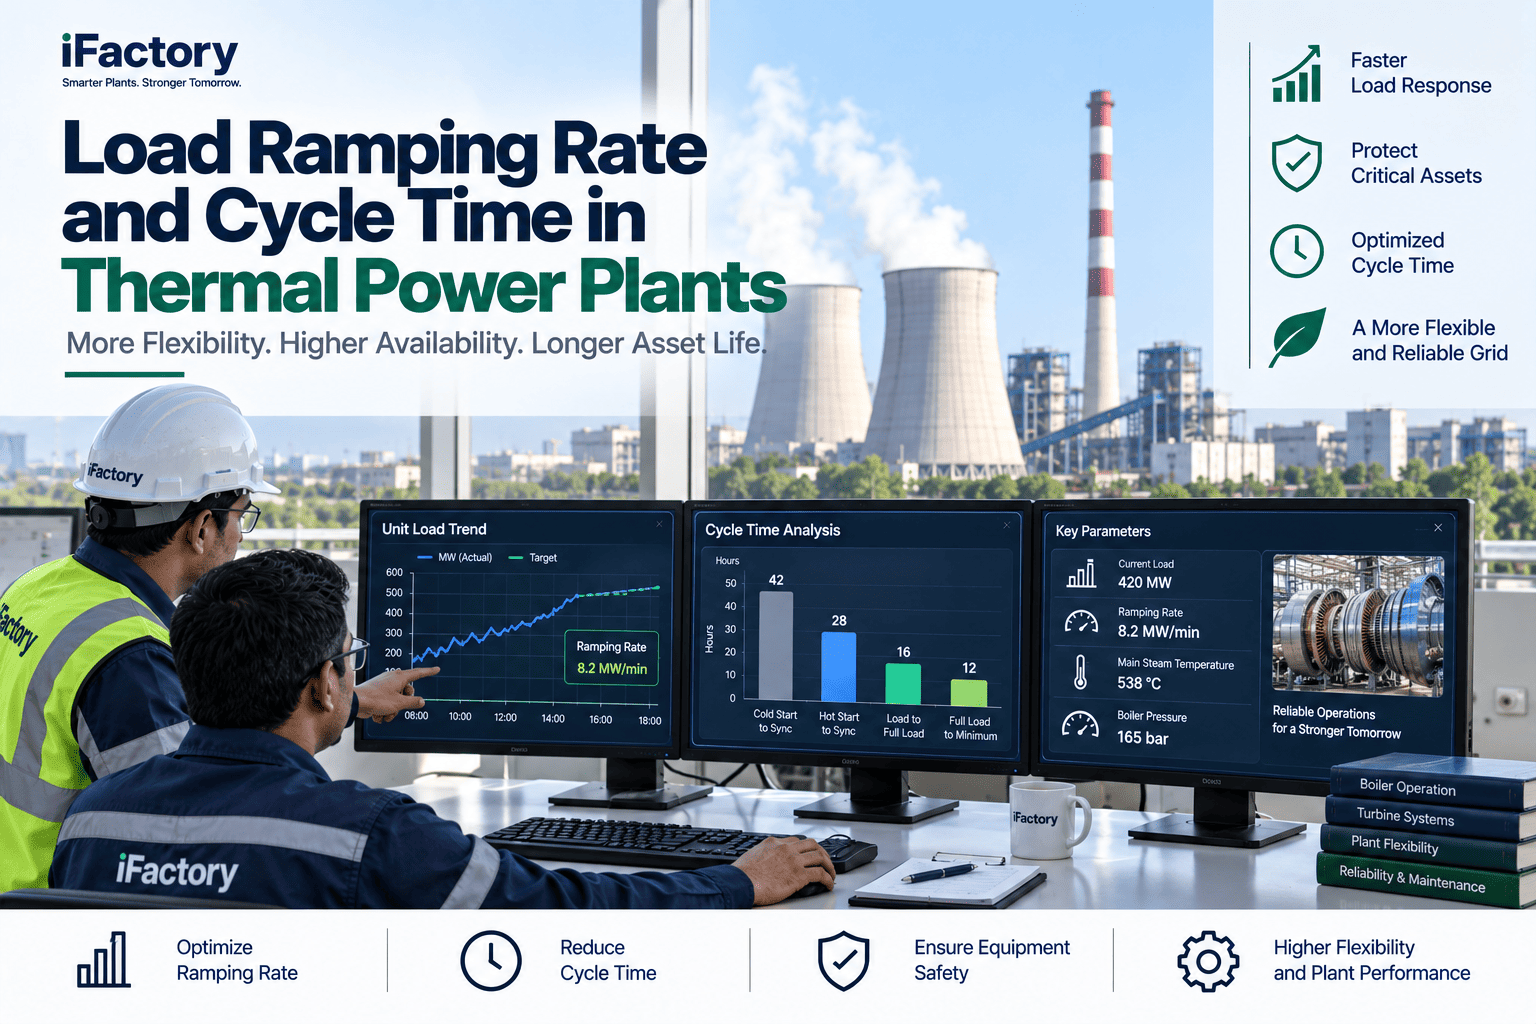
Faster load changes checked against HRSG, steam turbine and emissions constraints.
Drum and header thermal stress, attemperator behaviour and water hammer risk.
Minimum load, one versus two gas turbines and part-load efficiency.
When extra output from duct burners is worth its lower efficiency.
Output recovered with evaporative cooling, chillers or fogging on hot days.
Summer capacity studies are often the easiest to justify, because the lost megawatts on hot days are visible in every year’s records.
Most plants start with one of the first three, because flexibility is where both revenue and life consumption are highest. See a ramp study in a demo.
HRSG Thermal Stress: The Limit Behind Flexibility
The HRSG is often the component that limits how fast a combined cycle plant can start and ramp. Simulation helps quantify that limit.
A dynamic simulation of the HRSG predicts metal temperatures and stresses through a start or ramp. That allows start profiles to be shaped, for example with short holds at key points, so the unit reaches load faster without exceeding stress limits.
Linking simulated stress to a life consumption count per start gives operators a clear view of the cost of each fast start. That count is part of our HRSG views.
Part-Load Economics: One Gas Turbine or Two?
At part load, a two-on-one combined cycle block can often run with both gas turbines at reduced load or with one gas turbine at higher load. The choice changes efficiency, emissions and maintenance.
| Operating mode | Block output | Illustrative efficiency | Consideration |
|---|---|---|---|
| Two GTs at full load | 100% | 57.8% | Best efficiency |
| Two GTs at 80% load | 80% | 56.1% | Good efficiency, both units warm |
| Two GTs at 60% load | 60% | 52.6% | Emissions compliance at low GT load |
| One GT at high load | 45% | 49.7% | Fewer starts later, one unit cooling |
Ambient conditions shift the answer through the year. Gas turbine output and efficiency fall as inlet air warms, so the best operating mode on a winter night may not be the best on a summer afternoon.
The numbers above are illustrative. The real answer depends on turbine models, emissions compliance at low load, how long the reduced output will last, the cost and life impact of shutting down and restarting a gas turbine, and market prices. Simulation calculates each term for the specific plant.
Accurate part-load curves also improve bids and unit commitment, because the plant knows its real cost at every output level. We provide them from the calibrated block model.
Testing Faster Ramps on the Model First
Before changing ramp rates on a real block, test them on a model.
Ramp rate, start time or minimum load to be achieved.
Run the dynamic model with the new profile and current controls.
HRSG stress, steam temperatures, drum levels, emissions and turbine limits.
Modify profiles or control settings where limits are approached.
Try the verified profile on the plant with close monitoring.
Compare real response with the simulation and refine the model.
Emissions deserve particular attention during fast ramps and at low load. Gas turbine combustion systems have load ranges where emissions compliance is harder, and the model should flag when a proposed profile would spend time in those ranges. Steam temperature control is the other frequent limit, since attemperator sprays must keep pace with faster changes without overshooting.
This sequence reduces the risk of trips and damage during trials, and it shortens the trial period because the profile is already close to right. It also produces evidence for grid code submissions and discussions with equipment makers about flexibility.
Control changes identified in simulation still go through normal change management and the equipment maker’s requirements. Our engineers work within those procedures.
Steady-State or Dynamic: Which Model for Which Question
CCGT questions fall into two groups, and each needs a different model.
- Performance at fixed operating points
- Part-load curves and ambient effects
- Duct firing and inlet cooling value
- Degradation and cost of fouling
- Fast to run for many cases
- Cannot show start or ramp behaviour
- Response over time
- Start-ups, ramps and trips
- HRSG metal temperatures and stress
- Control tuning and interaction
- Needed for flexibility questions
- More effort to build and validate
Calibration matters for both. A steady-state model is tuned against test data at several loads; a dynamic model is also checked against recorded starts and ramps, including metal temperatures where they are measured. Without that check, a dynamic model can look convincing while predicting the wrong stresses.
Most plants benefit from both, built on common equipment data. The steady-state model answers daily economic and performance questions; the dynamic model is used for flexibility studies, control changes and operator training.
The dynamic model can also support an operator training simulator, which adds value during control upgrades. Ask our team how the two connect.
CCGT Simulation Checklist
Use this checklist to prepare a CCGT simulation project.
Historian data from past starts is often the most valuable input, because it shows how the block really behaves. We review it first during a scoping review.
What CCGT Simulation Is Worth
Simulation pays in combined cycle plants through revenue, cost and life.
Maintenance costs belong in the case as well, since many gas turbine maintenance intervals count starts as well as running hours, so each extra start has a cost.
The size of each benefit depends on the market and operating profile. A block that cycles daily in a flexible market gains most from start and ramp optimization; a block running long hours gains most from part-load and ambient optimization.
A review of your last year’s operation shows where the value lies. Book one with our specialists.
How iFactory Delivers Combined Cycle Simulation
Gas turbines, HRSG, steam turbine and condenser together.
Metal temperatures and stress through starts and ramps.
Profiles shaped for speed within stress limits.
Accurate efficiency for every operating mode.
Inlet cooling and duct firing value.
Fatigue use counted per start.
It works with your DCS, historian and existing performance tools. Share a month of start data and we will show the stress picture in a session.
Find a Faster Start That Stays Within Limits
Share historian data from recent starts. We model your block, simulate faster profiles and show time saved against HRSG stress, so you can choose with evidence.
Faster ramp profile saves 11 minutes to full load, but HP drum wall temperature difference reaches 92% of its limit. Hold at 40% load for 6 minutes recommended.
A Faster Start Tested on the Model
This exchange shows how a plant engineer might use iFactory before changing start procedures.
iFactory ships as a pre-configured NVIDIA AI server, racked and ready with the combined cycle modelling and flexibility analytics models loaded. Rack it, plug in power and Ethernet, and the AI is live on your network. Our scope covers sensors and data connections across gas turbines, HRSGs and steam cycles, DCS, PLC/SCADA, historian and ERP integration, cabling and network setup, operator and quality team training, and 24×7 remote monitoring.
Server installed, DCS and historian links live, historical operating, performance and maintenance data loaded.
Models calibrated on your own unit data, then run in advisory mode on one unit with your operations and performance engineers reviewing every output.
Rollout to the agreed units under your change management, operator and engineer training, and 24×7 remote monitoring in place.
Software, server and integration come as one package. For pricing on your block, contact our sales team.
Frequently Asked Questions
It models gas turbines, heat recovery steam generators, steam turbines and condensers together, in steady state or over time, to predict performance, flexibility and component stress.
Start-up optimization, ramp rate testing, HRSG stress and attemperation analysis, part-load economics, duct firing decisions and inlet cooling studies.
Starts and ramps cause temperature gradients in thick-walled drums and headers, which cause fatigue over time. Simulation predicts those stresses so profiles can limit them.
GE reported its HA technology reached over 64% combined cycle efficiency by 2018. Efficiency falls at part load, which is why part-load curves matter.
Steady-state for performance, part-load and seasonal questions; dynamic for starts, ramps, stresses and control tuning. Many plants use both.
A first steady-state study can take weeks; dynamic models take longer and are often built in phases. Plan it with our engineers.
Run Your Combined Cycle Faster, Longer and Smarter
iFactory models your block, tests faster starts and ramps against real stress limits and guides part-load and summer decisions, so flexibility earns more without costing component life.
Illustrative. Part-load economics decide whether to run one or two gas turbines.