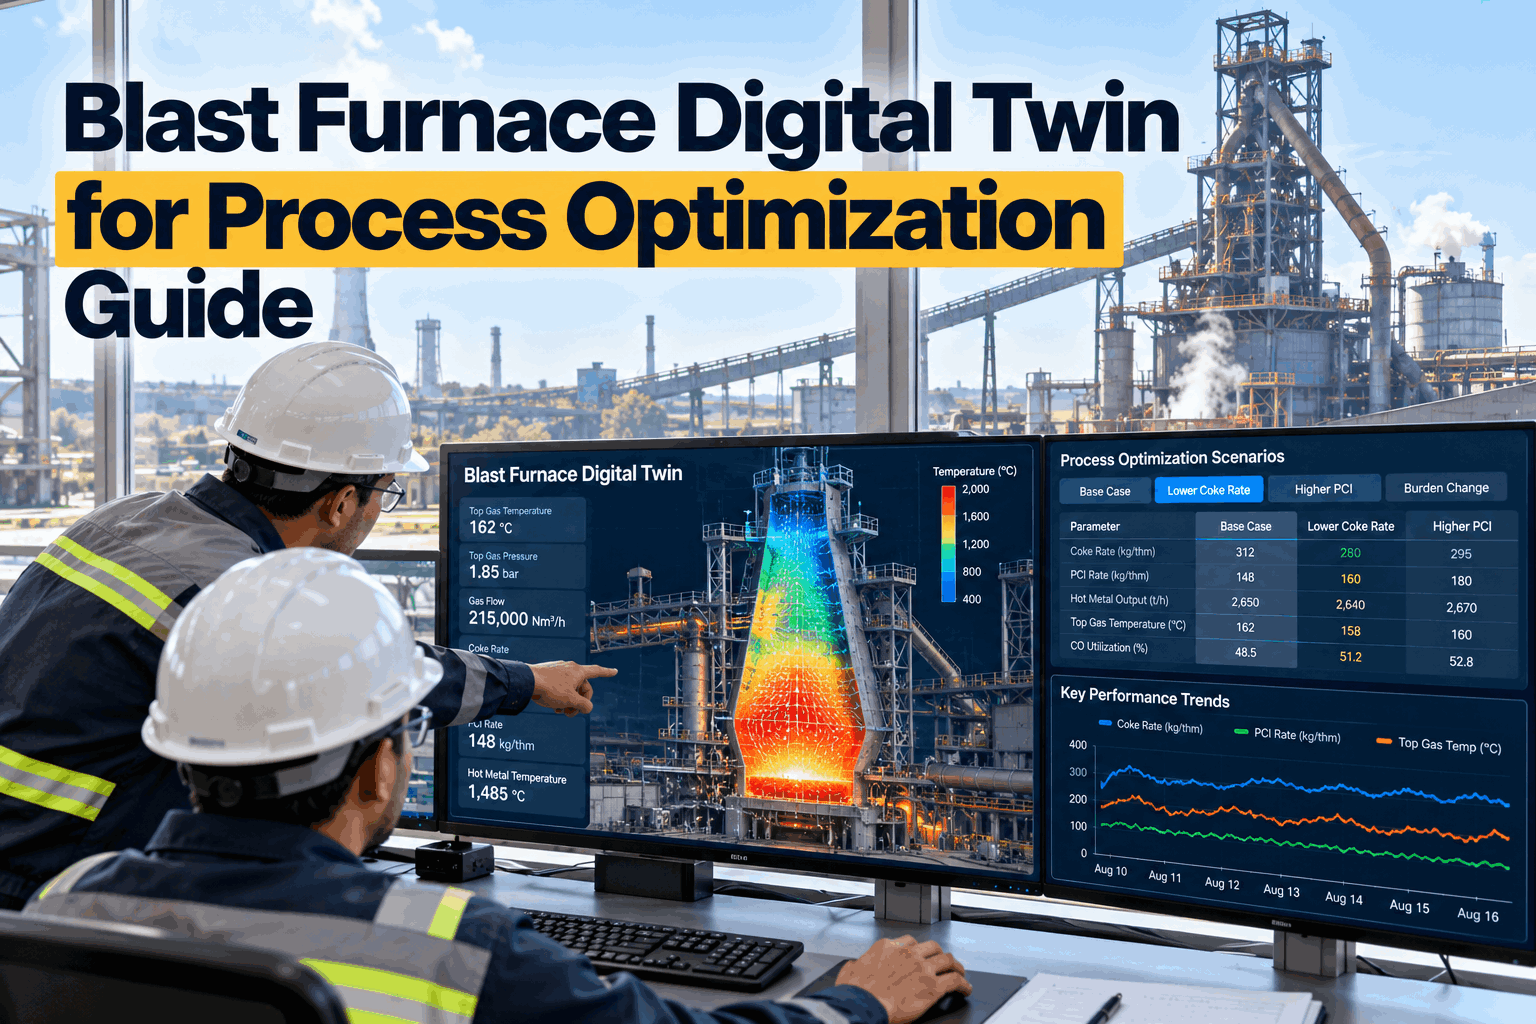
A blast furnace cannot be paused, opened up, or run twice. Every change to coke rate, PCI, blast temperature, oxygen enrichment, or burden mix is a live experiment on a vessel that holds hundreds of tonnes of burden, takes many hours for a charge to reach the hearth, and punishes a wrong move with a cold hearth, a hanging burden, or a damaged stave. So most process decisions are still made the way they always were: from operator experience, a static heat and mass balance in a spreadsheet, and a cautious step in the direction that worked last time. That approach is safe, and it leaves a lot unexplored. A blast furnace digital twin changes the question from "what do we think will happen" to "what does the calibrated model say will happen, and where does it stop being safe". It combines mass, energy, and gas-flow physics with live plant data, calibrates the result to your furnace, and lets engineers test coke rate, PCI, and burden strategies on the model first. The twin does not replace the process team, and it does not run the furnace. It gives them a place to test ideas, see the guardrails before they reach them, and explain why the furnace behaves as it does. This guide covers what a twin models, which strategies it can test, how to judge whether to trust it, and how to roll one out. iFactory Blast Furnace Monitoring and AI Failure Prediction provides the monitoring layer the twin is built on, live.
iFactory BF Monitoring and AI Failure Prediction - Steel
Blast Furnace Digital Twin for Process Optimization Guide
Mass, energy, and gas-flow physics, calibrated to your furnace, so engineers can test coke rate, PCI, and burden strategies on the model before they touch the process.
Physics
mass, heat, and gas-flow balances at the core
Calibrated
to your furnace, raw materials, and operating history
What-if
strategies tested on the model, not the furnace
Guardrails
flame temperature, permeability, and thermal limits shown
How Furnace Process Decisions Get Made Today
Most blast furnace teams are further along than their tools. Experience is deep, but the means of testing a new idea have not kept pace. These four stages show where a plant sits and what each step adds.
Stage 1
Experience and rules of thumb
Decisions rest on the operators and process engineers who know the furnace. Rules of thumb guide changes. Knowledge is hard to transfer when people move on.
Recognition signal: "That is how this furnace behaves" - and nobody can show why.
Stage 2
Static balance sheets
A heat and mass balance in a spreadsheet, run monthly or per campaign. It explains the past period but ignores gas flow and cannot respond to today's furnace state.
Recognition signal: "The balance closes at month end" - long after the decision was made.
Stage 3
Offline simulation
Specialists run detailed simulations for studies and projects. The results are valuable but slow, tied to a fixed dataset, and rarely used for daily operating questions.
Recognition signal: "We commissioned a study" - and the answer arrived after the change.
Stage 4
Live calibrated twin
A physics-based model runs on live plant data, calibrated continuously. Engineers test strategies in minutes, compare scenarios, and see which limit binds first.
Recognition signal: "We ran it on the twin first" - and knew which guardrail would bind.
What a Blast Furnace Twin Is Made Of
A useful twin is not a single model. It is four layers, each with a specific job. The layers below show how raw plant data becomes a scenario an engineer can trust enough to discuss in a process meeting.
Layer 1
Data and Instrumentation
The twin is only as good as the data under it. This layer collects process signals, charge records, and laboratory results, aligns them in time, and flags the gaps and drifting instruments before they enter the model.
Process and furnace signals
Blast volume, temperature, and pressure; top gas composition; stave and hearth temperatures
Material and quality records
Charge data, coke and sinter quality, hot metal and slag chemistry from the cast house
↓
Layer 2
Physics Core
The first-principles engine. It balances mass and energy through the furnace, models gas flow and pressure drop through the packed bed, and tracks the thermal and chemical state from the stack to the hearth.
Mass and energy balance
Inputs against hot metal, slag, and top gas, closed against plant measurements
Gas flow and reduction
Gas distribution, pressure drop, and iron oxide reduction along the shaft
↓
Layer 3
Calibration and Soft Sensors
Real furnaces differ from textbook models. This layer tunes model parameters to your furnace, corrects for drift, and uses data-driven methods to estimate quantities that cannot be measured directly, such as the thermal state of the hearth.
Parameter calibration
Model fitted to historical campaigns, then checked against periods it has not seen
Soft sensors and state estimation
Hot metal temperature and silicon trends estimated between casts
↓
Layer 4
Scenario and Decision Layer
Where the model becomes a tool for engineers. They set a change, run it against the current furnace state, and compare the outcome with the baseline and with the operating limits.
Scenario comparison
Several strategies side by side, with the binding constraint named for each
Saved scenario library
Past tests and their results kept for review, training, and campaign planning
What the Physics Covers
A blast furnace behaves as a set of connected zones. A twin that models only one of them will explain part of the picture and mislead on the rest. These are the groups of inputs, zones, balances, and constraints that a complete twin handles together.
Inputs
Burden mix: sinter, pellets, lump ore
Coke rate and coke quality
PCI rate and coal properties
Blast volume, temperature, moisture
Oxygen enrichment
Furnace zones
Shaft and thermal reserve zone
Cohesive zone position and shape
Raceway and tuyere conditions
Hearth and liquid drainage
Burden descent and distribution
Balances
Overall mass balance
Heat balance by zone
Top gas utilisation
Slag volume and basicity
Fuel rate and replacement ratio
Constraints
Permeability and pressure drop
Raceway flame temperature window
Hot metal silicon and temperature
Stave and cooling heat load
Top gas temperature limits
Strategies an Engineer Can Test on the Twin
The value of a twin is in the questions it makes cheap to ask. Each strategy below pairs the question with the outputs to watch and the guardrail that usually binds first. In every case the aim is to see the limit on the model before the furnace reaches it.
Strategy
Question the twin answers
Outputs watched
Guardrail that usually binds
Lower coke rate
How far can coke be reduced before the hearth loses thermal margin?
Hot metal temperature and silicon, flame temperature, permeability
Thermal state of the hearth
Higher PCI rate
How much coke does extra injected coal replace, and at what cost to operation?
Replacement ratio, flame temperature, gas flow, top gas utilisation
Raceway flame temperature and unburnt char
Oxygen enrichment
What does it do to productivity, flame temperature, and top gas?
Production rate, flame temperature, gas volume, top gas calorific value
Flame temperature and top gas temperature
Blast temperature and moisture
How does a change in blast conditions shift the thermal balance?
Flame temperature, fuel rate, heat load in the lower furnace
Flame temperature window
Burden mix: sinter, pellet, lump
What happens to permeability, slag, and fuel when the mix changes?
Pressure drop, slag volume, reduction behaviour, productivity
Permeability and pressure drop
Raw material quality change
What is the effect of a new coke or ore source before it is charged?
Coke rate, bed permeability, slag chemistry, hot metal quality
Coke strength after reaction and slag properties
Production rate change
Can the furnace run harder or slower without losing stability?
Blast volume, pressure drop, stave heat load, cast schedule
Gas flow capacity and stave heat load
A Scenario Comparison, Step by Step
This is what a strategy test looks like once the twin is calibrated. The baseline is the furnace as it is today. Each scenario changes one thing and shows the result against the limits. The values are illustrative of the format, not results from a specific furnace.
Baseline - Furnace A
Current operation
Calibrated
Coke rate345kg per tonne hot metal
PCI rate160kg per tonne hot metal
Hot metal silicon0.45%stable over the last 7 days
Top gas utilisation48%model matches measurement
Scenario A - Raise PCI
Plus 10 kg per tonne hot metal
Feasible
Coke rate3378 kg saved
Flame temperatureIn windowmargin remains above the lower limit
PermeabilityStablepressure drop unchanged
Hot metal silicon0.46%thermal state held
Scenario B - More Pellets
Plus 10% of the burden
Watch
PermeabilityFallingpressure drop rises toward limit
Slag volumeLowerless slag to handle
ProductivityHigheronly if gas flow allows
Binding limitPressure droptest a smaller step first
Scenario C - Cut Coke
Minus 20 kg with no other change
Rejected
Thermal stateCoolingsilicon falls toward 0.28%
Flame temperatureBelow limitoutside the safe window
Hot metal temperatureDroppingtrend crosses the lower limit
VerdictDo not tryhearth thermal margin lost
The 90-Day Rollout of a Blast Furnace Twin
Twin projects succeed when the model is earned in stages: first the data, then the calibration, then use. Skipping validation produces a model that engineers do not trust and stop opening.
Phase 1
Data and Scope - Days 1 to 30
Week 1 to 2
Data audit and instrument review
Review signal availability, sampling rates, and instrument health. Identify drifting or missing measurements and agree how each gap is handled before modelling.
Week 3 to 4
Scope and balance closure
Agree the first questions the twin must answer, then close the mass and energy balance on historical data to confirm the inputs are consistent.
Phase 2
Calibration - Days 31 to 60
Week 5 to 6
Fit to operating history
Calibrate model parameters against several months of operation covering different burdens, rates, and furnace states, including known disturbances.
Week 7 to 8
Validation on unseen periods
Test the model on periods it was not fitted to. Review the errors with the process team and agree where the model can and cannot be trusted.
Phase 3
Live Use - Days 61 to 90
Week 9 to 10
First scenarios with engineers
Run the agreed strategy tests live with the process team. Compare predictions with what the furnace does after any real change, and record the difference.
Week 11 to 12
Scenario library and review
Build a library of tested scenarios and their outcomes. Review accuracy, set a recalibration schedule, and plan the next set of questions.
Twin Readiness Checklist
Use this checklist to judge whether a twin is ready to support decisions. Every item should have an owner and a record. Tick each one as it is confirmed.
Want to see which strategy questions your own furnace data could answer? Book a demo - bring a summary of your instrumentation, a few months of operating data, and the three process questions you would most like to test, and we will scope the twin in the first session.
What a Calibrated Twin Delivers
A twin does not promise a figure. It changes how decisions are tested and explained. These are the benefits plants should look for and measure.
Minutes
To test a strategy
instead of waiting for a charge to travel through the furnace
Visible
Binding limits
the constraint that stops a change is shown before the furnace reaches it
Safer
Process trials
poor options rejected on the model, not on the hearth
Shared
Furnace knowledge
tested scenarios and reasoning kept, not lost when people move on
Frequently Asked Questions
How is a digital twin different from the heat and mass balance model we already use?
A heat and mass balance is a snapshot: it explains a period that has already ended, usually without modelling gas flow. A twin runs continuously on live data, adds gas flow, pressure drop, and zone behaviour, and is calibrated to your furnace. The most important difference is that it can be asked what-if questions. Your existing balance is the right starting point, and the twin builds on it rather than replacing it.
How do we know whether to trust the model?
By testing it in the open. The balance must close on historical data, the calibrated model must be validated on periods it was not fitted to, and the predictions must be compared with what the furnace does after real changes. Treat the twin as strongest for comparing options and showing direction, and be cautious about its absolute numbers. The process team keeps the final decision, and trust grows as the recorded comparisons accumulate.
What data does the twin need, and what if some measurements are unreliable?
It needs process signals such as blast, top gas, pressure, and temperature, along with charge records and laboratory results for coke, sinter, hot metal, and slag. The first step in every project is a data audit. Where a measurement is missing or drifting, the plan states how it is handled, for example with a soft sensor or by excluding the period, and the limits that this places on the model are stated openly.
Will the twin control the furnace automatically?
No, not by default. The twin is advisory: it supports engineers who decide what to change. Blast furnaces carry real safety and equipment risks, and the twin does not replace safety systems, operating procedures, or the judgement of the operators. Any move toward closed-loop use would need long validation, agreement from the process owner, and its own safeguards, and it is not part of the standard programme.
How does the twin relate to monitoring and failure prediction on the same furnace?
They share the same data and complement each other. Monitoring and failure prediction watch assets and conditions such as stave heat load, hearth temperatures, and equipment health, and warn when something is trending toward a fault. The twin explains the process behind those trends and tests how an operating change would affect them. A rising stave heat load, for example, can be examined on the twin to see what is driving it, and which operating change would relieve it.
Test the idea before the furnace does.
See an iFactory Blast Furnace Twin Running on Your Data
Bring an outline of your furnace instrumentation, a few months of operating data, and the process questions you are weighing: coke rate, PCI, or burden changes. We will scope the model, show how scenarios are compared against your limits, and agree what must be true before anyone relies on it.
Physics
based, then calibrated
Advisory
engineers decide
90-day
data to live scenarios