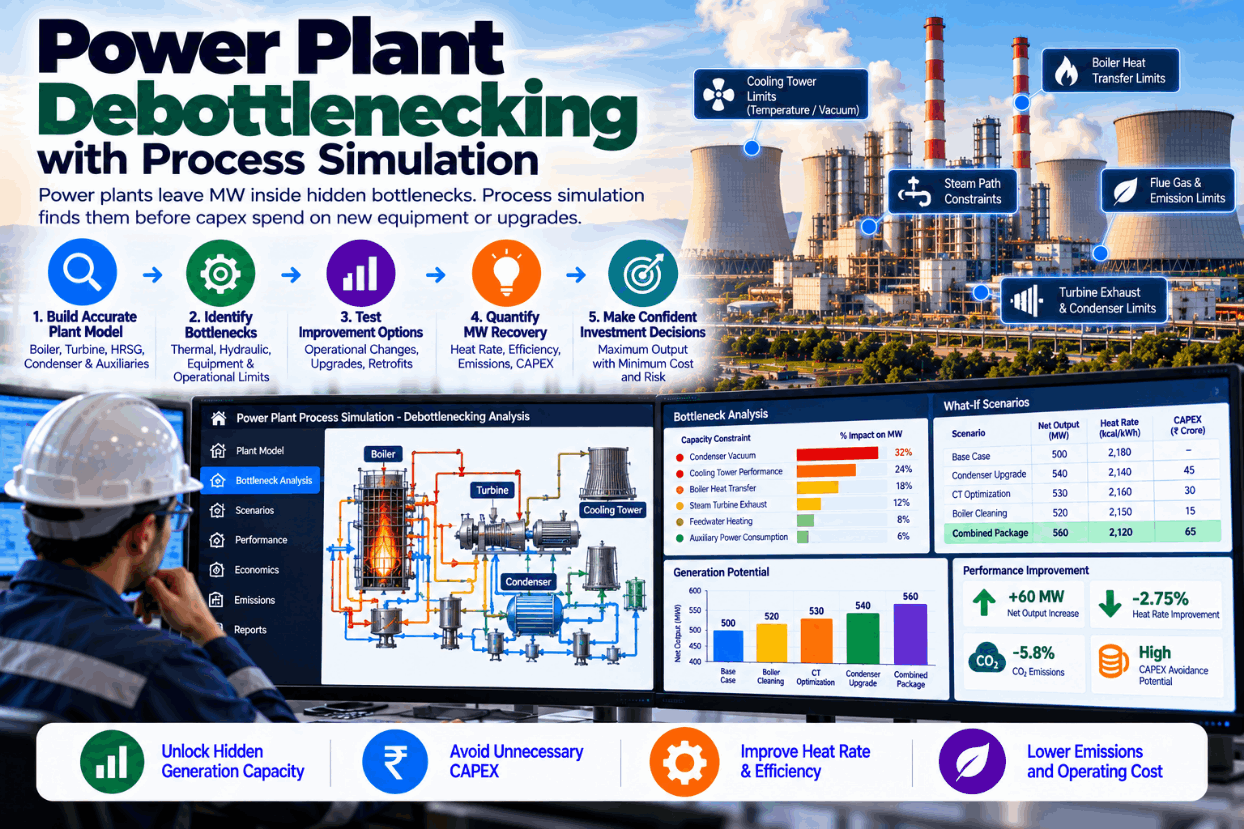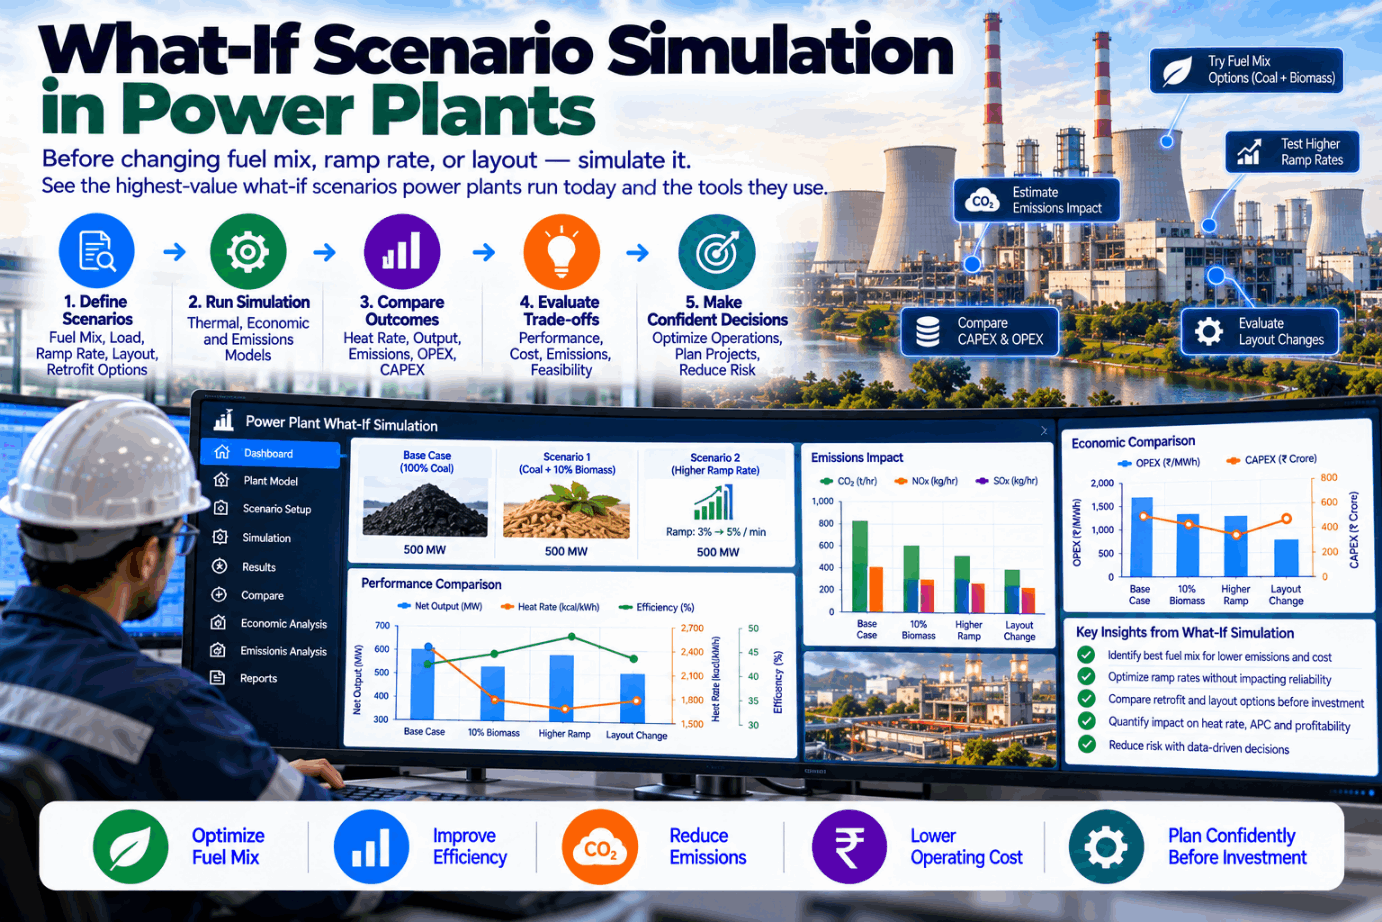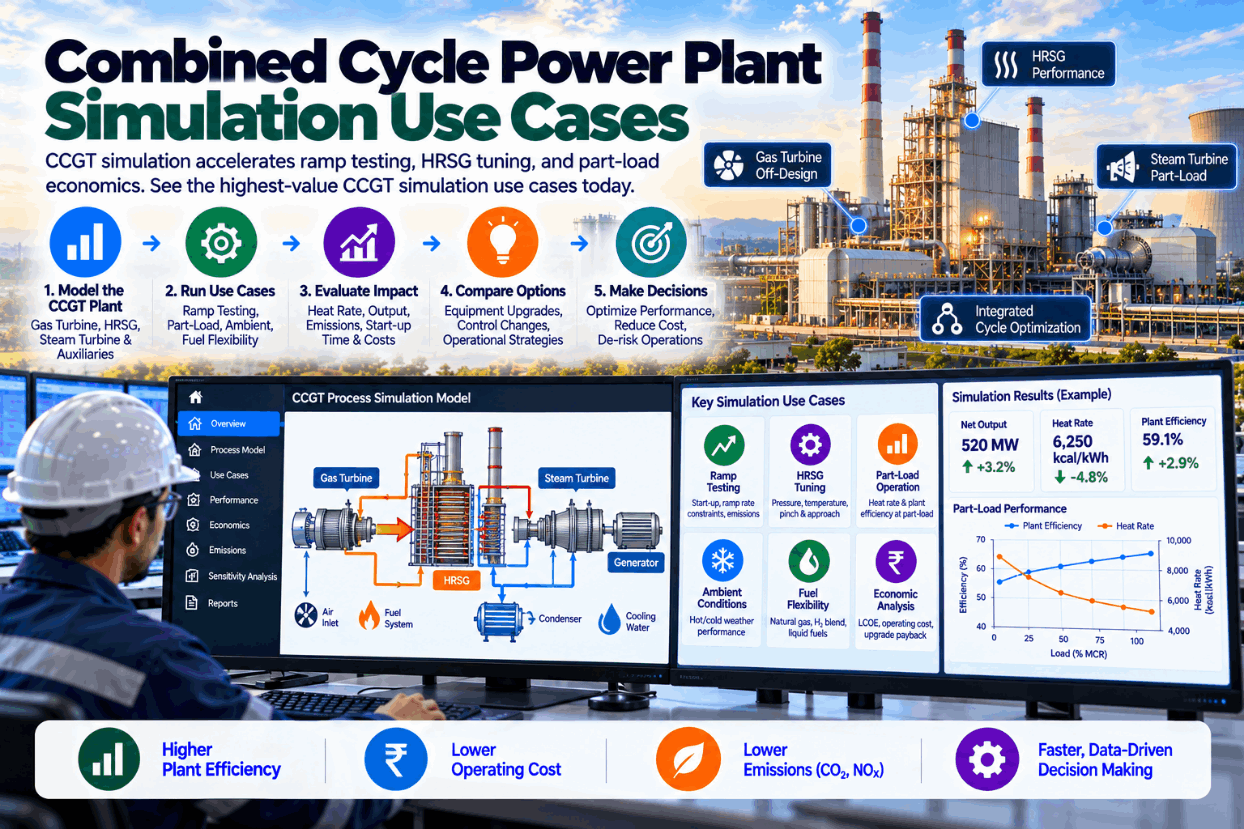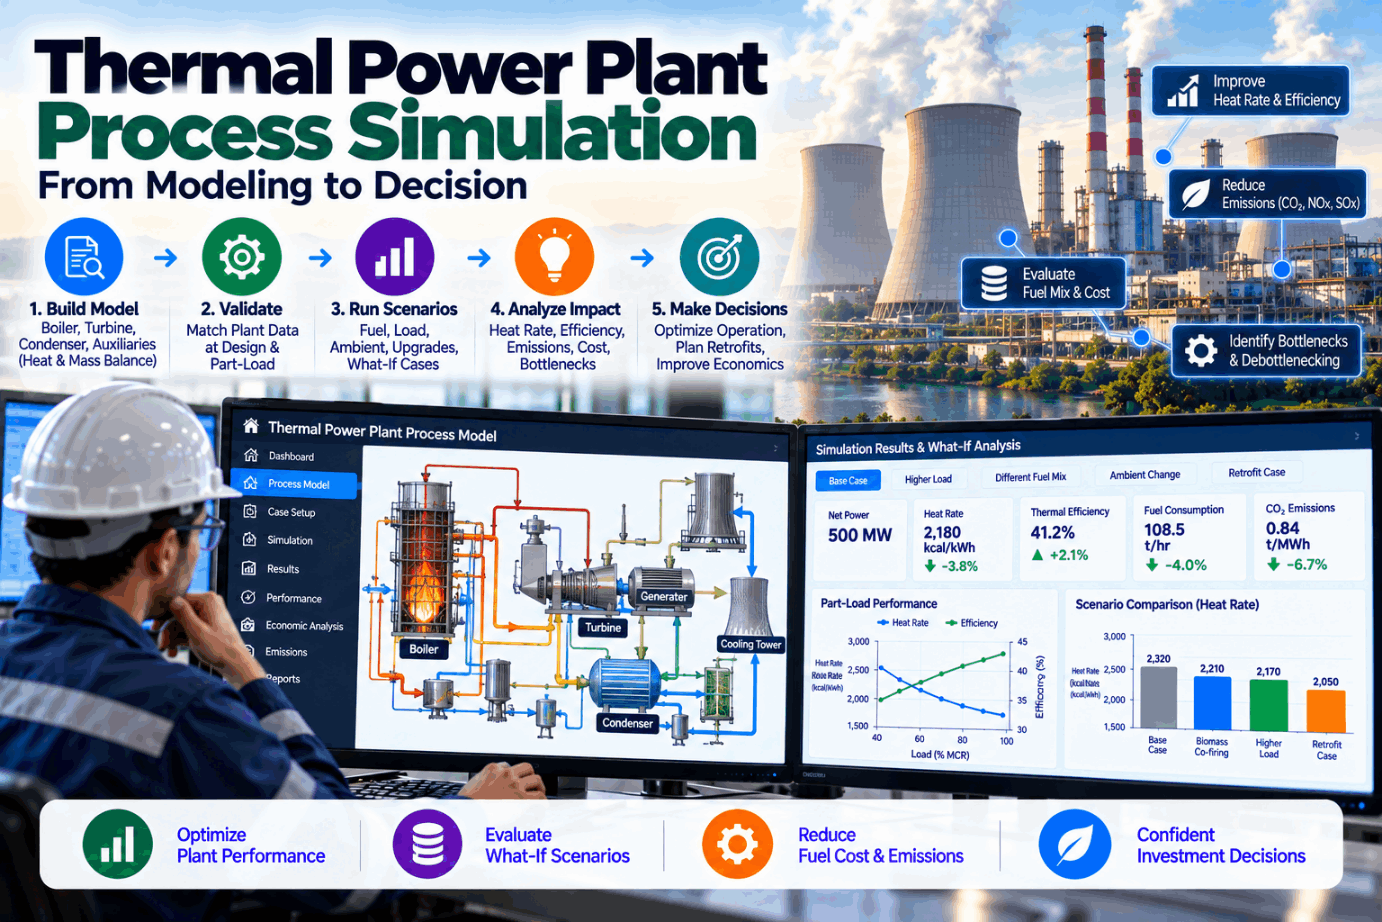
Every important decision in a thermal power plant has a thermodynamic answer. What happens to heat rate at 55% load? How much output is lost if a feedwater heater is out of service? Is it worth upgrading the turbine, adding a heat exchanger or changing steam conditions? Process simulation answers these with heat and mass balance models of the whole cycle, from fuel to feedwater to condenser. Once used mainly by designers, it is now practical for operating plants too. This guide explains what process simulation covers, the difference between steady-state and dynamic models, the decisions it supports, how to calibrate a model to a real unit and how to choose the right approach. To see a calibrated heat balance model, book a short walkthrough.
Thermal Power Plant Process Simulation: From Heat Balance Model to Better Decisions
Heat and mass balance models of the whole cycle, calibrated to your unit, used for part-load behaviour, equipment changes and upgrade decisions.
Why Operating Plants Need Process Simulation
Most thermal plants were designed with heat balance software, but once the plant is running, that model often sits unused with the original design team. Operating decisions are then made with rules of thumb, vendor curves and spreadsheets. That works for routine questions but struggles with the ones that matter most: how much a degraded heater really costs, what an upgrade will deliver, or how the unit behaves at loads it was never designed to run at for long.
The stakes are large. Sargent & Lundy’s estimates, cited in an EIA analysis of coal plant heat rate improvement, put the value of a turbine overhaul at around 300 Btu/kWh and condenser cleaning at around 70 Btu/kWh. Choosing between such options, and predicting their combined effect, is exactly what process simulation does well.
A calibrated process model turns those decisions from estimates into calculations. We can discuss the decisions you face on a call.
What a Process Model Includes
A thermal plant process model represents the whole cycle and the equipment in it.
The level of detail follows the questions. A model for dispatch curves needs less detail than one for evaluating a heater upgrade. We set the detail during scoping.
Steady-State Versus Dynamic Simulation
The two main types of process simulation answer different questions.
- Plant at a fixed operating point
- Design and off-design performance
- Part-load curves and equipment changes
- Fast to build and run
- Ideal for performance and upgrade studies
- Cannot show behaviour during transients
- Plant response over time
- Start-ups, ramps, trips and control actions
- Thermal stresses and control tuning
- More effort to build and validate
- Ideal for flexibility and training
- Often linked to control system emulation
A practical test helps choose: if the question can be answered by comparing two stable operating points, steady-state is enough. If it depends on what happens between them, such as how quickly a temperature rises or whether a control loop overshoots, dynamic simulation is needed.
Most operating plants get the fastest value from a calibrated steady-state model, because it answers performance and investment questions directly. Dynamic models become important as units cycle more and ramp faster, and for operator training and control changes.
Both can share the same equipment data, so a steady-state model built today can grow into a dynamic one later. Ask our engineers how that path works.
Decisions Process Simulation Supports
These are the questions operating plants most often answer with a process model.
Accurate heat rate across the load range for dispatch, bids and minimum load decisions.
What a fouled heater, leaking valve or worn turbine section costs in heat rate and output.
Expected gains from turbine upgrades, heater replacements or new heat recovery.
Effect of different coals on boiler efficiency, auxiliary power and output.
Output and heat rate across cooling water and ambient conditions.
Limits and efficiency penalties of running lower and ramping faster.
Each decision benefits from the same calibrated model, which is why a single model supports many studies over its life. See a sample of studies in a demo.
A Simple Heat Rate Calculation From the Model
At its simplest, net heat rate is heat input divided by net output. The model provides both at any operating point.
Illustrative figures. 860 kcal/kWh is the thermal equivalent of one kWh; the model calculates each input from the full cycle.
Auxiliary power is often overlooked in such calculations. At part load, fans and pumps do not scale down in proportion to output, so auxiliary share rises and net heat rate worsens faster than gross heat rate as load falls.
The value of the model is not this arithmetic, which any spreadsheet can do. It is the ability to predict how heat input, gross output and auxiliary power change together when something in the cycle changes, whether that is load, a heater, the condenser or the fuel.
Comparing the model’s prediction with the real plant also reveals where the unit departs from expected, which is the start of every performance investigation. That comparison runs daily in our performance views.
Calibrating the Model to Your Unit
A design model describes the plant as it was meant to be. A calibrated model describes it as it is.
Steady periods at several loads with reliable measurements.
Check mass and energy balances to find faulty instruments.
Adjust equipment parameters, such as efficiencies and heat transfer, to match.
Compare the model with data it was not tuned on.
Recalibrate after overhauls, modifications and major fouling changes.
Instrument quality matters as much as model quality. A feedwater flow meter reading 2% high will push the calibration in the wrong direction and hide real losses elsewhere. Reconciliation catches many of these problems before they reach the model.
Calibration also produces insight on its own. The parameters that must change to match the plant, such as a lower turbine section efficiency or a heater with a larger terminal difference, point directly to equipment that has degraded since design.
A well-calibrated model typically matches key plant measurements closely across its range, with agreement tracked as a quality indicator. We report that agreement with every model release.
Choosing a Simulation Approach
Plants use several kinds of tools for process simulation. The right choice depends on the questions, in-house skills and how the model will be used.
| Approach | Typical use | Consideration |
|---|---|---|
| Commercial heat balance packages | Design and off-design heat balances, for example the Thermoflow family, GateCycle and Ebsilon | Mature and detailed; needs skilled users and licences |
| Dynamic simulators | Transients, control tuning and training | More effort; often tied to control system emulation |
| Custom first-principles models | Specific plants or questions | Flexible; depends on the builder’s expertise |
| Hybrid physics and data models | Operating plants with live data | Stays calibrated with plant data; good for daily use |
Licensing, skills and data access differ widely between these options, so the long-term cost of keeping a model in use matters as much as its first cost.
For an operating plant, the key question is how the model will be kept current and used day to day. A detailed model that only a consultant can run is valuable for one-off studies but rarely changes daily decisions. A hybrid model connected to plant data can support both.
Many plants combine a detailed design package for major studies with a connected operating model for daily use. Our team can advise on the mix.
Process Simulation Readiness Checklist
Check these before starting a process simulation project.
The first question on the list is the most important: a model built without clear decisions in mind is rarely used. We help define them in a short workshop.
How iFactory Delivers Process Simulation for Operating Plants
Boiler, turbine, heaters, condenser and auxiliaries.
Tuned and validated against your own test data.
Faulty instruments found through balance checks.
Accurate heat rate across the load range.
Equipment, fuel and operating changes tested.
Model versus plant to reveal degradation early.
It works alongside your existing design tools and connects to your historian. Bring one question and we will answer it with a model in a session.
Answer Your Next Big Decision With a Calibrated Model
Pick a decision, such as an upgrade, a new minimum load or a fuel change. We build and calibrate a model of your unit and show the result with its assumptions.
Model and measured heat rate agree within 0.4%. Largest mismatch: HP heater 6 terminal difference, suggesting a heater performance issue.
A Heater Problem Found Through the Model
This exchange shows how a performance engineer might use iFactory’s process model.
iFactory ships as a pre-configured NVIDIA AI server, racked and ready with the process simulation and performance modelling models loaded. Rack it, plug in power and Ethernet, and the AI is live on your network. Our scope covers sensors and data connections across boilers, turbines and feedwater systems, DCS, PLC/SCADA, historian and ERP integration, cabling and network setup, operator and quality team training, and 24×7 remote monitoring.
Server installed, DCS and historian links live, historical operating, performance and maintenance data loaded.
Models calibrated on your own unit data, then run in advisory mode on one unit with your operations and performance engineers reviewing every output.
Rollout to the agreed units under your change management, operator and engineer training, and 24×7 remote monitoring in place.
Software, server and integration come as one package. For pricing on your units, contact our sales team.
Frequently Asked Questions
It models heat and mass balances of the plant cycle, from fuel and combustion through the boiler, turbine, feedwater heaters and condenser, to predict performance at any operating point.
Steady-state models show performance at fixed operating points, ideal for efficiency and upgrade studies. Dynamic models show behaviour over time, needed for start-ups, ramps, trips and control tuning.
Commercial packages such as the Thermoflow family, GateCycle and Ebsilon are widely used, alongside dynamic simulators, custom models and hybrid physics and data models connected to plant data.
Design models describe the plant as intended. Calibration tunes equipment parameters to match real data, and the adjustments themselves reveal degraded equipment.
Part-load efficiency curves, costing equipment degradation, evaluating upgrades, assessing fuel changes, seasonal output limits and low-load or cycling operation.
A first calibrated steady-state model of a unit typically takes weeks once data is available. Plan it with our engineers.
Make Every Thermodynamic Decision With a Model You Trust
iFactory builds and calibrates process models of your units and keeps them current, so part-load, upgrade and degradation questions get calculated answers instead of rules of thumb.
Illustrative. Part-load curves from the calibrated model support dispatch and bidding.